


A Guide to Swing Trading: Examples, Tips & Strategies
Swing trading bridges the gap between day trading and long-term investing. Learn how to capture short to medium-term price moves, master proven swing trading strategies, and find out if this flexible, structured trading style fits your goals.

Swing trading is an effective trading style that capitalises on short to medium-term price movements in the financial markets. Unlike day trading, where traders typically close their positions within a single trading session, swing traders hold their trades for days or weeks to capitalise on market opportunities.
The goal is to capture market swings that occur as part of a broader trend, making this method a favourite among traders who want to balance their time commitment with potential returns.
In this guide, we’ll break down the core principles of swing trading, walk through proven strategies, and compare it to day trading. You’ll also discover key tools, chart setups, and technical indicators used by successful swing traders.
Whether you’re just starting out or refining an existing strategy, this article offers practical insights to strengthen your trading edge.
Real-World Example of a Swing Trade
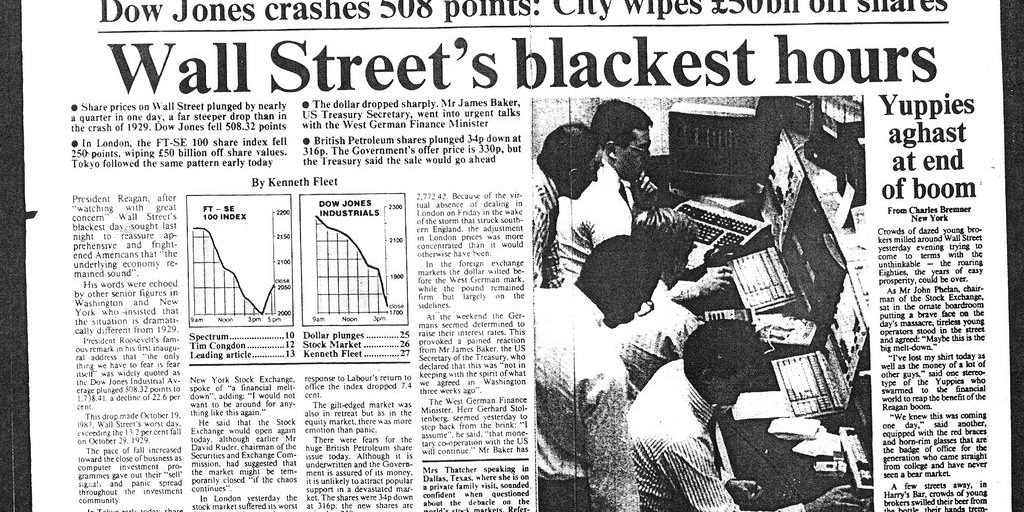
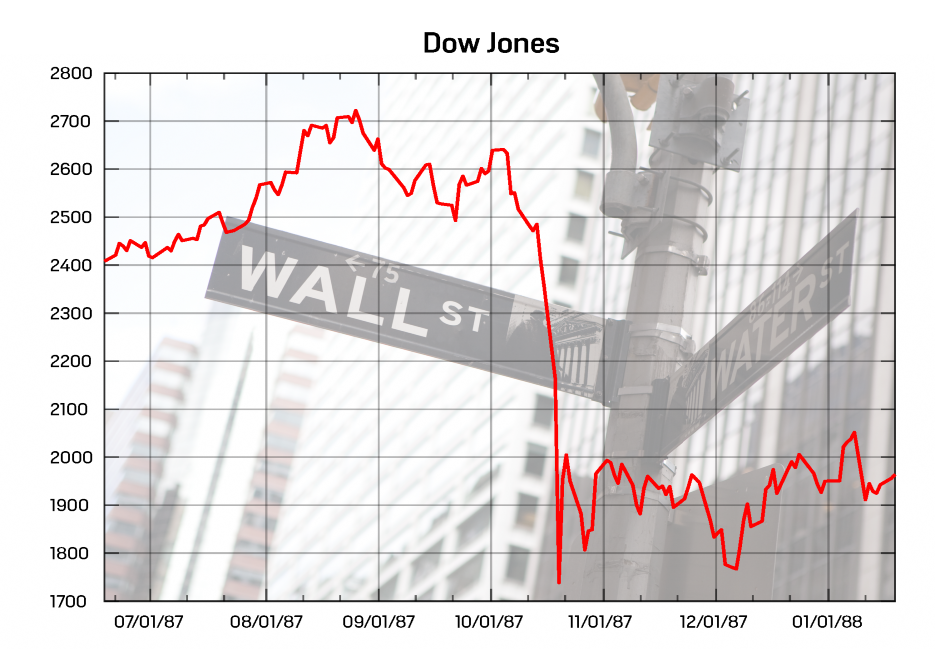
One of the most famous swing trades in history was made by hedge fund manager Paul Tudor Jones just before the 1987 market crash. Using historical chart patterns and macro signals, he anticipated a severe downturn and opened short positions ahead of Black Monday.
Source: Trading game
When the Dow Jones plunged 22% in a single session, Jones turned that foresight into an estimated $100 million profit—showcasing how strategic swing positioning, backed by conviction and timing, can yield extraordinary results.
Source: International Banker
Benefits of Swing Trading Strategies
Less Screen Time, More Flexibility
Unlike day trading, swing trading doesn’t require constant monitoring. Positions are held for several days, allowing traders to analyse markets just once or twice daily—ideal for those balancing trading with other responsibilities.
Structured Yet Adaptable
Swing trading fits around full-time work, family, or business commitments. With tools like alerts and stop-loss orders, traders can automate key decisions and stay engaged without being glued to the screen.
Potential for Stronger Returns
By capturing multi-day price swings, swing traders often target larger moves than scalpers or day traders. This approach can lead to more consistent gains—without the psychological fatigue of high-frequency trading.
Fewer Transactions = Lower Costs (With Some Exceptions)
Swing trading usually involves fewer trades than high-frequency strategies like day trading. This reduced trade volume can translate to lower transaction costs—particularly for accounts with flat-rate pricing or low commissions.
At FXIFY, traders benefit from our tailored price feeds with no hidden markup on spreads, which can support swing strategies that depend on tighter execution costs. That said, cost efficiency depends on more than just frequency.
Here are some factors that can affect overall trading costs:
- Swap or rollover fees: Common in forex and CFD accounts, these fees can add up if positions are held for several days.
- Margin interest charges: Borrowing costs on leveraged positions may accumulate over time, especially in volatile markets.
- Broker-specific structures: Some platforms apply inactivity fees, minimum trade size rules, or wide spreads that eat into profit margins.
Ultimately, traders should review the full cost structure of their broker—including spreads, commissions, and hidden fees—to determine whether swing trading aligns with their capital and strategy.
Swing Trading Strategies
Successful swing traders use a variety of strategies to identify trading opportunities. Below are a few proven strategies that can help you become a more effective swing trader.
1. Moving Average Crossover Strategy
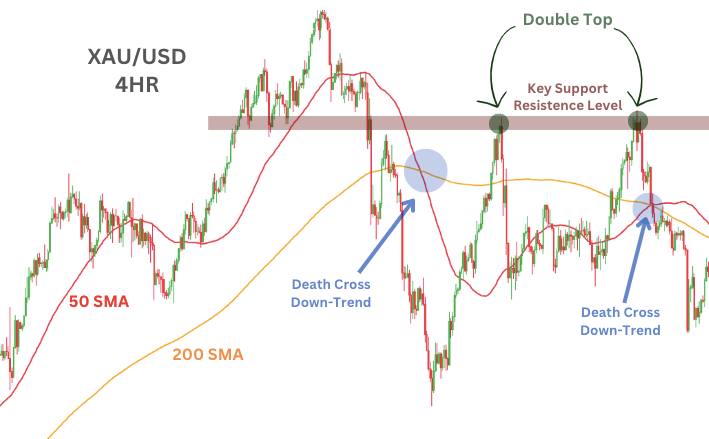
(Chart showing 50-period and 200-period SMAs applied to the 4-hour XAU/USD chart.)
This chart highlights two bearish Death Cross patterns, reinforced by a key support zone and a distinct double top formation. When these technical signals are properly identified and utilised, they can offer excellent swing trading opportunities.
The moving average crossover strategy is a widely used technique for identifying trend reversals and trade opportunities.
This swing trading strategy involves two moving averages: a short-term moving average (such as the 50-period SMA) and a long-term moving average (such as the 200-period SMA).
The period refers to the number of candles or bars on the selected timeframe. For example, a 50-period SMA on a 4-hour chart reflects the average of the last 50 four-hour sessions.
Traders adjust their moving averages depending on whether they are analysing hourly, daily, or weekly charts.
- A bullish crossover occurs when the short-term moving average crosses above the long-term moving average, signalling upward momentum and a potential buy opportunity. This is often referred to as the Golden Cross, indicating a strong trend shift to the upside.
- A bearish crossover happens when the short-term moving average crosses below the long-term moving average, suggesting downward momentum and a sell opportunity. Known as the Death Cross, this signals a potential market downturn.
Moving Average Crossover in Action
These combined signals–Death Cross, resistance zone, and double top–highlight the importance of trading with confluence. A swing trader could enter a short position after the price breaks below the double top’s neckline, targeting the next support level while managing risk effectively.
Check out our Double Top Article for a detailed breakdown of double tops, their significance, and strategies for trading them successfully.
While day traders might use shorter timeframes and moving averages with smaller periods (e.g., 9-period and 21-period SMAs), swing traders typically use longer periods to avoid false signals and capture more sustained market movements.
2. Breakout Trading Strategy
A breakout happens when price moves above a resistance level or below a support level—breaking out of a range it’s been stuck in. This often signals the start of a stronger trend.
Swing traders use breakouts to catch big moves early, especially when momentum picks up.
One smart way to trade breakouts is to wait for a retest. After breaking out, price often comes back to test the old support or resistance zone. If it holds, it confirms the breakout—and offers a lower-risk entry.
Beginner Tip: Look for at least two or three touches (or “taps”) at the level before a breakout. The more times a level holds, the more meaningful the breakout tends to be.
Breakout Strategy in Action
This daily XAU/USD (Gold) chart shows a classic breakout setup using a rising trendline. The price taps the trendline three times, each touch weakening the level.
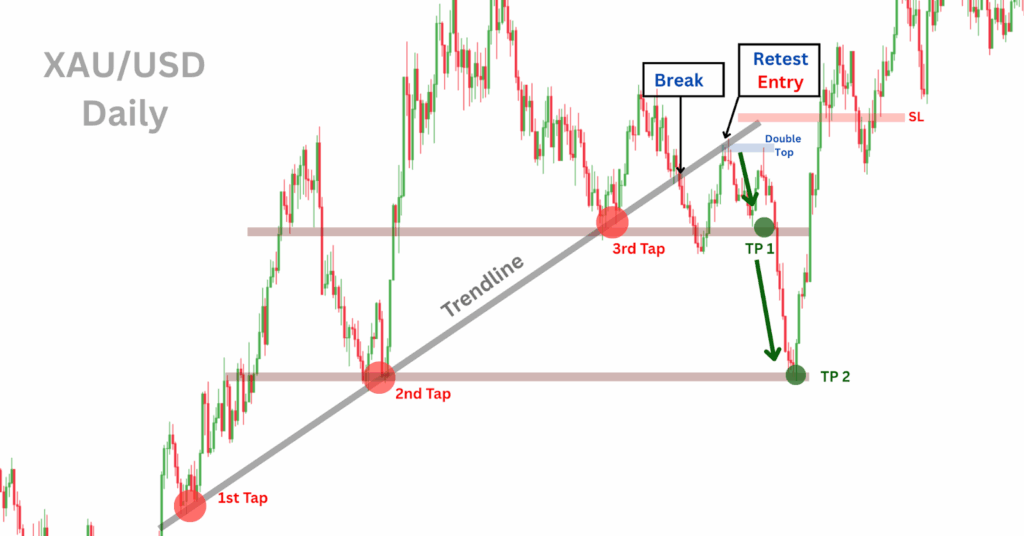
After the third tap, the trendline breaks—signalling a shift in momentum.
Once broken, price pulls back to retest the old trendline. When it holds as resistance, it confirms the breakout and offers a clean short (sell) entry.
Traders might:
- Take a partial profit at the next nearby support zone (TP1), and
- Close the full position at a deeper, major support (TP2).
This approach combines breakout structure, retest confirmation, and disciplined risk management—a powerful setup for swing traders aiming to enter with confidence.
3. RSI Overbought/Oversold Strategy
The Relative Strength Index (RSI) is a simple tool that helps traders measure whether an asset is gaining or losing momentum. It shows a score between 0 and 100:
- A score above 70 means the market may be overbought (price has risen too fast and could pull back).
- A score below 30 means it may be oversold (price has dropped too far and could bounce).
Swing traders don’t use RSI on its own—but combine it with price patterns to confirm entry or exit points.
RSI Strategy in Action
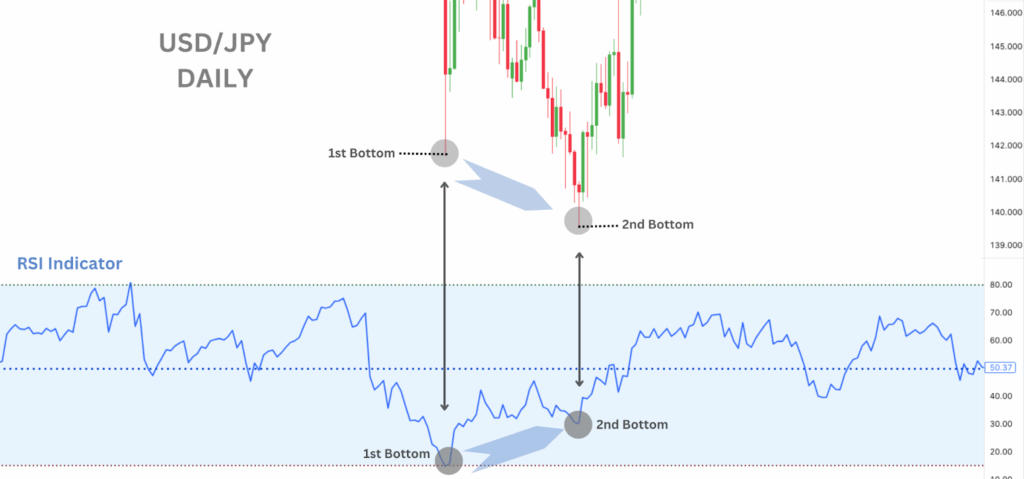
In the chart below, USD/JPY forms a double bottom—a bullish price pattern—while the RSI makes a higher low the second time. This mismatch is called bullish divergence and often means the downward pressure is weakening.
Together, the double bottom and RSI signal a possible trend reversal—helping the trader enter a long (buy) trade with more confidence.
How Swing Traders Use RSI
- Overbought (Above 70): May signal it’s time to take profits or look for a short trade.
- Oversold (Below 30): Could be a sign to consider a buy, especially near support.
- Divergence: If RSI and price move in opposite directions, a trend change may be coming.
- Failure Swings: When RSI turns without reaching extreme levels, it can show early signs of a momentum shift.
Beginner Tip:
Always use RSI with price action—like chart patterns, trendlines, or support zones. It helps filter out false signals.
Swing Trading vs. Day Trading
Understanding the difference between swing and day trading is key to choosing a style that fits your goals, schedule, and risk appetite.
| Swing Trading | Day Trading | |
| Holding Period | Days to weeks | Intraday |
| Time Commitment | Moderate | High |
| Transaction Costs | Lower (fewer trades) | Higher (many trades) |
| Stress Level | Lower | High (due to fast decision-making) |
| Risk Exposure | Overnight risk present | No overnight risk |
Swing trading suits those who value structure and flexibility, while day trading is better suited to traders who thrive in fast-paced, high-focus environments.
Essential Tools and Indicators for Swing Trading
Swing traders typically use a combination of trend, momentum, and volume-based tools to assess trade setups. While some of these indicators are more commonly associated with day trading, they can still provide valuable context when used on higher timeframes.
| Moving Averages | Help identify trend direction, strength, and potential reversals; core tool for swing trading strategies. |
| Relative Strength Index (RSI) | Measures momentum and overbought/oversold conditions; commonly used to refine entries and exits, supporting price structure analysis. |
| MACD (Moving Average Convergence Divergence) | Tracks momentum and trend strength over longer periods; often used on daily or 4H charts to confirm swing trade direction. |
| Volume | Helps confirm the strength behind breakouts or reversals. Best applied in combination with structure or trendlines. |
| Chart Patterns | Patterns like head and shoulders, triangles, and flags provide key entry and exit signals for swing trading strategies. |
| Fibonacci Retracement | Helps identify potential support and resistance zones based on key retracement levels (38.2%, 50%, 61.8%), often used for pullback entries in swing trading. |
| Bollinger Bands | More common in short-term trading, but can assist swing traders in identifying overextended moves or volatility compression. |
Is Swing Trading a Good Fit for You?
Swing trading suits traders looking for a balance between flexibility and structure. You might find this style effective if you:
✅Prefer holding trades for days or weeks—not minutes or months.
✅Want to trade part-time around a job or other responsibilities.
✅Are comfortable leaving trades open overnight or through weekends.
✅Have a working knowledge of chart patterns, price action, and indicators.
✅Can follow a clear plan without reacting emotionally to market swings.
That said, swing trading may not suit everyone. It tends to be less ideal for:
❌High-speed traders who seek fast-paced, intraday action.
❌Passive investors focused on long-term compounding with minimal trade activity.
❌Risk-averse personalities who dislike leaving positions exposed to overnight gaps.
❌Undisciplined traders who enter impulsively or abandon strategies too easily.
❌Those unwilling to analyse charts regularly, even if not trading daily.
Ultimately, swing trading offers a structured yet flexible approach—ideal for traders who want meaningful market exposure without full-time screen time.