Forget emotions. Forget hesitation. Trading bots don’t flinch — they execute. Welcome to the future of trading: fast, rules-based, and ruthlessly consistent — but only as smart as the strategy behind them.
Automated trading is reshaping how traders participate in today’s financial markets. This form of trading allows you to delegate your rules-based trading process to a powerful software platform.
Whether you call them trading bots, Expert Advisors (EAs), or algorithmic trading systems, these systems can bring a decisive advantage when it comes to executing trades without hesitation or emotions.
Let’s walk through what trading bots and EAs do, the advantages and risks, and how you can leverage their use in your personal and prop trading today.
1. What Are Trading Bots & Expert Advisors?
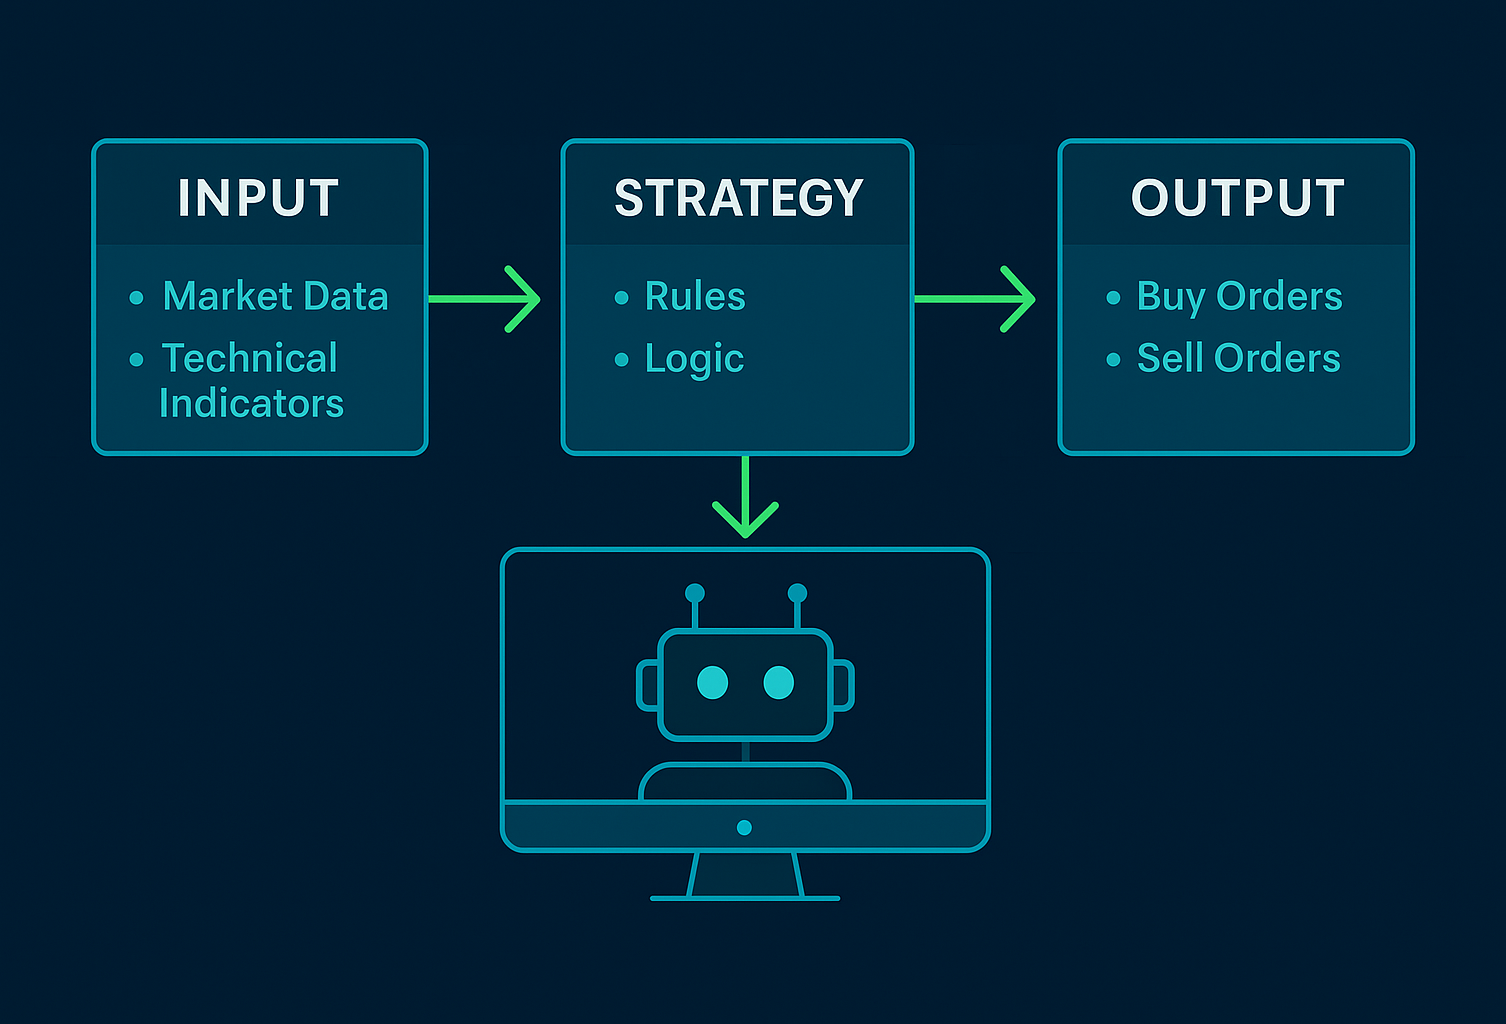
Automated trading bots, also known as Expert Advisors (EAs), are programs designed to automate trade execution. These algorithms analyse market data; then executes buy or sell orders based on a predefined trading strategy. An automated trading platform like MetaTrader5 (MT5) offers a user-friendly interface for traders to build or run these tools.
Key characteristics of these automated trading systems include:
- Rule-Based Logic: They operate on a strict set of parameters, often using technical indicators to define entry and exit points.
- Speed: They can place trades in fractions of a second, capitalising on fleeting market movements.
- Versatility: A trading bot can be simple (e.g., a moving average crossover system) or highly advanced, using machine learning to adapt to new market conditions.
- Platform Integration: Many bots are built with languages like MQL4/MQL5 for seamless integration with popular trading platforms.
However, the success of these automated systems depends entirely on the strength of their underlying strategy and diligent risk management. Before you start trading with a funded account or on prop firm challenges, thorough testing on a demo account is vital.
2. Automated Trading in a Prop Firm Challenge
Automated trading can be highly effective, but prop firm challenges place strict rules on risk management, daily drawdowns, and maximum losses. At FXIFY™, traders are permitted to use personal EAs and custom-built bots that reflect their strategy, but are not permitted to use copied or commercial products.
One clear advantage of automated trading in a prop environment is maintaining discipline. A well-coded bot removes human error and emotional trading impulses, executing the plan as designed even under pressure. This can help meet evaluation targets and respect rules for lot size allocation and daily drawdown.
However, challenges appear when the market changes rapidly. Bots may struggle with unexpected news releases or sudden changes in the market trend. Without active supervision, they can breach daily drawdown limits quickly. That’s why even automated trading strategies must be regularly tested and closely monitored to stay compliant with prop firm guidelines, such as our own.
| Aspect | Manual Trading | Automated Trading (Bots/EAs) |
|---|---|---|
| Discipline | Can be affected by emotions and trader error | Consistent execution based on predefined parameters |
| Emotional Decisions | High risk of overreacting or revenge trading | Reduced impulsive decisions |
| Drawdown Management | Needs constant attention and discipline | Adheres to coded risk parameters, but still needs supervision |
| Market Adaptation | Humans can adapt to news or volatility | May struggle with unexpected market volatility |
| Speed of Execution | Slower reaction time | Instant order placement |
| Compliance | Relies on the trader to stay within firm limits | Follows its programming but must be tested |
| Strategy Flexibility | Can change the plan on the fly | Only as flexible as programmed |
| Monitoring Needs | Varies by strategy (e.g., high for active day trading, lower for swing trading) | Still needs active monitoring for errors |
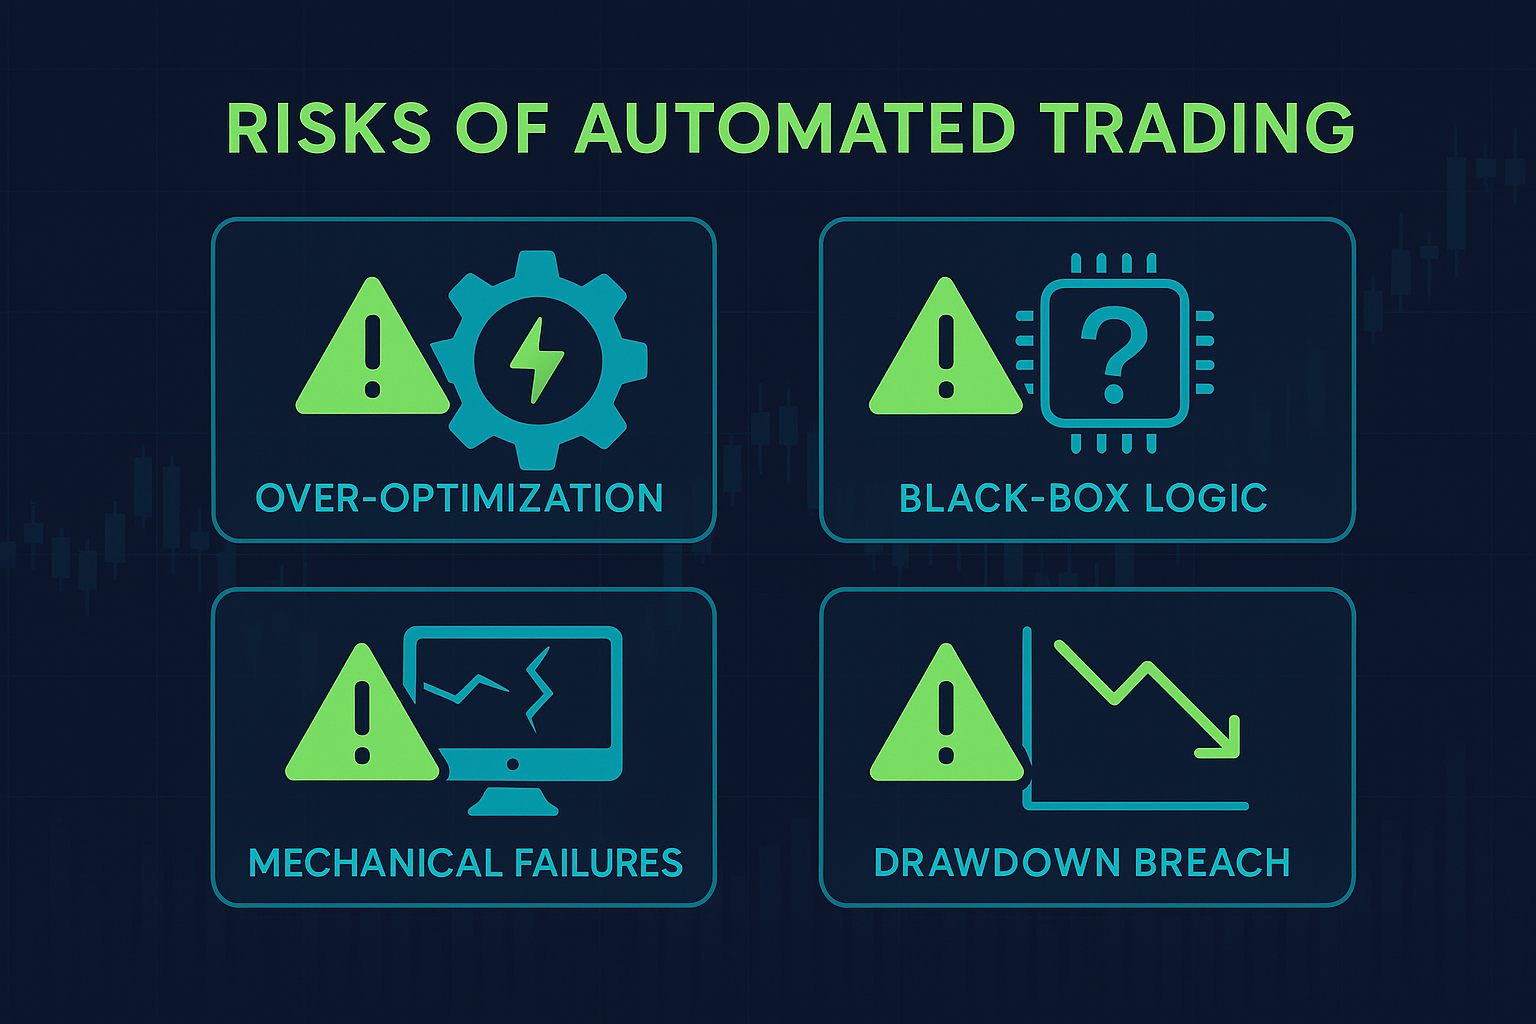
3. Key Risks & Pitfalls of Automated Trading Systems
Many automated trading systems carry significant risks. They could rely on aggressive methods like Martingale and grid trading — which are permitted at FXIFY — but can easily breach daily drawdown limits if unsupervised. These systems often react poorly to sudden market shifts, making close supervision essential.
Another issue is over-optimisation. A bot might pass backtests with flying colours but fail in live markets due to shifting price action and unpredictable slippage. Backtests cannot fully replicate live trading conditions, so thorough testing on a small live account is also vital.
Also, avoid relying on “black box” bots whose code you cannot inspect. Without understanding their algorithms, you expose your portfolio to irreversible losses. Remember, automated trading systems should support your trading goals, not replace your judgment entirely.
| Black Box refers to a third-party trading system or EA where the underlying code and trading logic are hidden from the user. You can see the inputs and outputs, but you cannot inspect the decision-making process. |
4. What to Look For in an Automated Trading System
When choosing or building an automated trading system, check for the following features, as they are the most critical in assessing how much flexibility and control you will have over the bot.
Strong risk controls, including stop-loss, take-profit, and carefully managed trade size, are non-negotiable in a prop firm setting. These protect you from sudden mechanical failures or sharp market movements.
Look for customisable settings to adapt your strategy as market structure shifts. Ensure the trading bot handles ECN brokers, price slippage, and fast execution reliably. Testing on a demo account under realistic conditions is essential before you begin trading with larger amounts of capital.
Finally, verify the logic. Avoid “black box” solutions with no transparency. Understanding the code and trading logic gives you confidence and control over your system, helping you maintain a sustainable automated trading process with consistent risk management.
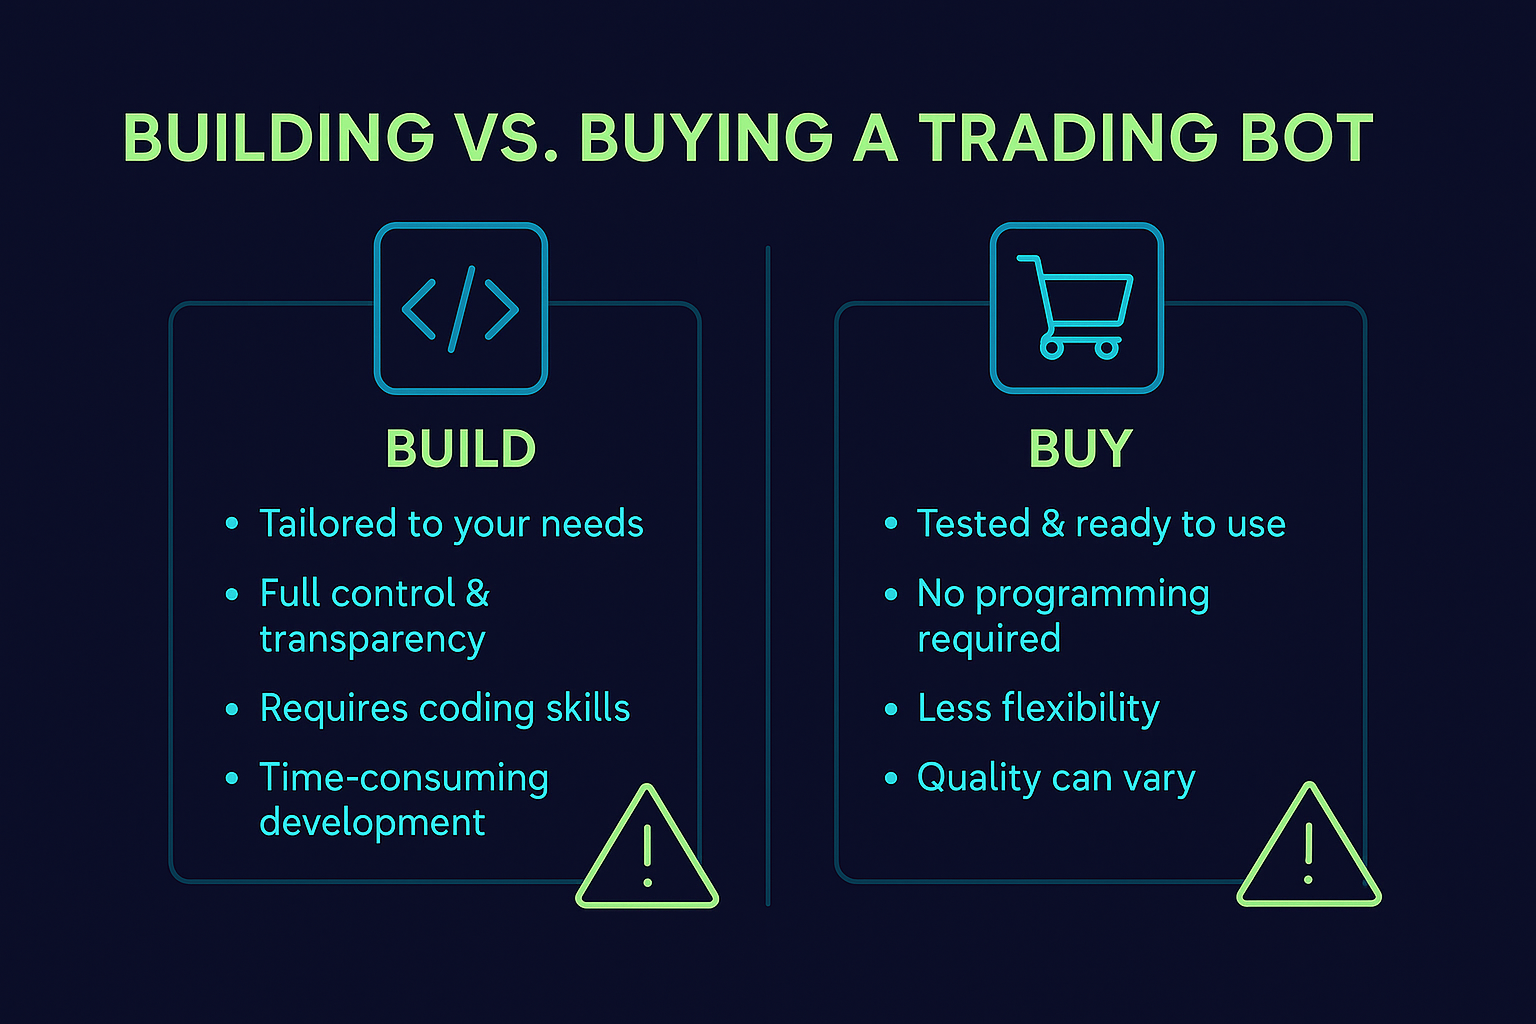
5. Building vs. Buying Your Automated Trading System
For prop firm traders, building your own trading bot is the superior choice. FXIFY permits personal automated strategies but restricts commercial, copied, or third-party trading bots. Coding your own, or working with a trusted developer under a strong NDA, ensures you control every parameter and protect your intellectual property.
A self-built system lets you refine lot sizes, risk parameters, and its algorithms whenever needed. You can align it with your investment goals and your specific trading activities. Unlike copy trading systems, your bot reflects your unique approach in the financial markets.
Buying an off-the-shelf Expert Advisor (EA) might seem like a simple shortcut, but this approach is unviable across most of the prop firm industry. The vast majority of prop firms prohibit or heavily restrict third-party EAs because they want to fund traders with unique strategies, not those using generic, widely available bots.
To succeed in a prop firm environment, prioritising the transparency, flexibility, and control of a self-built system isn’t just an advantage—it’s a necessity.
6. When Automated Trading Might Be Right for You
Automated trading is ideal when you have a proven manual trading strategy that you want to execute with more consistency. If your trading advantage comes from speed, repetition, or very specific technical indicators, automation can be powerful.
This type of software platform can help you monitor multiple markets, from the forex market to the stock market or commodities. Unlike some retail traders who may rely on intuition, advanced technology allows these algorithms to capture moves faster and with fewer emotional mistakes.
Still, automated systems need oversight. You must test, optimise, and refine the bot regularly. Automation should support your analysis and risk protocols, and never fully replace your own expertise.
To conclude, Automated Trading is…
Auto trading systems, including trading bots and EAs, can add huge value for disciplined traders. They remove common trader errors, keep emotions in check, and maintain rule-based precision. But they are not shortcuts to instant gains.
Learn more about FXIFY’s evaluations and funding programs here..
Frequently Asked Questions
Does automated trading work?
Yes, automated trading works if you build a solid strategy, apply disciplined risk management, and monitor it consistently. Many experienced traders rely on algorithmic trading for faster, rule-based execution.
Is it legal to automate trading?
Yes. Automated trading is legal in most financial markets, provided you do not break market manipulation laws or breach a broker’s or prop firm’s rules.
What is the 80% split in trading?
In prop firms, the “80% split” often means you can keep up to 90% of your trading gains when withdrawing from a funded account. At FXIFY, you can upgrade your split to 90% via an addon.
Can you achieve positive returns with auto trading?
Yes, but there are no guarantees. A strong trading system, solid risk parameters, and regular supervision give you the best chance to build long-term, sustainable returns.