


Bearish Engulfing Candle: A Comprehensive Guide to This Powerful Trading Signal
Ready to take on the bearish engulfing pattern? This powerful candlestick pattern signals a potential trend reversal, offering prime opportunities to short the market when used correctly.

What is a Bearish Engulfing Candle?
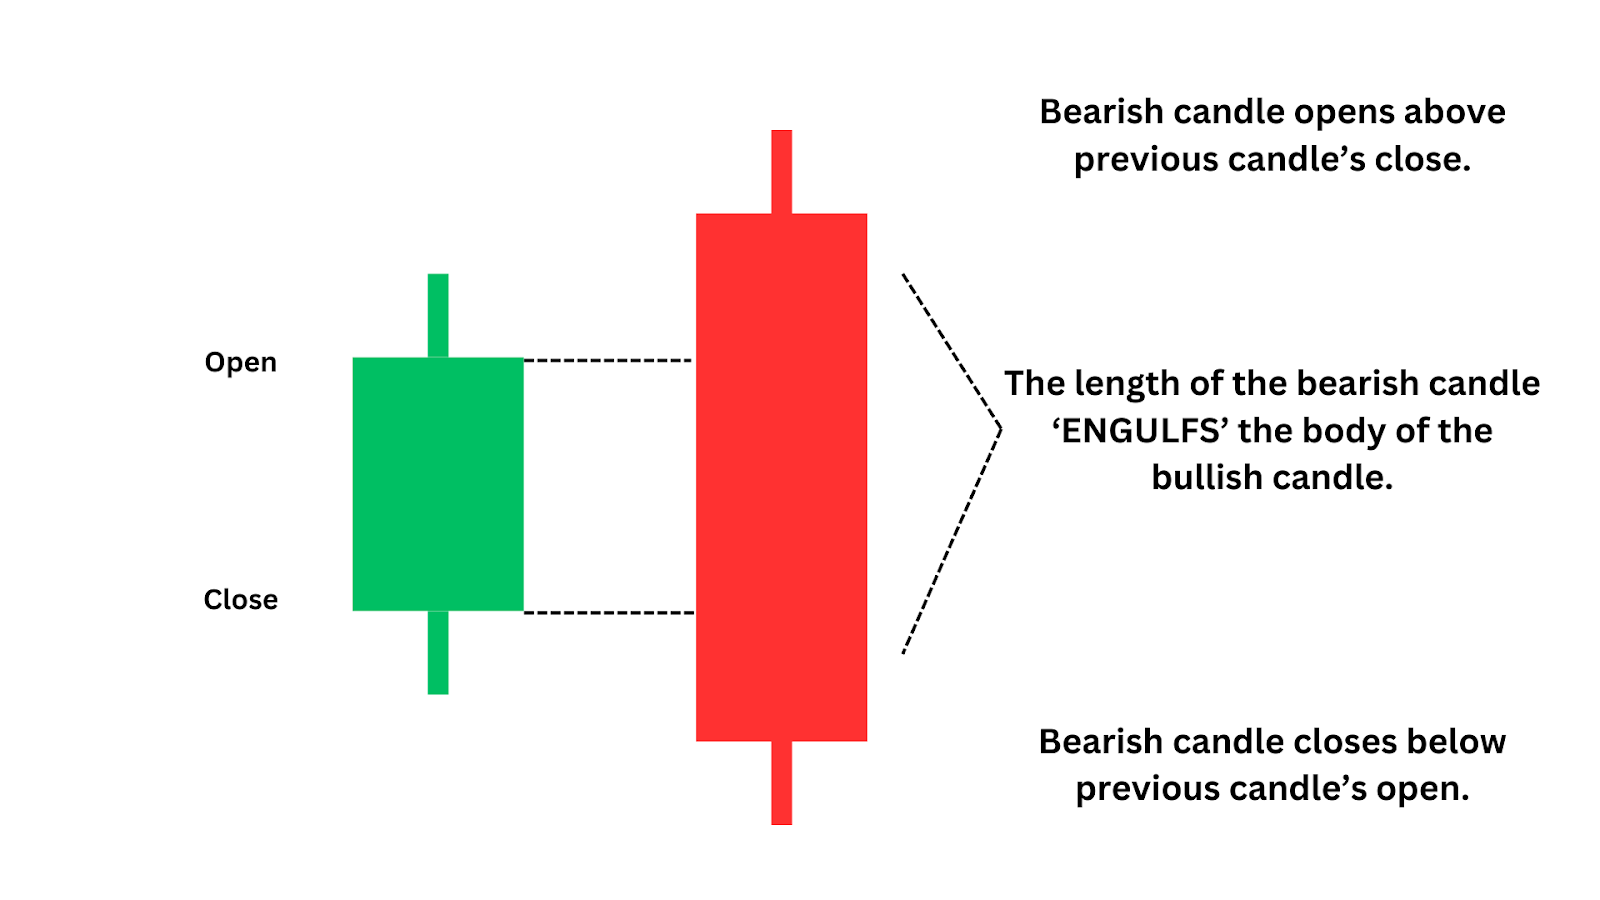
A bearish engulfing candlestick is a significant two-candle reversal pattern. It forms when a smaller bullish candlestick (upward) is followed by a larger bearish candlestick (downward) that completely engulfs the previous candle’s body.
Imagine a bright day suddenly overcast by a looming storm cloud – this pattern signifies that sellers have overshadowed buyers, potentially reversing the bullish trend into a bearish one.
Let’s see how it looks on live trading charts.
Examples of the Bearish Engulfing Candlestick Pattern
It’s important to remember that not all bearish engulfing candles are cut from the same cloth.
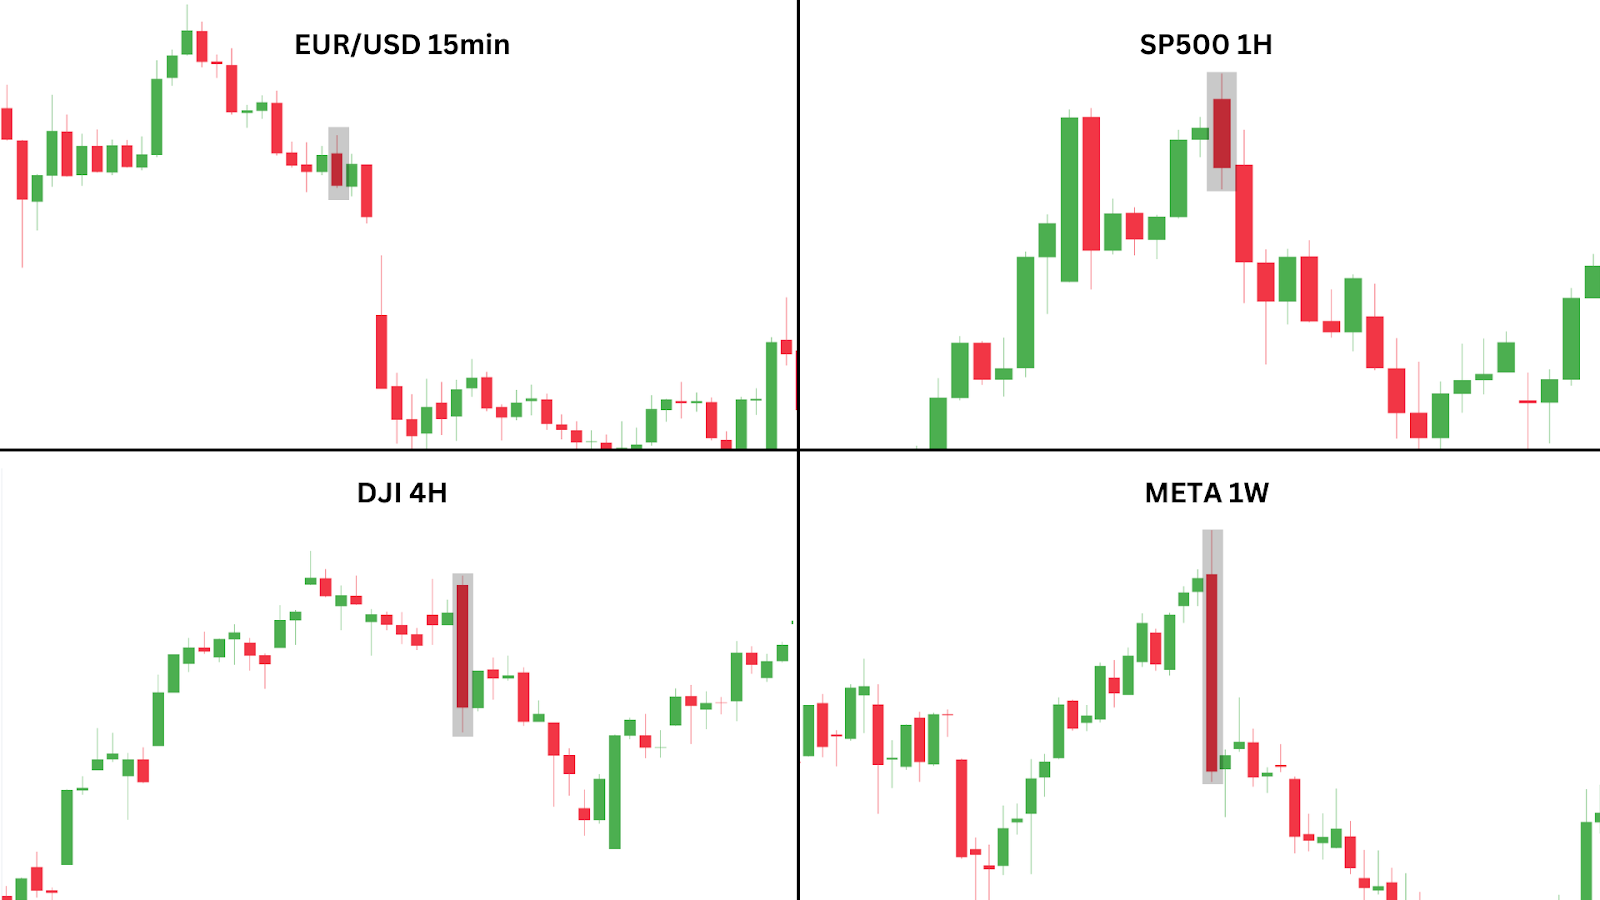
Generally, bearish engulfing patterns that emerge on higher time frames — like the daily, weekly, or monthly charts tend to give stronger signals. These patterns are often more reliable and less likely to be false alarms.
In addition, bearish engulfing candles that interact with key zones, such as those that sweep above previous swing highs and create new swing highs, as seen in the SP500 1H chart, often pack a stronger punch, indicating a more decisive shift in market sentiment.
Weaker bearish engulfing candles, on the other hand, may appear on lower time frames, fail to establish new swing highs, or appear in bullish macro environments where their impact isn’t as effective.
As we see in our EUR/USD 15 min example, bearish engulfing candles can form at the lows, but trading them requires caution and may not always be encouraged. Since this engulfing is at a support level, waiting for additional bearish confirmations is crucial to avoid getting caught in a false alarm (price continuing to the upside).
If you’re trading a bearish engulfing at support levels, some things you want to see in the candle are:
- Large wicks to the upside – Sellers have regained control, pushing the price back down.
- Minimal or no wicks to the downside – Weak buying pressure, without resistance to the selling force.
- Large candle body – Bigger bodies signal stronger bearish momentum.
- Closing through key levels – Watch for strong closes through important levels.
- High sell volume – Indicates genuine bearish intent behind the move.
- Bearish macro environment – A broader downtrend strengthens the signal.
In such cases, waiting for further confirmation before entering a trade can help mitigate the risk.
Case Study: Dow Jones Index Bearish Engulfing Pattern
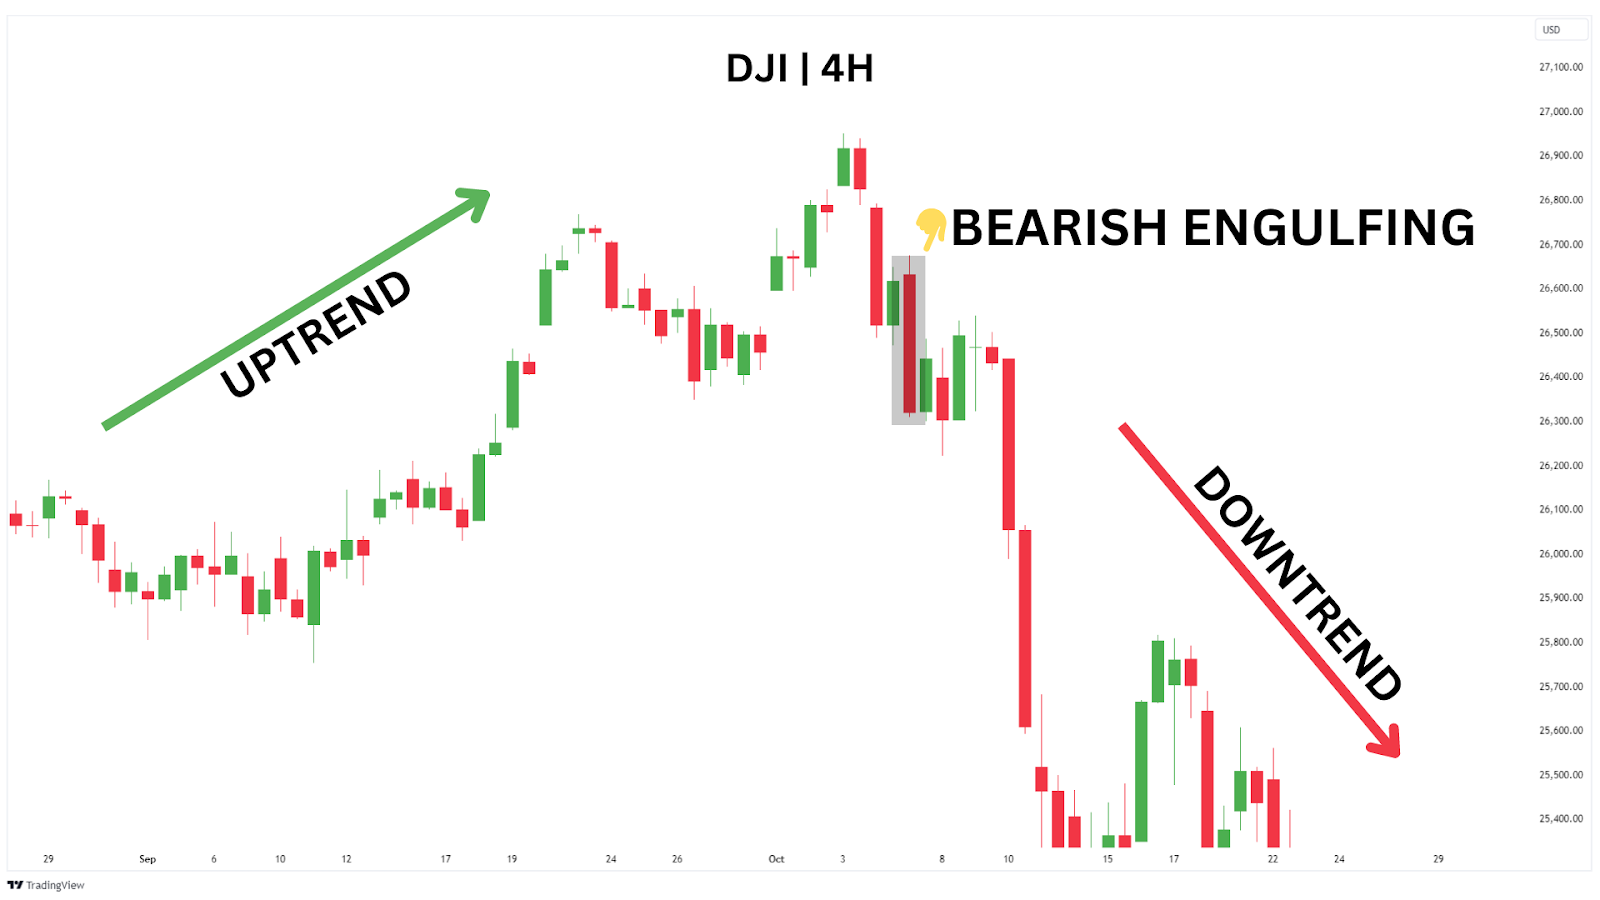
On Friday, 5th October 2018, the Dow Jones Index (DJI) showcased a textbook bearish engulfing pattern on the 4-hour chart. After a brief rally that swept the previous swing high, a large bearish engulfing candle formed, completely overtaking the prior bullish candle.
This bearish engulfing candle closed BELOW a previous swing low, further confirming that a new bearish downtrend was potentially forming.
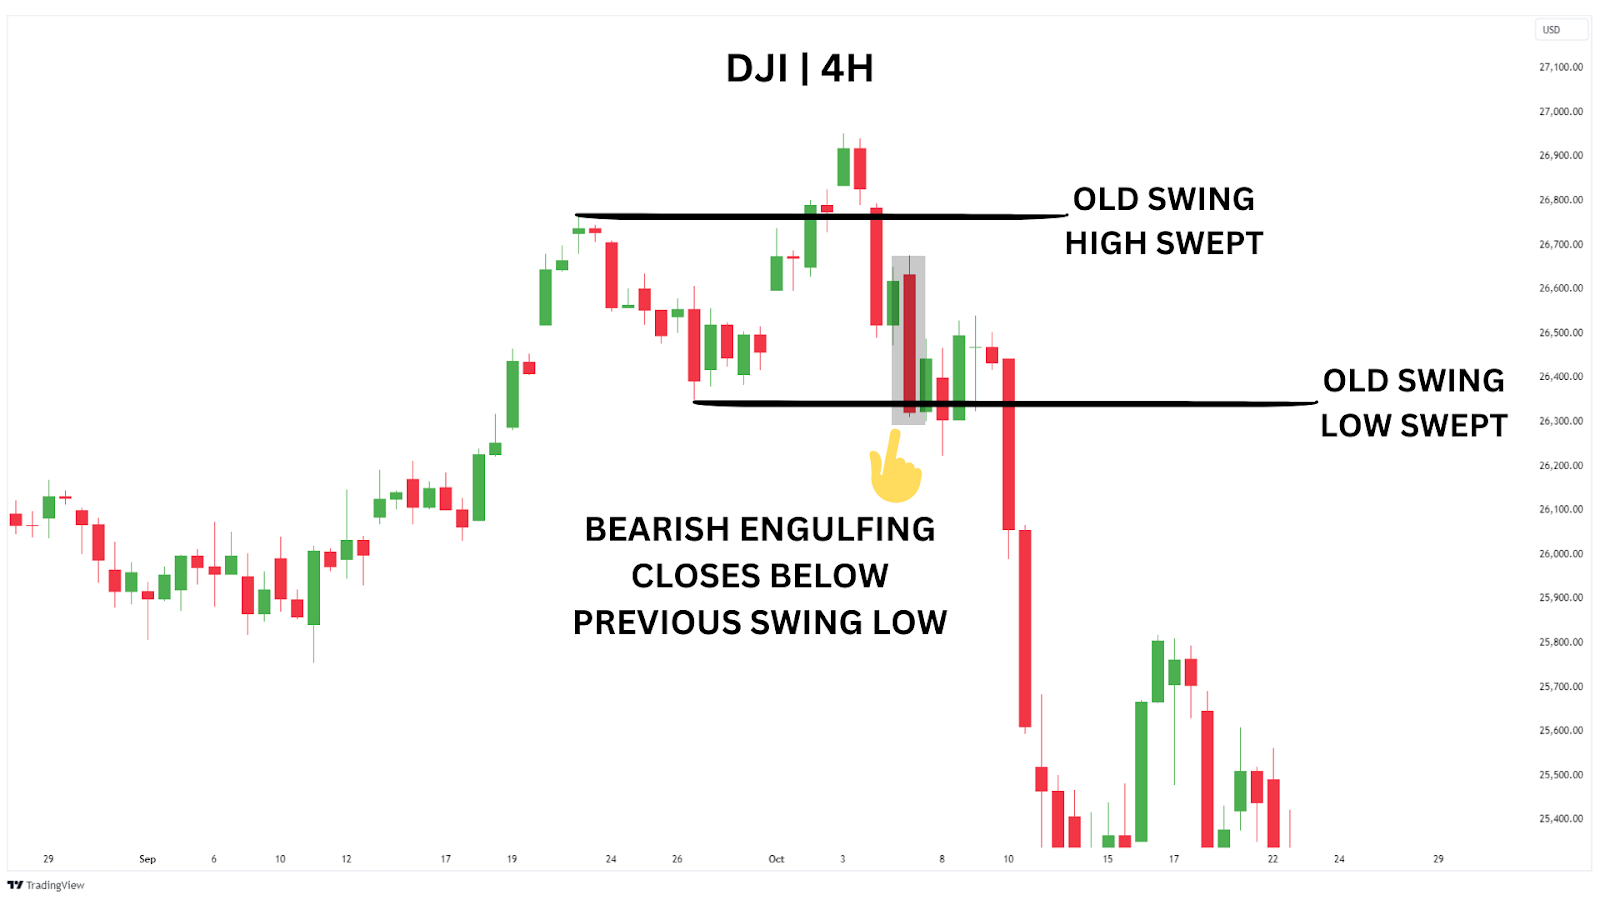
This decisive move also confirmed that the sweep above old swing high’s was significant and that the new swing high would likely hold.
Following this, the price continued to drop aggressively, validating the strength of this bearish engulfing pattern and signalling an excellent opportunity for traders looking to short the market while the price consolidated near those old swing lows.
Now that we’ve clearly understood bearish engulfing candles, let’s explore practical strategies for trading them effectively.
How Do You Trade Bearish Engulfing Candlesticks?
In trading, adaptability is crucial. A bearish engulfing candlestick pattern can be approached from multiple angles, but it’s your task to find the strategy that best aligns with your trading style.
If you’re new to trading, here are three effective strategies you can try.
Method One: Breakdown at Strong Support Level
A simple but effective way to trade bearish engulfing patterns is to look out for them occurring in previous resistance and support zones.
If price has tried to break a previous support/resistance multiple times in the past, and then a bearish engulfing confirms that sellers are in control, this can be an exceptionally powerful shorting signal.
Let’s zoom out on our Dow Jones Example from the case study and see what’s happening on the macro level.
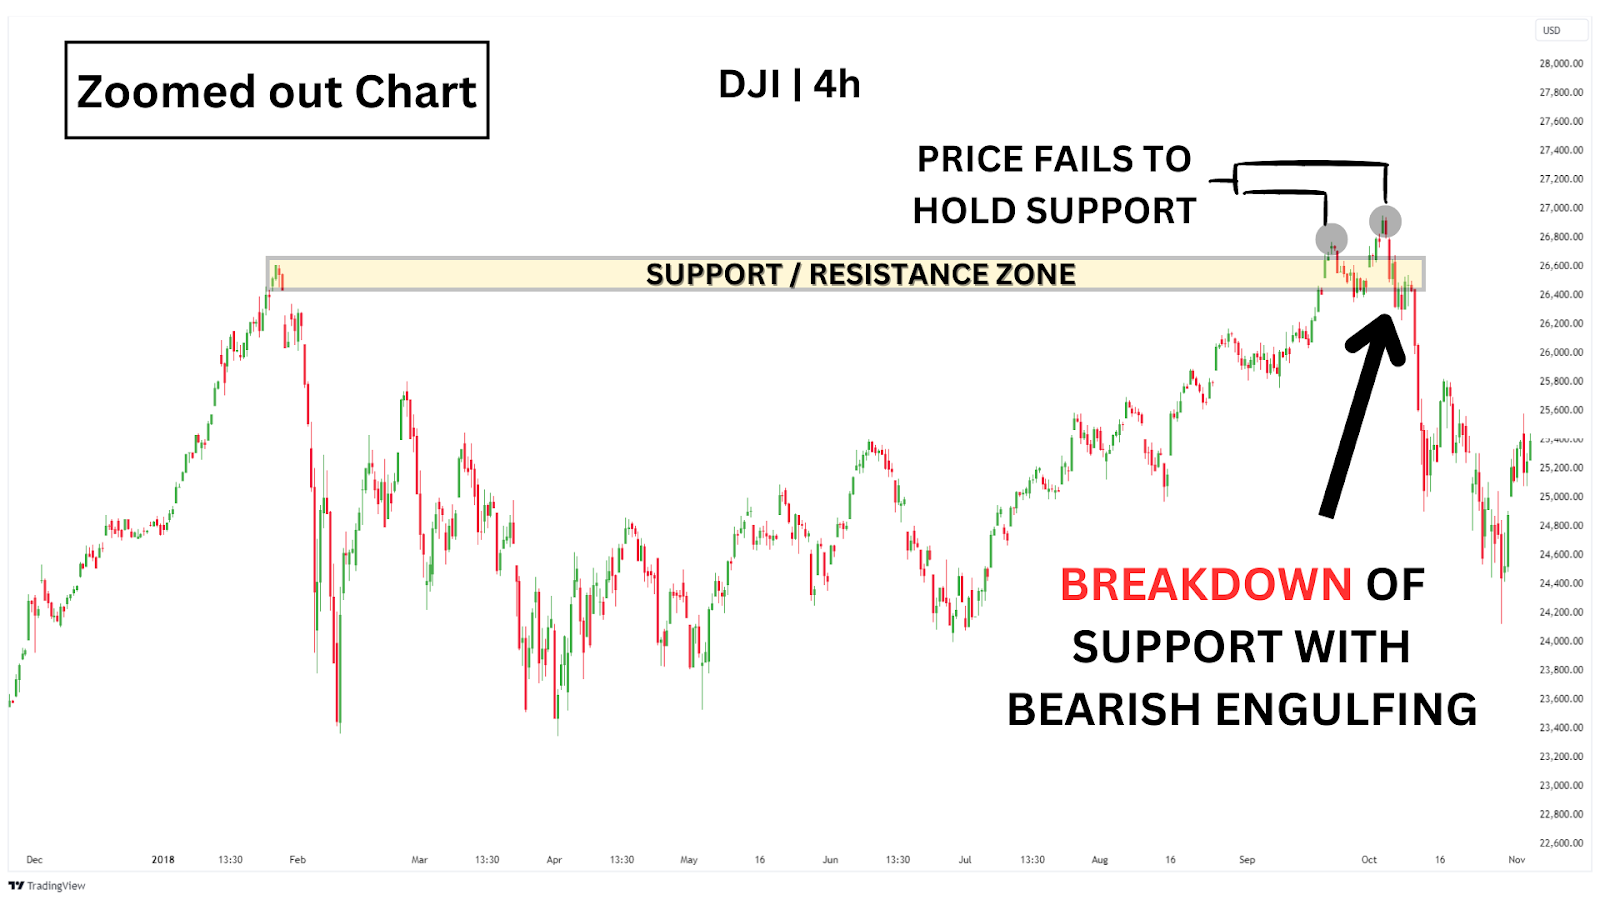
Now we can see the bigger picture, where a clear previous swing high has been identified as a key resistance zone. A breakout from this zone would indicate that the uptrend has resumed.
However, as we can see in the charts, the breakout attempt failed to hold this zone as a support level. Instead, the price action has formed a double top with a bearish engulfing candle breaking below our support zone.
This confirms that sellers have stepped in to push the price back below the support level with significant momentum, flipping it back into resistance (highlighted in yellow).
Contrary to the mantra of “Buy low, sell high”, the bearish engulfing candles can appear at the lows or a support level and still provide a powerful signal for a breakdown. Nonetheless, trading bearish signals at a support level can be risky. Therefore, traders should look for other bearish indications to improve the signal’s reliability.
For additional confirmation, we can watch for other bearish technical indicators and chart patterns. In this case, the formation of two swing highs close to each other could be viewed as a strong double top. If we draw a trendline between all three recent swing highs, we see a strong resistance level being respected.
Now, let’s zoom back in to better see what’s happening in the price action.
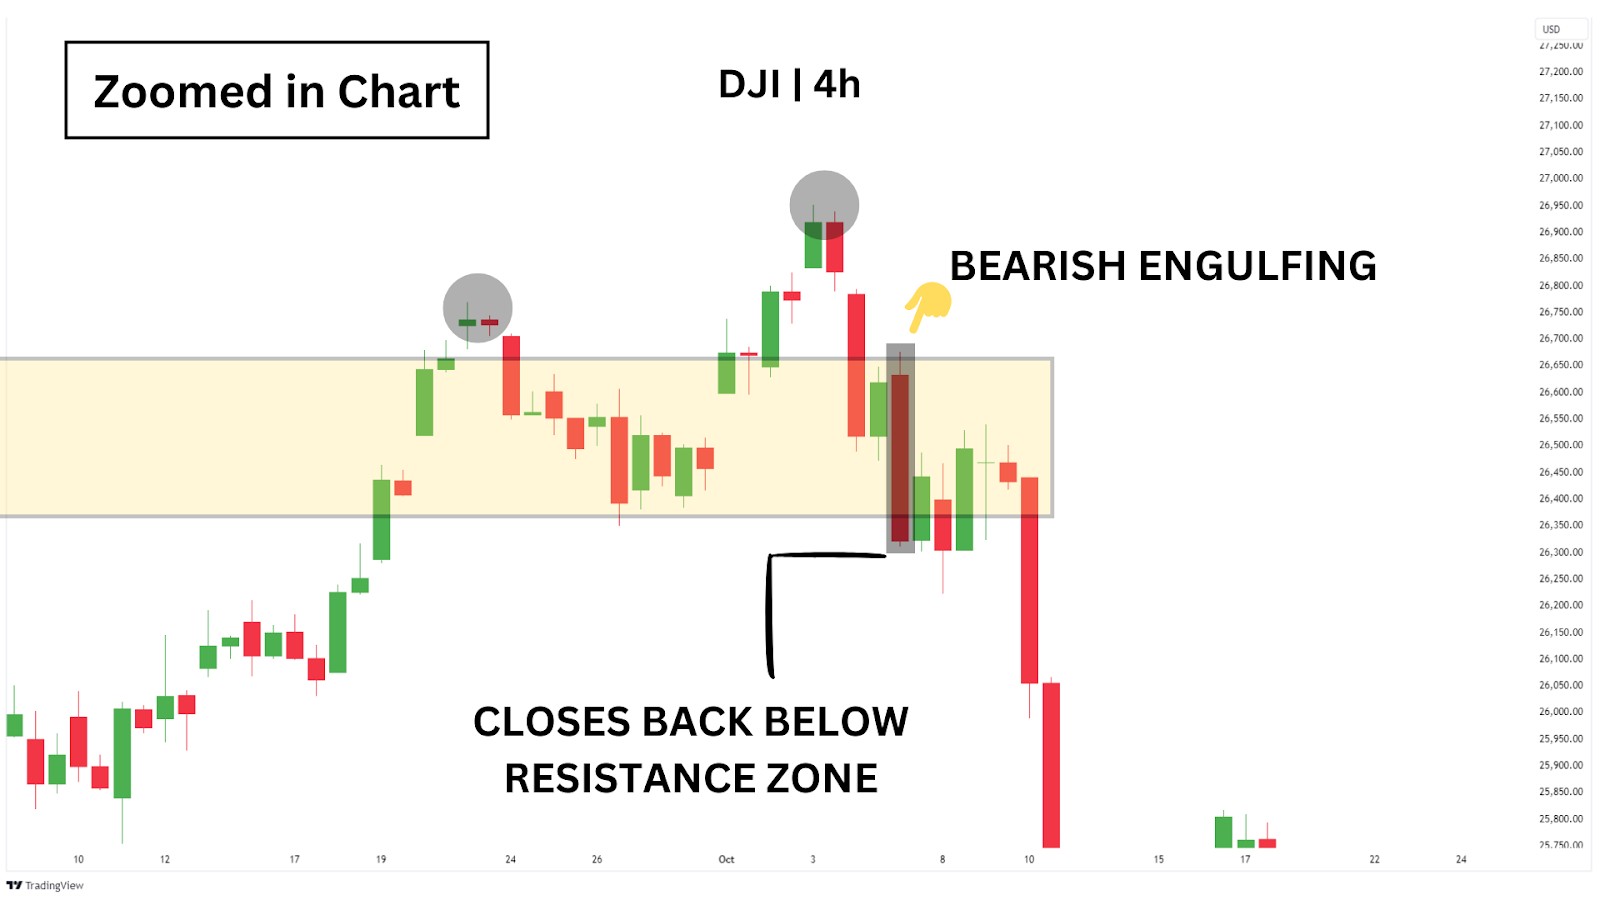
After a bearish engulfing pattern breaks and closes below the support zone, we are more confident in taking a breakout short trade.
As this is a beginner’s model, we will set limit orders on the closing price of our bearish engulfing, with our stop losses at the bearish engulfing’s high, and our take profits set mechanically at a 1:2 risk-to-reward ratio.
This removes all guesswork!
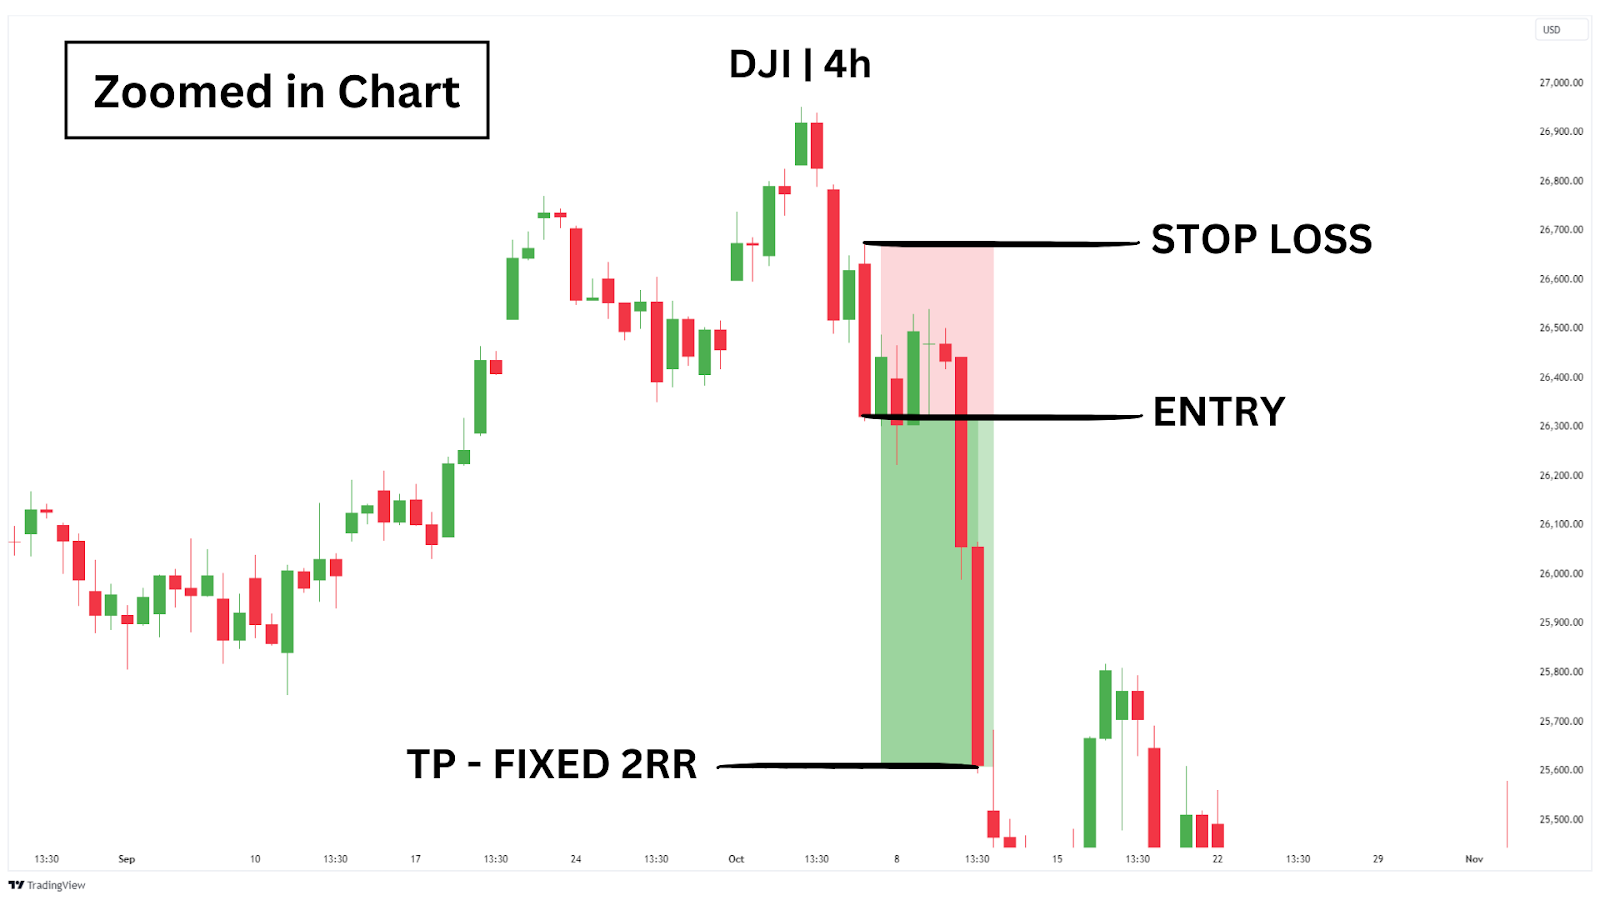
After setting up the stop-loss and take profit, the trader simply needs to wait for the outcome of the trade. As you can see, price continued aggressively to the downside, and our take profit was hit in the next 7 candles—a great day trade!
Trading Strategy Summary
Entry Point: Enter short on the close of the bearish engulfing candle when it forms at a strong resistance zone.
Stop-Loss: Place a stop-loss just above the high of the bearish engulfing candle.
Profit Target: Aim for a 1:2 risk-to-reward ratio
| Pros: Highly effective when trading in line with a strong bearish trend, offering clear entry points.Provides solid risk management by allowing for stop-loss placement just above resistance levels. |
| Cons: May generate false signals in sideways or ranging markets, leading to stop-outs.Requires patience as strong resistance zones may not appear frequently, limiting the number of trading opportunities. |
Method Two: Bearish Engulfing Teams Up with Bollinger Bands®
This strategy combines the bearish engulfing pattern with Bollinger Bands to identify precise entry points in volatile markets.
Start by adding the Bollinger Bands indicator to your chart. These bands highlight clear resistance and support levels, but remember to stay flexible—what begins as support can quickly flip to resistance.
As you study the examples below, note how price reacts to the bands, alternating between support and resistance. This dynamic action is where Bollinger Bands truly shine.
Now, let’s look at the 4-hour Dow Jones Index (DJI) chart and refine our risk-to-reward ratio using this indicator.
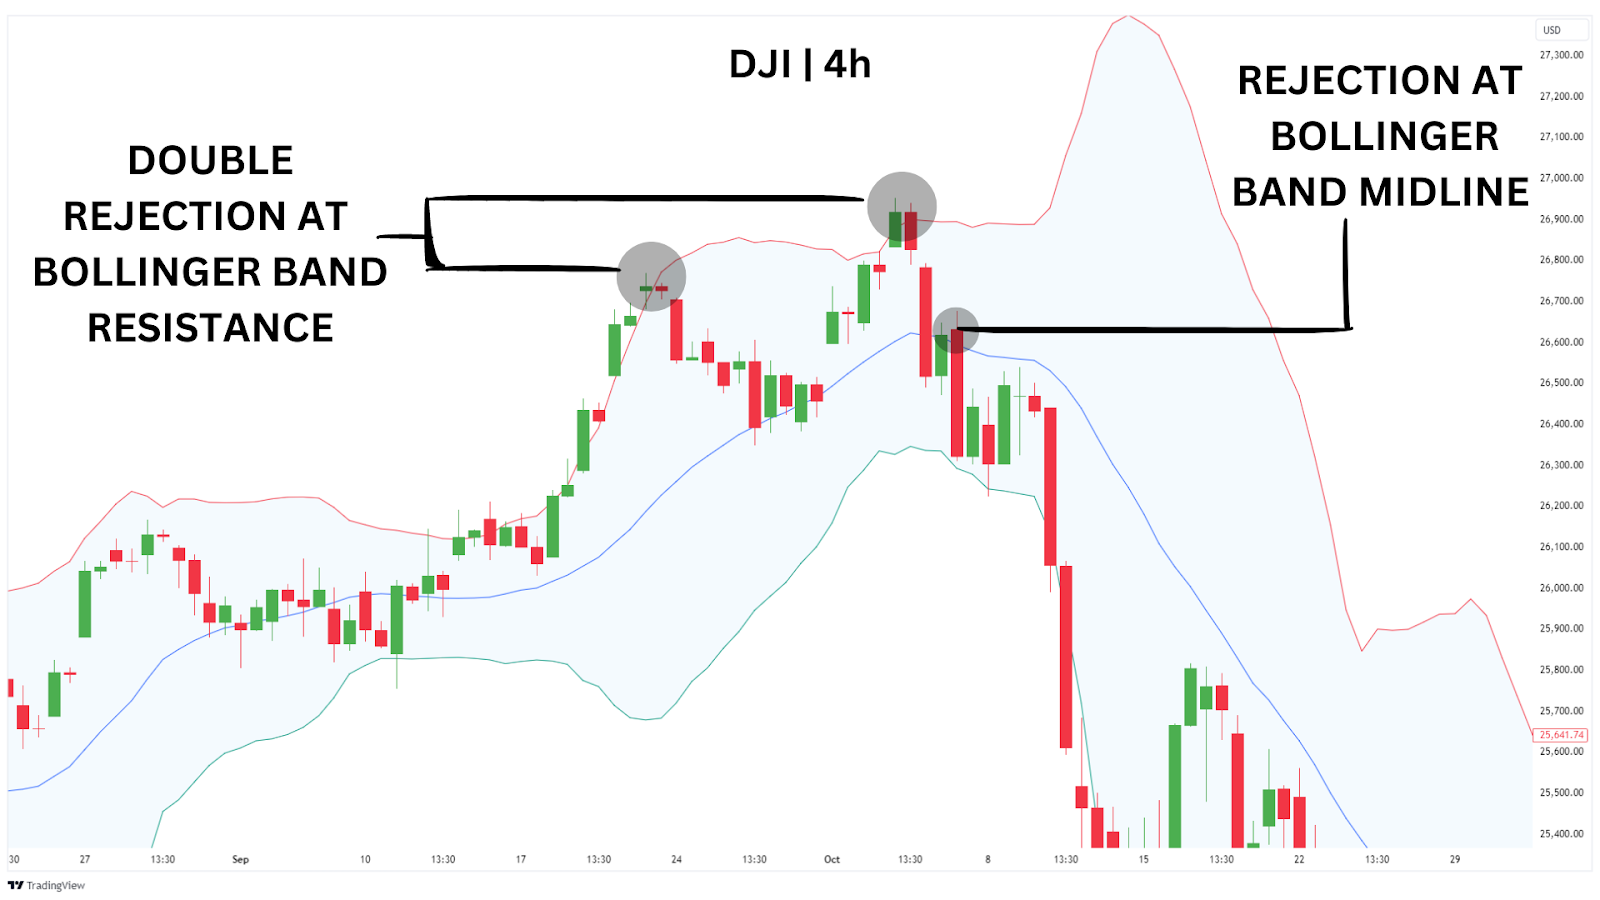
In this example, price rejects the upper Bollinger Band twice and forms a double top, adding further bearish confluence. The bearish engulfing candle then closes below the midline of the Bollinger Bands, signalling a potential shift from bullish to bearish momentum.
As the price touches the lower Bollinger Band, we expect a brief bounce before the downward move continues – this is where we can optimise our entry.
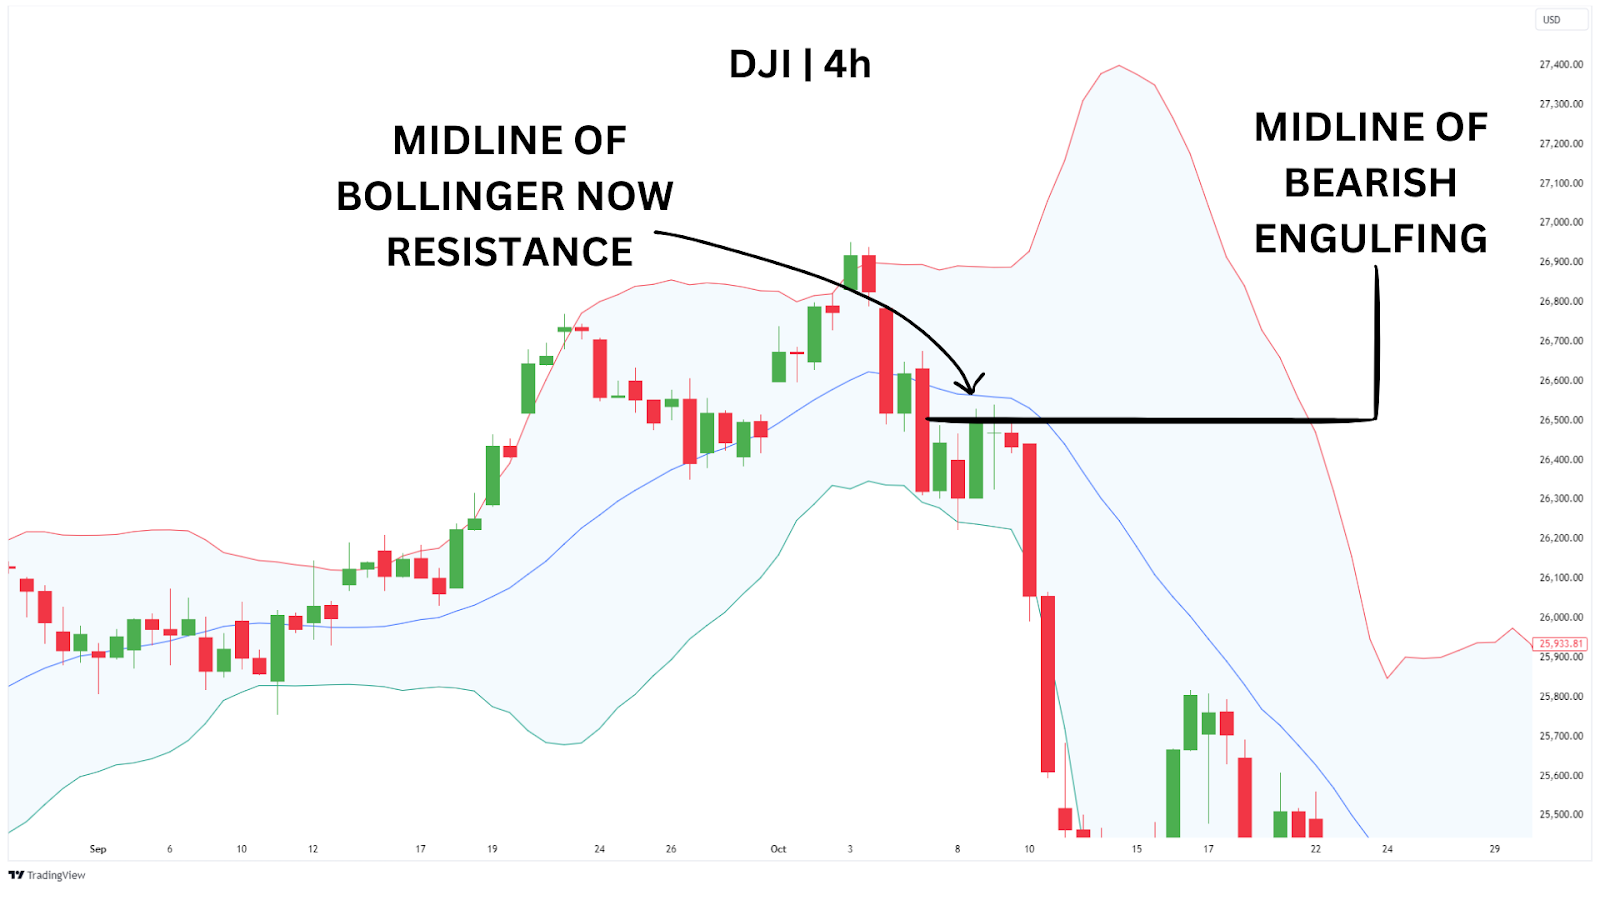
To do this, we’ll focus on the midpoint of the bearish engulfing candle, which sits below the midline of the Bollinger Bands.
Set your limit order at this midpoint.
For risk management, place your stop-loss just above the high of the engulfing candle, which also sits above the midline. Since this midline has flipped to resistance, this setup adds confidence that your stop-loss is well protected.
For a straightforward exit strategy, target the most recent swing low as your take-profit level.
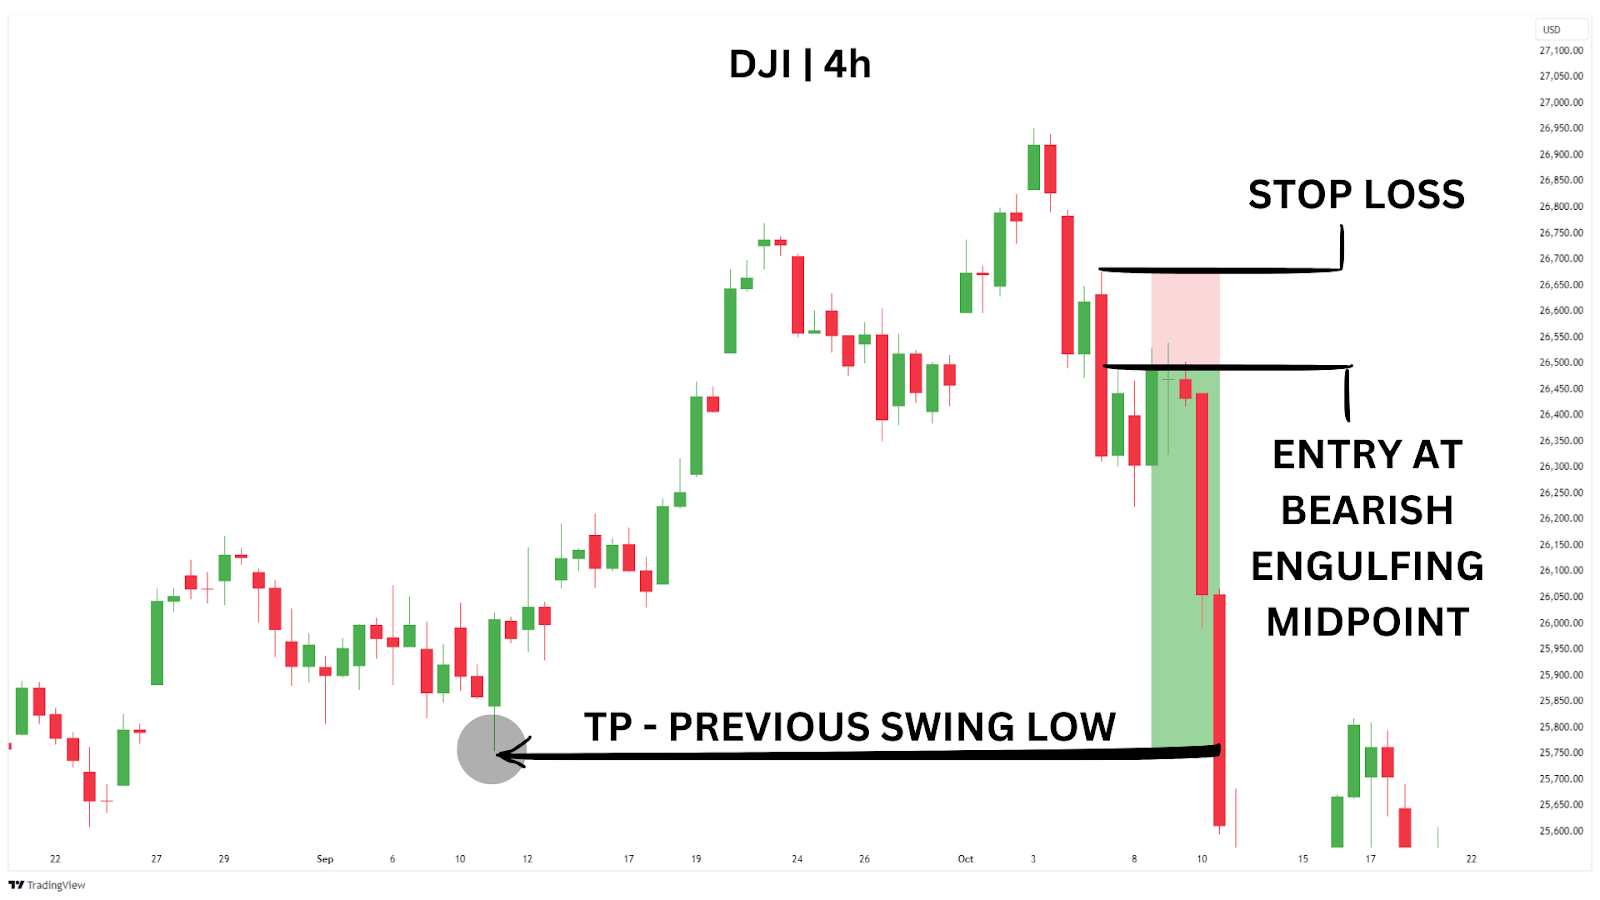
In this case, the trade achieves a 4.1RR in just a few candles, delivering a swift and successful outcome.
This methodical approach allows you to manage risk effectively while capitalising on the momentum shift confirmed by the bearish engulfing pattern!
Trading Strategy Summary
Entry Point: Set a limit order at the midpoint of the bearish engulfing candle. Use the Bollinger Bands as confluence.
Stop-Loss: Place a stop-loss just above the high of the engulfing candle. Use the Bollinger Bands as confluence.
Profit Target: Aim for the most recent swing low.
| Pros: High confluence setup with bearish engulfing and Bollinger Bands for precise entries.Enhanced risk management with the midline Bollinger Band acting as resistance. |
| Cons: Requires volatile markets to work effectively. May be complex for beginners due to reliance on multiple indicators. |
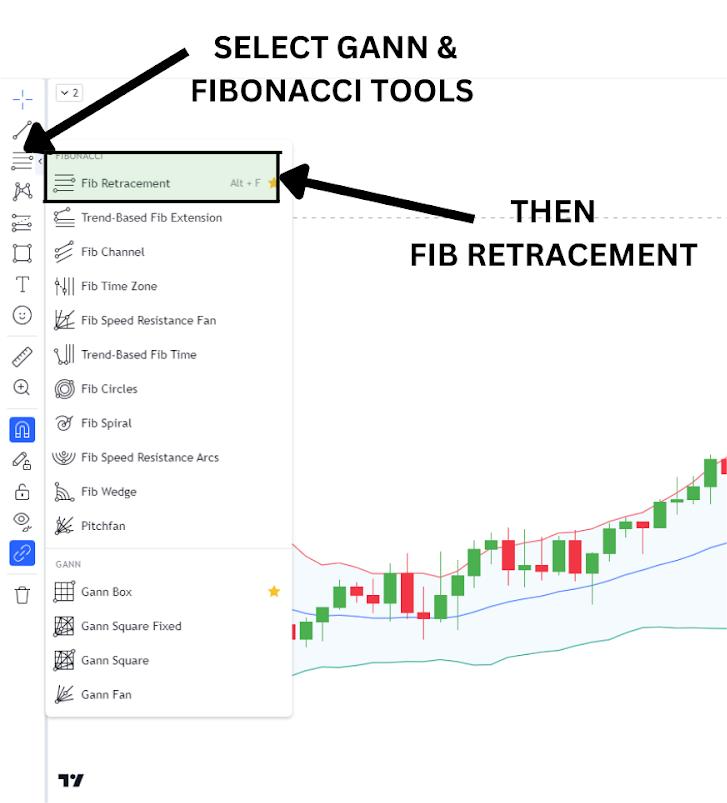
Method Three: Bearish Engulfing with Fibonacci Projection
This strategy utilises the Fibonacci retracement tool to target precise take-profits based on market retracements, focusing on bearish engulfing patterns during downtrends. It’s our most advanced method, but it can provide highly accurate take profit levels.
To begin, configure your Fibonacci tool to display only the 4 and 4.5 standard deviation levels. This setup helps you project where the market might extend its move, giving you clear take-profit targets.
Referring to our DJI 4H chart, look closely at the 4H candle BEFORE our bearish engulfing pattern. This is the small bounce within our downtrend. Draw your Fibonacci retracement tool from the low of this candle to our bearish engulfing high.
These levels are clearly seen in the image below, marked as RALLY HIGH and RALLY LOW. Drawing your fib tool from these points will plot the 4.0 and 4.5 standard deviations of this move on your chart. This is indicated by the grey zone.
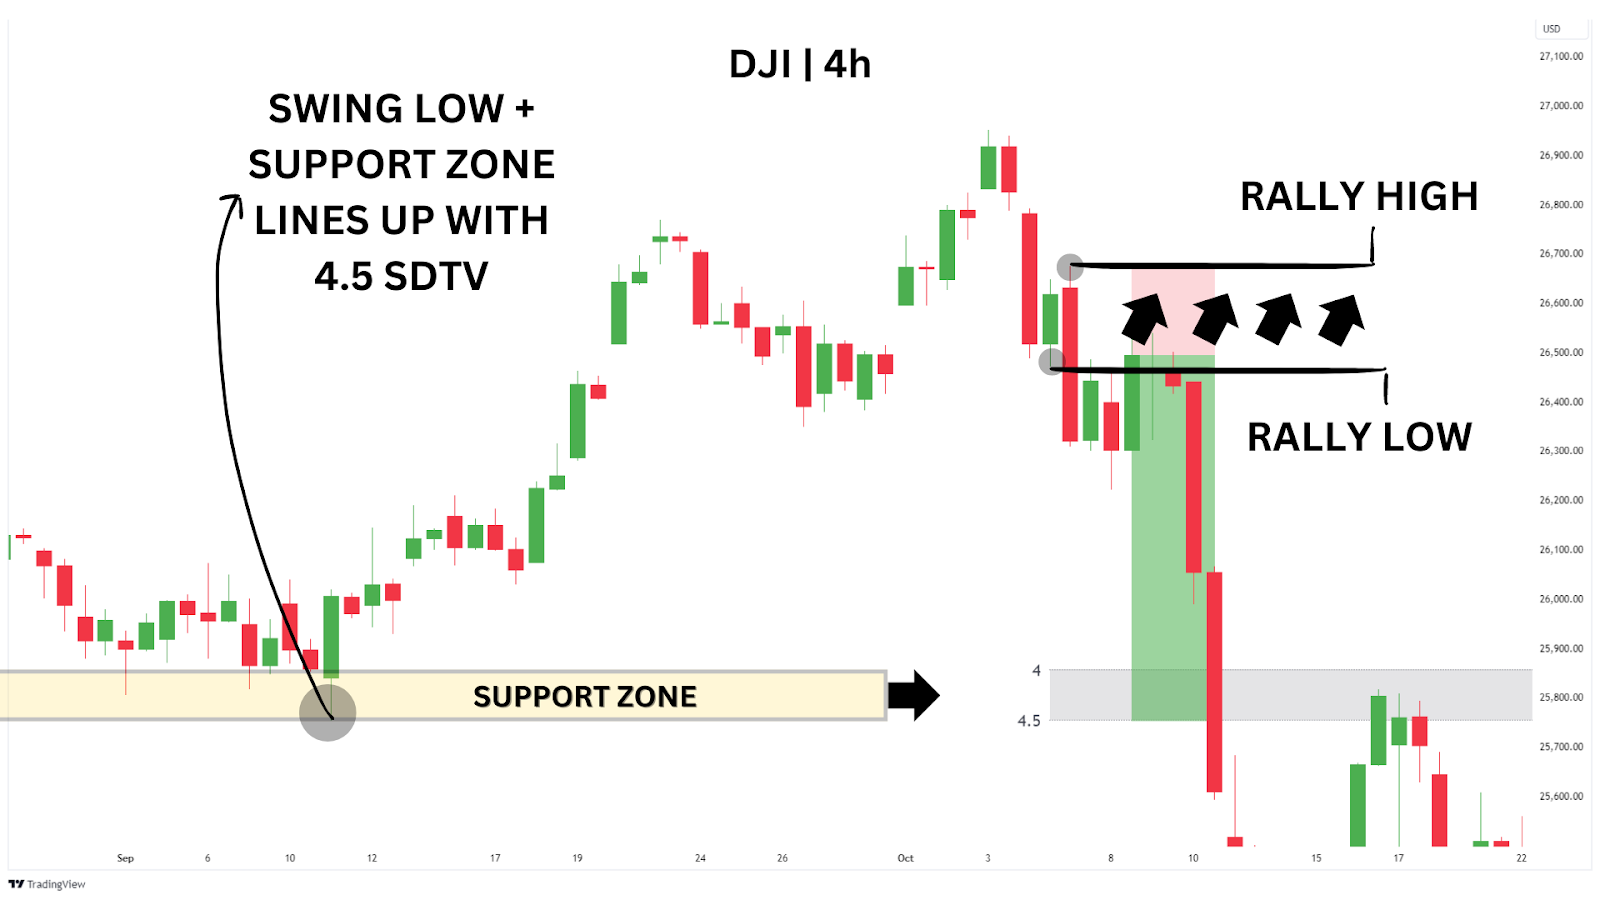
In this example on the Dow Jones Index (DJI) 4-hour chart, the 4.5 standard deviation level aligns perfectly with the previous swing low, providing additional confluence. Knowing now that our Fibonacci projection offers a precise take-profit target that aligns with market structure, we can now look for entries.
Similarly to method two, we will set limit orders at the midpoint of the bearish engulfing candle to improve our risk-to-reward.
Place your stop-loss just above the high of the bearish engulfing candle and your take profits at the 4.5 STDV level.
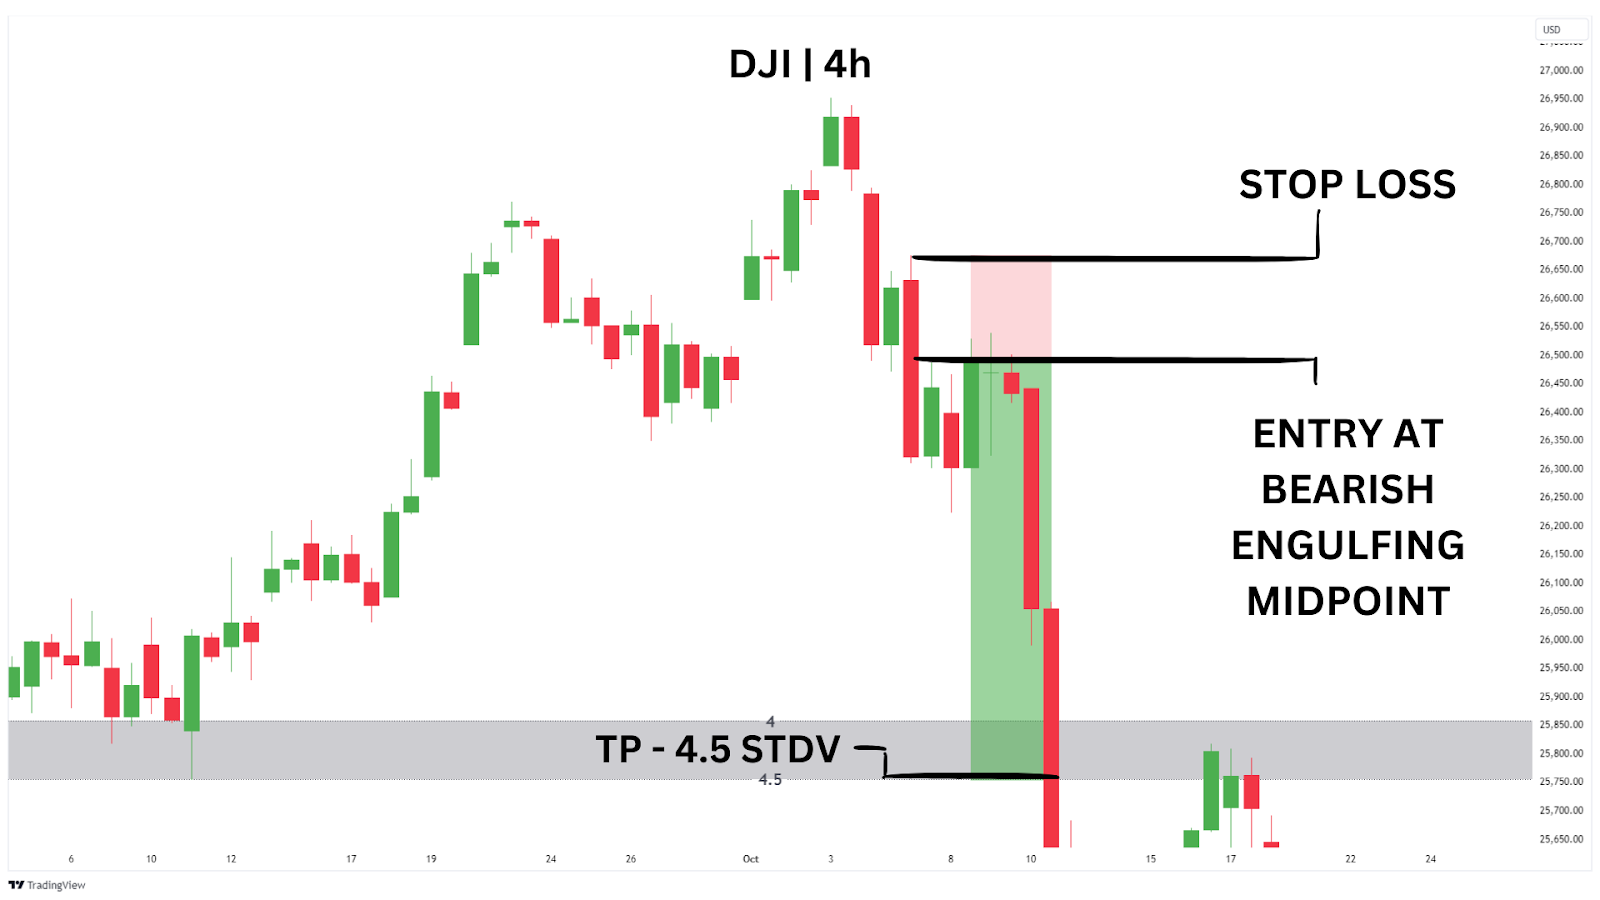
As in method two, this strategy yields a 4.1RR in only a few hours.
This strategy allows you to capture more significant moves by targeting precise extensions of the price move, making it highly effective in trending markets. When the ‘bounces’ are larger, the 4.5 STDV will be plotted further away on the chart, and can provide large risk-to-reward opportunities!
Trading Strategy Summary
Entry Point: Enter a short position at the midpoint of the bearish engulfing candle after confirming the Fibonacci projection.
Stop-Loss: Place your stop-loss just above the high of the bearish engulfing candle.
Profit Target: Target the 4.5 standard deviation level projected by the Fibonacci retracement tool for precise take-profit levels.
| Pros: Provides precise take-profit targets using Fibonacci projections, ideal for capturing larger moves in trending markets. Works effectively with bearish engulfing patterns to offer structured trade setups. |
| Cons: Requires familiarity with Fibonacci tools, which can add complexity. Less effective in choppy or highly volatile markets where price movements are unpredictable. |
Closing Thoughts on the Bearish Engulfing Pattern
The bearish engulfing pattern is a powerful reversal signal, especially when used in trending markets. It’s a versatile tool that can enhance your trading strategy by highlighting key turning points where sellers take control.
Advantages of Trading the Bearish Engulfing Pattern
- High Probability Setup: Bearish engulfing patterns often indicate strong reversals, making them a preferred signal for traders in downtrending markets.
- Easy to Identify: This pattern is straightforward to spot and widely recognised, making it accessible to both novice and experienced traders.
- Effective in Trending Markets: Bearish engulfing patterns are reliable across various timeframes and work well in trending market conditions.
Disadvantages of Trading the Bearish Engulfing Pattern:
- False Signals in Ranging Markets: Bearish engulfing patterns can produce false signals in choppy or sideways markets, leading to potential losses.
- Requires Confluence: This pattern typically needs to be combined with other technical tools or indicators to improve its accuracy and avoid false signals.
FAQ Section
When does a bearish engulfing pattern occur?
A bearish engulfing pattern occurs when a small bullish candle is followed by a larger bearish candle that completely engulfs the previous one. Picture one candle completely, overshadowing the other. This bearish reversal pattern often signals a potential shift from bullish to bearish momentum, particularly after an uptrend or at a key resistance level.
How does the bearish engulfing pattern compare to the bullish engulfing pattern?
While both are engulfing candlestick patterns, their signals are quite different. A bullish engulfing candlestick pattern is a bullish reversal pattern that occurs when a smaller bearish candle is overtaken by a larger bullish candle. This typically signals a potential reversal in an existing downtrend, suggesting upward momentum may be on the horizon.
What makes trading bearish engulfing patterns effective?
Trading bearish engulfing patterns can be highly effective when combined with other technical tools like Fibonacci retracement, Bollinger Bands®, or key resistance zones. These bearish engulfing candlestick patterns are particularly reliable in trending markets and help identify potential reversal points for short entries.
Can the bearish engulfing pattern and the bullish engulfing pattern be used together?
Yes, the bearish engulfing pattern and bullish engulfing pattern can complement each other. The bullish engulfing pattern occurs in downtrends, signalling a reversal to the upside, while the bearish engulfing pattern is a bearish reversal pattern that signals a potential downturn after an uptrend. Using both can enhance a well-rounded trading strategy across different market conditions.
Ultimately, the broader market structure will guide traders on which pattern to prioritise, helping them identify which setups are more likely to result in larger swings.