Moving Average Strategies: A Guide for Traders
Unlock moving average strategies. This guide covers SMA, EMA, WMA, and popular methods like Golden Cross and MA Ribbons. Understand trend identification, implementation, benefits, and drawbacks for smarter trading decisions.

“Moving averages help traders identify trends in a simple yet powerful way. They allow you to stay on the right side of momentum while filtering out short-term price noise.”
— John Murphy, Technical Analysis Expert and Author of ‘Technical Analysis of the Financial Markets’
Navigating the complexities of financial markets requires a structured and strategic approach. Moving average strategies are among the most widely utilised technical analysis tools, offering traders a method to identify trends, smooth out price fluctuations, and optimise entry and exit points.
This guide explores different types of moving averages, popular trading strategies, their advantages and limitations, and practical implementation techniques. Additionally, we’ll examine how traders can integrate these strategies into their approach using FXIFY’s advanced tools and resources.
What is a Moving Average Trading Strategy?
A moving average (MA) trading strategy is a widely used technical analysis approach that helps traders identify market trends by averaging price data over a specific period. This technique smooths out short-term price fluctuations, providing a clearer view of the underlying trend direction.
By analysing moving averages, traders can determine key support and resistance levels, generate entry and exit signals, and make informed trading decisions.
Historical Perspective
Moving averages have played a pivotal role in trading since the era of bustling stock exchange floors, where proprietary traders relied on them to gauge market momentum amidst the chaos of open-outcry trading. As financial markets transitioned to electronic platforms, the use of moving averages expanded, becoming a fundamental component of algorithmic trading and quantitative strategies.
Today, moving averages are integral to institutional investors, hedge funds, and retail traders alike, helping them navigate the complexities of modern markets with real-time data analysis, automated trade execution, and AI-driven trading systems.
Their continued relevance highlights their effectiveness in filtering market noise and assisting traders in making data-driven decisions.
Types of Moving Averages
Different types of moving averages serve distinct purposes, depending on market conditions and trading objectives. Below are the most commonly used variations:
Simple Moving Average (SMA)
The Simple Moving Average (SMA) is a widely used technical indicator that helps traders identify trends by averaging price data over a set period.
| MA Type | Calculation Method | Common Settings | Best Use Case | Key Drawback |
| Simple Moving Average (SMA) | Calculates the arithmetic mean of an asset’s price over a specific period | 10, 50, 100, and 200 periods | Long-term trend identification | Lags in fast-moving markets |
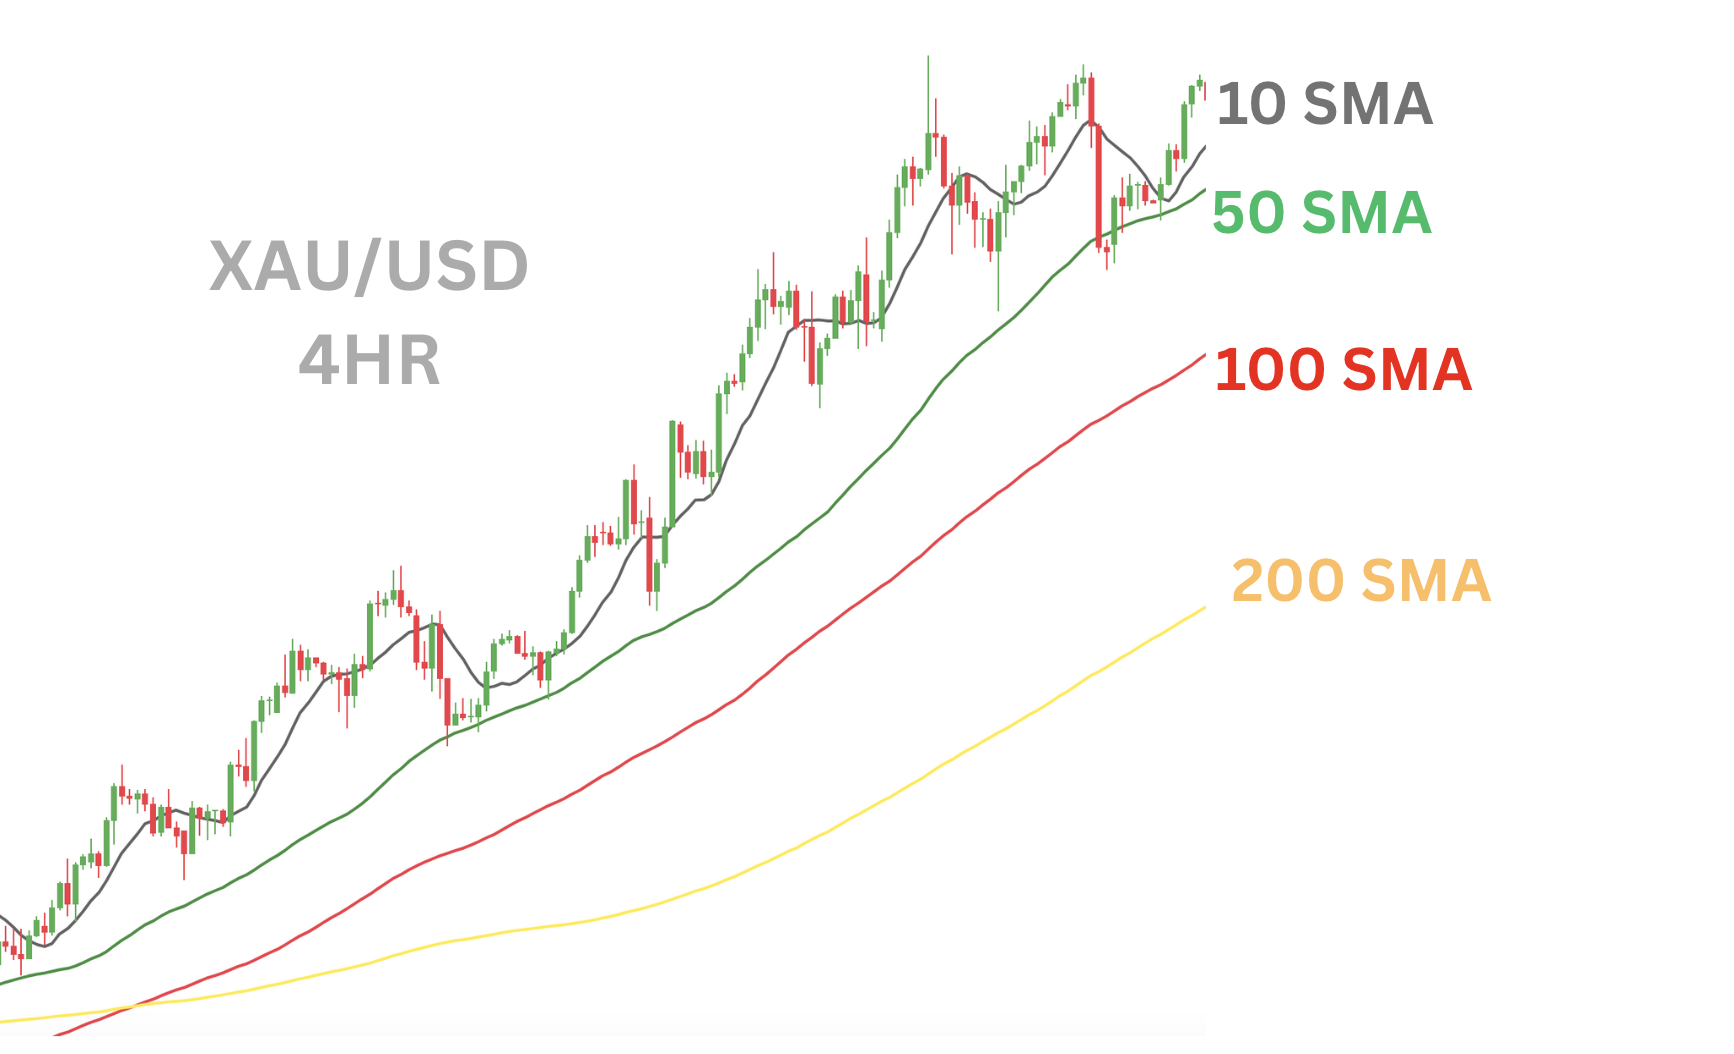
This chart demonstrates how commonly used SMA settings interact with price movements in a 4-hour XAU/USD (Gold) trading setup.
Exponential Moving Average (EMA)
The Exponential Moving Average (EMA) is a dynamic trend-following indicator that reacts more quickly to price changes than a Simple Moving Average (SMA).
| MA Type | Calculation Method | Common Settings | Best Use Case | Key Advantage | Key Drawback |
| Exponential Moving Average (EMA) | Assigns greater weight to recent price movements, making it more responsive to changes. | 5, 20, and 50 periods | Ideal for short-term traders seeking quick trend signals. | Provides faster signals for entries and exits. | More sensitive to price fluctuations, leading to potential false signals. |

This chart illustrates how different EMA settings interact with price movements in a 15-minute XAU/USD (GOLD) trading setup.
Weighted Moving Average (WMA)
The Weighted Moving Average (WMA) gives more weight to recent prices, making it more responsive to market movements than the Simple Moving Average (SMA). This allows traders to identify trend shifts faster, making WMA ideal for fast-moving markets where quick reactions are essential.
However, its higher sensitivity can lead to false signals in choppy conditions, so it’s often used alongside other indicators for confirmation.
| MA Type | Calculation Method | Common Settings | Best Use Case | Key Advantage | Key Drawback |
| Weighted Moving Average (WMA) | Assigns progressively higher weight to recent prices, ensuring a balance between smoothness and responsiveness. | 10, 20, and 50 periods | Ideal for fast-moving markets where traders need quick reactions. | More responsive than SMA, reducing lag in trend identification. | Can be overly sensitive to short-term price fluctuations, leading to false signals. |
Comparing the 10 WMA and 10 SMA in Action
The chart below illustrates the difference between the 10-period Weighted Moving Average (WMA) and the 10-period Simple Moving Average (SMA) on a 15-minute XAU/USD (GOLD) trading setup.

This comparison highlights how the WMA reacts faster to price changes than the SMA, making it a preferred choice for traders in fast-moving markets.
Short-Term vs. Long-Term Moving Averages
Moving averages can be categorised into short-term and long-term, each serving a different purpose in trading.
| Type | Period Range | Best For | Key Advantages | Key Drawback |
| Short-Term MAs | 5-20 periods | Scalping & day trading | Reacts quickly to price changes, ideal for momentum shifts | Prone to false signals in choppy markets |
| Long-Term MAs | 50-200 periods | Swing & position trading | Smooths out noise, better for trend confirmation | Slower reaction time, may lag in fast-moving markets |
How to Use Them Together
| Crossover signals | Short-term MAs crossing above long-term MAs indicate bullish trends; crossing below signals bearish trends. |
| Trend confirmation | Long-term MAs help confirm whether short-term movements align with the broader market direction. |
Popular Moving Average Trading Strategies
There are several well-established trading strategies that incorporate moving averages to enhance trade precision and risk management.
1. Golden Cross & Death Cross
The Golden Cross and Death Cross are two of the most widely recognised moving average crossover signals used by traders and investors to identify major market trends.
These signals occur when the 50-day Simple Moving Average (SMA) crosses the 200-day SMA, helping traders determine potential bullish or bearish market conditions.
| Crossover Type | Moving Averages Used | Signal Type | Market Implication | Typical Outcome |
| Golden Cross | 50-day SMA crosses above 200-day SMA | Bullish | Indicates a potential uptrend and buying momentum | Often followed by higher prices in the long term |
| Death Cross | 50-day SMA crosses below 200-day SMA | Bearish | Signals a potential downtrend and selling pressure | Can lead to further declines and bearish sentiment |
This chart illustrates the Golden Cross and Death Cross on the S&P 500 Daily time frame.

The 50-day SMA (blue) crossing above the 200-day SMA (red) signals a bullish trend (Golden Cross), while the 50-day SMA crossing below the 200-day SMA indicates a bearish reversal (Death Cross).
2. Multiple Moving Average Crossover
The Multiple Moving Average Crossover Strategy helps traders identify trend shifts by using three exponential moving averages (EMAs): the 5 EMA, 20 EMA, and 50 EMA.
This strategy generates buy and sell signals based on the position of the moving averages, ensuring trades align with the broader trend direction.
| Signal Type | Condition | Market Implication |
| Buy Signal (Entry) | 5 EMA crosses above 20 EMA, while both remain above the 50 EMA | Indicates strong bullish momentum and a potential buy opportunity within an uptrend |
| Sell Signal | 5 EMA crosses below 20 EMA, while both remain above the 50 EMA | Suggests short-term weakness or a pullback, making it a potential profit-taking opportunity rather than a full trend reversal |
| Trend Reversal Signal | 5 EMA and 20 EMA cross below the 50 EMA | Confirms a bearish trend shift, signaling a possible downtrend continuation rather than a temporary retracement |
This EUR/USD 1HR chart presents a structured trend-following strategy using the 5 EMA, 20 EMA, and 50 EMA crossover signals.

Buy Signal:
A bullish entry is confirmed when the 5 EMA crosses above the 20 EMA, while both moving averages are positioned above the 50 EMA. This setup indicates strong upward momentum within an established uptrend.
Sell Signal (Exit or Short Opportunity):
A sell signal occurs when the 5 EMA crosses below the 20 EMA, but both remain above the 50 EMA. This suggests short-term weakness or a pullback within the larger uptrend, making it a potential profit-taking opportunity rather than a full trend reversal.
Technical Note:
If the 5 EMA and 20 EMA cross below the 50 EMA, it signals a potential trend reversal, suggesting a stronger bearish shift rather than a temporary pullback.
This multiple EMA crossover method helps traders stay aligned with the primary trend while capitalising on momentum shifts within the trend
3. Moving Average Ribbon
The Moving Average Ribbon is a trend-following technique that uses a series of 8-15 EMAs plotted simultaneously on a chart. This method provides a layered visualisation of trend strength and helps traders identify potential reversals.
Widening Ribbon → Indicates strong momentum and a continuation of the trend.
Narrowing Ribbon → Suggests weakening momentum and a possible trend reversal.
| Signal Type | Condition | Market Implication |
| Strong Trend (Momentum Confirmation) | Ribbon is widely spread apart and sloping in the same direction | Confirms strong bullish or bearish momentum and trend continuation |
| Trend Weakening (Reversal Potential) | Ribbon begins to compress and contract | Suggests momentum loss and an early warning of a possible reversal |
| Trend Reversal | EMAs start crossing over each other and flipping direction | Indicates a potential shift in trend, signaling a reversal |
Moving Average Ribbon Strategy (USD/JPY 4HR Chart)
The Moving Average Ribbon on this USD/JPY 4HR chart is composed of Exponential Moving Averages (EMAs) at 5-period intervals, ranging from 5 to 65. This setup provides a layered visualisation of trend strength and potential reversals.

Uptrend Phase
- The green ribbon expansion shows a strong bullish trend with clear separation between EMAs.
- Price remains above most moving averages, confirming buy-side momentum.
Downtrend Phase
- The ribbon tightens and flips red, signaling bearish momentum gaining strength.
- Price action is below the ribbon, confirming downward pressure and trend shift.
How to Trade This Strategy
- Trade in the direction of the ribbon-enter long positions in a widening uptrend and short positions in a widening downtrend.
- Use additional confirmations-combine the ribbon with RSI or MACD to validate momentum shifts.
- Monitor contractions for potential reversals-if the ribbon tightens significantly, prepare for a possible trend change.
4. Moving Average Envelope
The Moving Average Envelope strategy applies percentage-based bands around a central moving average, creating an upper and lower boundary. These bands help traders identify overbought and oversold conditions, making it a useful tool for trend trading and mean reversion strategies.
| Signal Type | Condition | Market Implication |
| Buy Opportunity | Price approaches or touches the lower band | Suggests oversold conditions, potential bounce or trend continuation |
| Sell Opportunity | Price approaches or touches the upper band | Indicates overbought conditions, possible pullback or reversal |
| Breakout Confirmation | Price breaks out above or below the bands with strong momentum | Suggests a trend acceleration beyond normal price fluctuations |
This chart displays the Moving Average Envelope, which consists of a central moving average (blue line) and upper/lower envelope bands (red lines) based on a percentage deviation from the moving average. This strategy helps traders identify overbought and oversold conditions in trending or ranging markets.

Key Observations from the Chart
Downtrend Phase:
- The price consistently trends near the lower envelope band, indicating strong bearish momentum.
- The moving average (blue line) acts as dynamic resistance, preventing price from moving higher.
- Traders using this setup could look for short-selling opportunities near the upper band during downtrend retracements.
Range-Bound Movements:
- In sideways markets, price oscillates between the upper and lower bands, showing mean-reversion behavior.
- Price bounces off the lower band, offering potential buy opportunities, while resistance at the upper band provides sell signals.
Trend Shift & Uptrend Formation:
- In the later part of the chart, the price moves from a downtrend to a more structured range, eventually breaking higher.
- The price rides the moving average, with higher lows forming, indicating a potential bullish reversal.
How to Optimise This Strategy
- Trade in the direction of the moving average – avoid counter-trend trades unless a clear reversal signal forms.
- Use additional confirmation indicators such as RSI (for overbought/oversold levels) or MACD (for trend confirmation).
- Adjust the envelope percentage deviation based on market volatility:
Low volatility markets → Use 1%-2% deviation.
High volatility markets → Use 2%-5% deviation.
- Breakouts beyond the envelope bands should be confirmed with volume increases for stronger trade conviction.
This Moving Average Envelope strategy works best in range-bound conditions for mean reversion trading, but can also be used in trending markets as dynamic support and resistance levels.
If price continues hugging one side of the envelope, it indicates a strong trend continuation rather than a reversal.
Benefits of Moving Average Strategies
The widespread adoption of moving averages in trading is due to their numerous advantages:
| ✔ | Trend Identification | Clearly defines market direction. |
| ✔ | Applicability Across Multiple Markets | Effective in forex, stocks, commodities, and cryptocurrencies. |
| ✔ | Simplicity and Accessibility | Suitable for traders of all experience levels. |
| ✔ | Integration with Algorithmic Trading | Widely used in automated and AI-driven trading strategies. |
| ✔ | Reliable Entry and Exit Signals | Enhances decision-making in volatile markets. |
Drawbacks of Moving Average Strategies
Despite their effectiveness, moving averages also have certain limitations:
| ❌ | Lagging Indicator | Moving averages are reactive rather than predictive. |
| ❌ | False Signals | Crossovers in choppy markets may lead to frequent stop-outs. |
| ❌ | Limited Performance in Range-Bound Markets | Moving averages are more effective in trending markets than sideways movements. |
How to Implement a Moving Average Strategy
Successfully implementing a Moving Average (MA) strategy requires selecting the right time frame, moving averages, and strategy, while ensuring proper risk management. This structured approach ensures that your trading aligns with market conditions and your trading style.
Step 1: Select the Right Time Frame & Moving Average
Your trading time frame determines which moving averages are most effective. The table below provides optimal settings based on trading styles:
| Trading Style | Recommended Time Frame | Optimal Moving Averages | Application |
| Scalping | 1-5 minute charts. | 5, 10, and 20-period EMAs | Captures short-term momentum shifts |
| Day Trading | 15-minute to 1-hour charts | 10, 20, and 50-period EMAs | Identifies intraday trend direction |
| Swing Trading | 1-hour to 4-hour charts | 20, 50, and 100-period SMAs | Tracks medium-term trends |
| Position Trading | Daily (1D) to Weekly (1W) | 50, 100, and 200-period SMAs | Confirms long-term market structure |
Key Insight:
- Scalpers rely on fast-moving EMAs to react quickly.
- Swing traders use longer SMAs to smooth out price fluctuations.
- Long-term traders track institutional SMAs (50, 100, 200) to follow macro trends.
Step 2: Applying the Right Moving Average Strategy
Different strategies work better in different market conditions. Below is a quick reference guide:
| Strategy | Moving Averages Used | Best Market Condition |
| Golden Cross & Death Cross | 50 & 200 SMAs | Long-term trend reversals |
| Multiple Moving Average Crossover | 5, 20, 50 EMAs | Short-term trend shifts |
| Moving Average Ribbon | 8-15 EMAs (5-65 period) | Capturing trend strength |
| Moving Average Envelope | 20 or 50 SMA with bands (1-3% deviation) | Mean reversion in range-bound markets |
Example:
- A day trader on a 15-minute EUR/USD chart may use the 5-20-50 EMA crossover strategy to confirm short-term momentum.
- A position trader in stocks may watch for a Golden Cross on the daily chart before entering a long-term buy.
Step 3: Combine Moving Averages with Other Indicators
To improve accuracy, moving averages should be combined with confirmation indicators that validate trend direction and strength.
| Indicator | Purpose | How it Enhances Moving Averages |
| Relative Strength Index (RSI) | Measures momentum | Confirms if MA crossovers align with trend strength |
| MACD (Moving Average Convergence Divergence) | Identifies trend strength | Validates bullish/bearish crossovers |
| Bollinger Bands | Measures price volatility | Helps identify support/resistance near MA Envelope bands |
Example:
- A trader using the Moving Average Ribbon can check RSI-if RSI is above 50, it confirms the bullish trend.
Step 4: Implement Risk Management
Even with the best strategy, risk management is key to long-term success.
| Risk Management Tool | Purpose | How to Apply It |
| Stop-Loss Orders | Protects against excessive losses | Place below swing low (long trades) and above swing high (short trades) |
| Risk-Reward Ratio | Ensures potential profits exceed risks | Use a 1:2 or 1:3 ratio to maximise returns. |
| Position Sizing | Adjusts trade size based on risk | Risk only 0.5-1% of account per trade. |
| Trailing Stop | Locks in profits as price moves favorably | Adjusts stop-loss dynamically to secure gains |
Example:
- A trend trader using the Golden Cross strategy may place a stop-loss below the 200 SMA to stay within the overall trend.
The Bottom Line
Moving averages are a cornerstone of technical analysis, offering traders a structured way to identify trends, filter market noise, and optimise trade execution. While they have inherent limitations, their effectiveness is significantly enhanced when combined with confirmation indicators and disciplined risk management.
For traders looking to refine their strategy, FXIFY™ provides the tools, education, and market insights needed to trade with confidence.