


The Rhythm of Market Cycles: What History Teaches Us
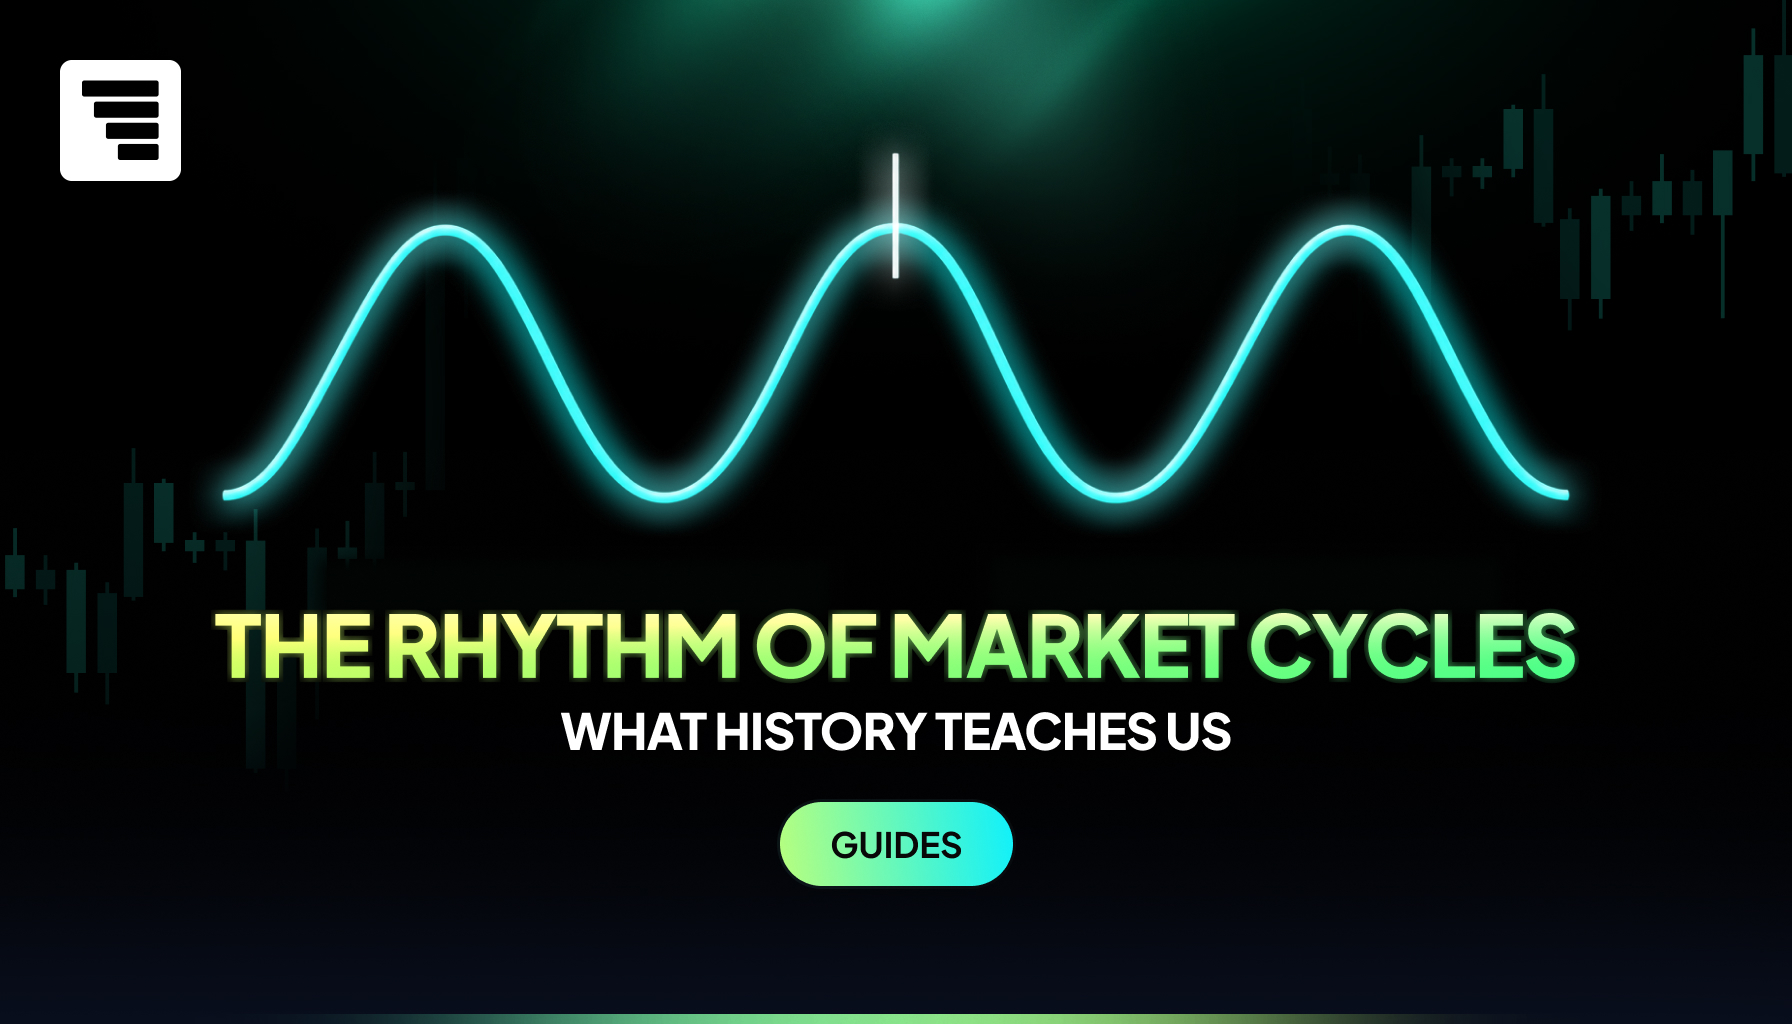
Markets move through recognizable phases, and decades of price records make that clear. Expansion, peak, contraction, trough, then expansion again. What follows is market cycles…
Markets move through recognizable phases, and decades of price records make that clear.
Expansion, peak, contraction, trough, then expansion again. What follows is market cycles explained in plain terms. What each phase looks like, what three past cycles did, and why knowing the shape helps you think about risk.
It is not useful for predicting what comes next, and this article does not try. No one can time a cycle, and the historical record is the strongest evidence for that.
Key Terms
| Term | What it means |
| Market cycle | The movement of a market through expansion, peak, contraction, and trough, and back again. Cycles vary in length from weeks to years |
| Peak to trough | The distance from a market’s high point to its low point in a single contraction. It is how cycle declines are measured and compared |
| Market drawdown | A fall in price from a previous high. This is a market condition, not an account rule |
| Account drawdown limit | A rule set by your program that breaches the account when losses cross a set threshold. Market conditions do not change this number |
| Daily range | The distance between a day’s high and low on an instrument. Ranges have historically widened during contractions |
Market Cycles Explained: The Four Phases
A market cycle moves from one phase to the next and back again. Four phases are commonly described.
- Expansion. Prices rise over an extended period. Daily ranges are often narrower. Pullbacks tend to be shallow and short-lived.
- Peak. Price growth slows and then reverses. Volatility often rises before the direction changes, not after. A peak is only identified clearly once it has passed.
- Contraction. Prices fall away from the peak. Declines have historically been faster than the rise that came before them. Daily ranges are usually at their widest in this phase.
- Trough. Selling slows, and prices stop falling. Like peaks, troughs are only visible in hindsight. (Some traders might call it a bottom or support level.)
The phases do not run to a fixed length. One cycle can stretch across a decade. Another can compress into weeks.
What History Shows Us
Three well-documented cycles show how different the same four phases can look.
- The dot-com cycle. The S&P 500 peaked in March 2000 after years of expansion. It reached its trough in October 2002, down roughly 49% from that peak. The Nasdaq Composite fell further, losing close to 78% from peak to trough. The S&P 500 did not close back above its March 2000 high until May 2007.
- The global financial crisis. The S&P 500 peaked at 1,565.15 on October 9, 2007. It reached its trough at 676.53 on March 9, 2009, a decline of about 57%. That contraction ran roughly 17 months. The index did not return to its 2007 high until March 2013.
- The 2020 shock. The S&P 500 closed at a peak of 3,386.15 on February 19, 2020. It fell about 34% by March 23, 2020, over 23 trading days. That was the fastest decline of its size on record.
The same four phases appear in all three. A contraction that took 17 months in one cycle took under a month in another. Cycles also show up in currencies, metals, and energy, where the drivers differ, and the shape still recurs.
| Cycle | Peak to trough | Approximate decline | Time to regain the peak |
|---|---|---|---|
| Dot-com | March 2000 to October 2002 | About 49% on the S&P 500 | About 7 years |
| Global financial crisis | October 2007 to March 2009 | About 57% on the S&P 500 | About 4 years |
| 2020 shock | February 2020 to March 2020 | About 34% on the S&P 500 | Months, not years |
Sources: S&P Dow Jones Indices peak-to-trough drawdown data, and S&P 500 daily closing series.
Why No One Can Time a Cycle
Phases are named after the fact. A peak is confirmed by the decline that follows it. A trough is confirmed by the recovery. While you are inside a phase, you are looking at price action that has not finished yet.
The cycles above make this concrete. Nothing in the price record marked October 9, 2007, as the top while it was happening. That date was assigned later, once the decline had run.
Historical patterns are not a forecast. Past cycles varied in depth, speed, and cause. A similar shape does not produce a similar outcome, and past performance does not indicate future results.
This is why cycle awareness belongs in how you think about risk, not what you expect to happen.
What Cycle Awareness Means for Risk Management
Volatility is not constant across a cycle. Contractions have historically carried wider daily ranges than expansions. That has practical consequences for anyone trading to a fixed risk limit.
A stop placed at a distance suited to a quiet market gets hit more often when ranges widen. The same position size produces a larger swing in dollars. A day that would have been ordinary in one phase can reach a daily loss limit in another.
None of this tells you what the market will do next. It tells you that the same trade carries different exposure depending on the conditions around it.
There is a second point worth separating if you trade a funded account. A market drawdown and an account drawdown limit are different things. A market drawdown is a fall in price from a previous high. An account drawdown limit is a rule that triggers when you breach it. Wider market ranges do not change your limit. They change how quickly you can reach it.
Useful responses focus on measurement rather than prediction. Compare the current daily range on your instrument against the range you usually trade. Size to the conditions in front of you, not the conditions you are used to. Work out your daily loss limit as a dollar figure before the trading day starts.
Trade the Conditions in Front of You
Markets have moved through expansion, peak, contraction, and trough for as long as there have been price records. Recognizing which conditions you are trading in is useful. The historical record doesn’t support predicting the next turn. Measure what is in front of you and size to it. The habits funded traders build before they trade cover how to set that number before the day starts.