



Page background
NEW TRADERS: 30% OFF 2 PHASE PRO
NEW30
SUMMER SALE: 20% OFF (excl. Instant Lite)
HOT20

SAVE WITH OUR EXCLUSIVE PROMOS

NEW TRADERS: 30% OFF 2 PHASE PRO
Expires: 31st December 2026
NEW30
SUMMER SALE: 20% OFF (excl. Instant Lite)
Expires: 1st September 2026
HOT20
NEW TRADERS: 30% OFF 2 PHASE PRO
Expires: 31st December 2026
NEW30
SUMMER SALE: 20% OFF (excl. Instant Lite)
Expires: 1st September 2026
HOT20
NEW TRADERS: 30% OFF 2 PHASE PRO
Expires: 31st December 2026
NEW30
SUMMER SALE: 20% OFF (excl. Instant Lite)
Expires: 1st September 2026
HOT20
NEW TRADERS: 30% OFF 2 PHASE PRO
Expires: 31st December 2026
NEW30
SUMMER SALE: 20% OFF (excl. Instant Lite)
Expires: 1st September 2026
HOT20
NEW TRADERS: 30% OFF 2 PHASE PRO
Expires: 31st December 2026
NEW30
SUMMER SALE: 20% OFF (excl. Instant Lite)
Expires: 1st September 2026
HOT20
NEW TRADERS: 30% OFF 2 PHASE PRO
Expires: 31st December 2026
NEW30
SUMMER SALE: 20% OFF (excl. Instant Lite)
Expires: 1st September 2026
HOT20
NEW TRADERS: 30% OFF 2 PHASE PRO
Expires: 31st December 2026
NEW30
SUMMER SALE: 20% OFF (excl. Instant Lite)
Expires: 1st September 2026
HOT20
NEW TRADERS: 30% OFF 2 PHASE PRO
Expires: 31st December 2026
NEW30
SUMMER SALE: 20% OFF (excl. Instant Lite)
Expires: 1st September 2026
HOT20
NEW TRADERS: 30% OFF 2 PHASE PRO
Expires: 31st December 2026
NEW30
SUMMER SALE: 20% OFF (excl. Instant Lite)
Expires: 1st September 2026
HOT20
NEW TRADERS: 30% OFF 2 PHASE PRO
Expires: 31st December 2026
NEW30
SUMMER SALE: 20% OFF (excl. Instant Lite)
Expires: 1st September 2026
HOT20
FAQs / All FAQs

All FAQs

Everything you need to know about our platform, evaluations and how to set up your FXIFY™ account.

Do you still need help?

Everything you need to know about our platform, evaluations and how to set up your FXIFY™ account.
FAQs
/
All FAQs
/
How Can I Search and Add Technical Indicators In TradingView?

How Can I Search and Add Technical Indicators In TradingView?

Adding technical indicators in TradingView is simple and can greatly enhance your trading analysis. Here’s how to do it:

       1.  Open Your Chart: Ensure you have your desired asset chart open in TradingView.

       2.  Click on “Indicators”: At the top of your chart, you’ll see an Indicators button. Click on it to open the indicator search box.
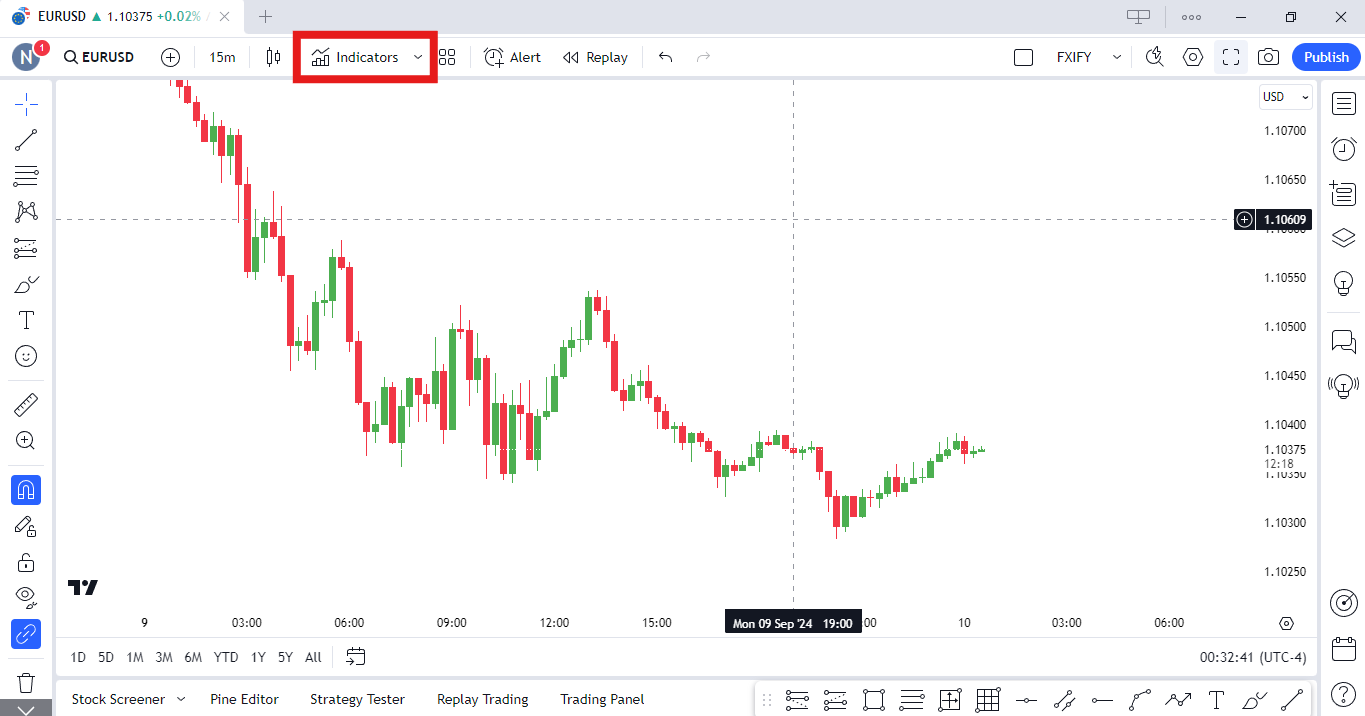
       3.  Search for Indicators: In the search bar that appears, type in the name of the indicator you’re looking for, such as RSI, MACD, or Moving Averages.

       4.  Add the Indicator to Your Chart: Once you find the indicator, click on it, and it will automatically be applied to your chart. You’ll see the indicator displayed either on the price chart or below it (e.g., in the case of oscillators like RSI).

       5.  Customise the Indicator: Right-click on the indicator or go to the Settings icon next to it on the chart to customise parameters, such as period length, colors, and styles.

Was this FAQ helpful?
YesNo

Do you still need help?

Everything you need to know about our platform, evaluations and how to set up your FXIFY™ account.
Make waves on the charts this summer — 20% off all programs. Use code HOT20.

JOIN US NOW!

GET EARLY ACCESS TO UPCOMING OFFERS

ENDS 1 SEP MIDNIGHT EST *Offer Excludes Instant Funding Lite
FXIFY Pulse | Market Insights — live on YouTube every Tuesday & Thursday, 10AM EST / GMT-4 Hosted by Jeremy Wagner, CEWA-M — Head of Research at Alchemy Markets, former Head of Technical Analysis at DailyFX NOTIFY ME