Page background
NEW CUSTOMERS: 30% OFF 2 PHASE PRO
NEW30
Summer Flash Sale: 30% OFF + 90% SPLIT
FLASH30

SAVE WITH OUR EXCLUSIVE PROMOS

NEW CUSTOMERS: 30% OFF 2 PHASE PRO
Expires: 31st December 2026
NEW30
Summer Flash Sale: 30% OFF + 90% SPLIT
Expires: 5th July 2026
FLASH30
NEW CUSTOMERS: 30% OFF 2 PHASE PRO
Expires: 31st December 2026
NEW30
Summer Flash Sale: 30% OFF + 90% SPLIT
Expires: 5th July 2026
FLASH30
NEW CUSTOMERS: 30% OFF 2 PHASE PRO
Expires: 31st December 2026
NEW30
Summer Flash Sale: 30% OFF + 90% SPLIT
Expires: 5th July 2026
FLASH30
NEW CUSTOMERS: 30% OFF 2 PHASE PRO
Expires: 31st December 2026
NEW30
Summer Flash Sale: 30% OFF + 90% SPLIT
Expires: 5th July 2026
FLASH30
NEW CUSTOMERS: 30% OFF 2 PHASE PRO
Expires: 31st December 2026
NEW30
Summer Flash Sale: 30% OFF + 90% SPLIT
Expires: 5th July 2026
FLASH30
NEW CUSTOMERS: 30% OFF 2 PHASE PRO
Expires: 31st December 2026
NEW30
Summer Flash Sale: 30% OFF + 90% SPLIT
Expires: 5th July 2026
FLASH30
NEW CUSTOMERS: 30% OFF 2 PHASE PRO
Expires: 31st December 2026
NEW30
Summer Flash Sale: 30% OFF + 90% SPLIT
Expires: 5th July 2026
FLASH30
NEW CUSTOMERS: 30% OFF 2 PHASE PRO
Expires: 31st December 2026
NEW30
Summer Flash Sale: 30% OFF + 90% SPLIT
Expires: 5th July 2026
FLASH30
NEW CUSTOMERS: 30% OFF 2 PHASE PRO
Expires: 31st December 2026
NEW30
Summer Flash Sale: 30% OFF + 90% SPLIT
Expires: 5th July 2026
FLASH30
NEW CUSTOMERS: 30% OFF 2 PHASE PRO
Expires: 31st December 2026
NEW30
Summer Flash Sale: 30% OFF + 90% SPLIT
Expires: 5th July 2026
FLASH30
FAQs / All FAQs

All FAQs

Everything you need to know about our platform, evaluations and how to set up your FXIFY™ account.

Do you still need help?

Everything you need to know about our platform, evaluations and how to set up your FXIFY™ account.
FAQs
/
All FAQs
/
How Do I Visualize A Company’s Financials On My TradingView Chart?

How Do I Visualize A Company’s Financials On My TradingView Chart?

TradingView lets you overlay a company’s key financial data directly on your chart. Here’s how to do it:

       1.  Select the stock you want to analyze.

       2.  Click on the “Financials” tab at the bottom panel (or find the “Metrics” icon in some views). If you are using a smaller screen, such as a laptop or mobile device, it may be under the “Indicators” tab.

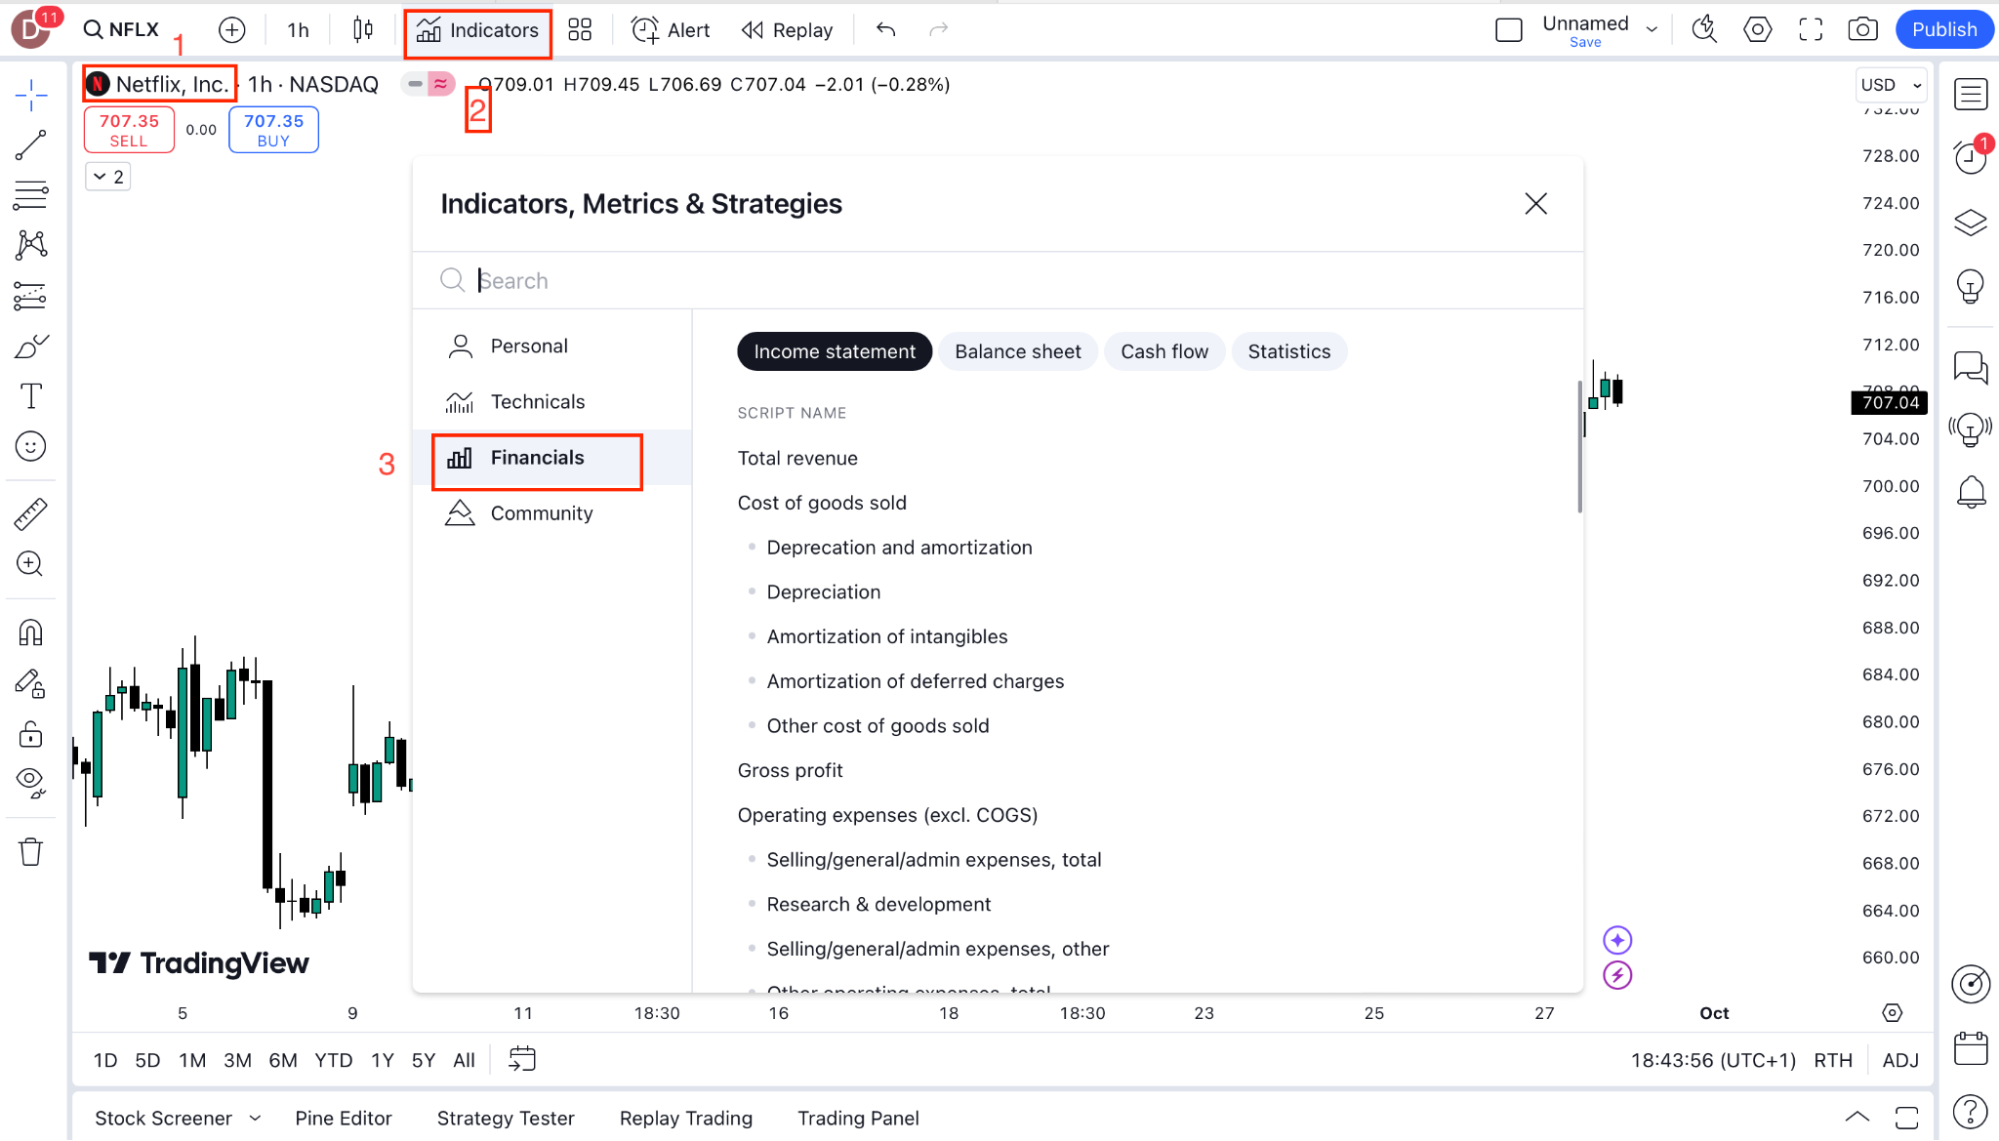
       3.   A panel will open with key data such as revenue, net income, and earnings per share (EPS). You can then add these metrics to your chart by clicking on them.

This feature helps you understand the company’s financial health alongside price movements.

Was this FAQ helpful?
YesNo

Do you still need help?

Everything you need to know about our platform, evaluations and how to set up your FXIFY™ account.
Summer Flash Sale — 30% off all programs + 1 free add-on. Use code FLASH30. 4 days only.

JOIN US NOW!

GET EARLY ACCESS TO UPCOMING OFFERS

LIMITED-TIME OFFER *Offer Excludes Instant Funding Lite