


Hammer Candlestick Strategies: A Complete Guide to Trading
Learn how to spot and trade the hammer candlestick pattern — a key bullish reversal signal in downtrending markets. This guide shows you how to use it in your strategy.
What is the Hammer Candlestick Pattern?
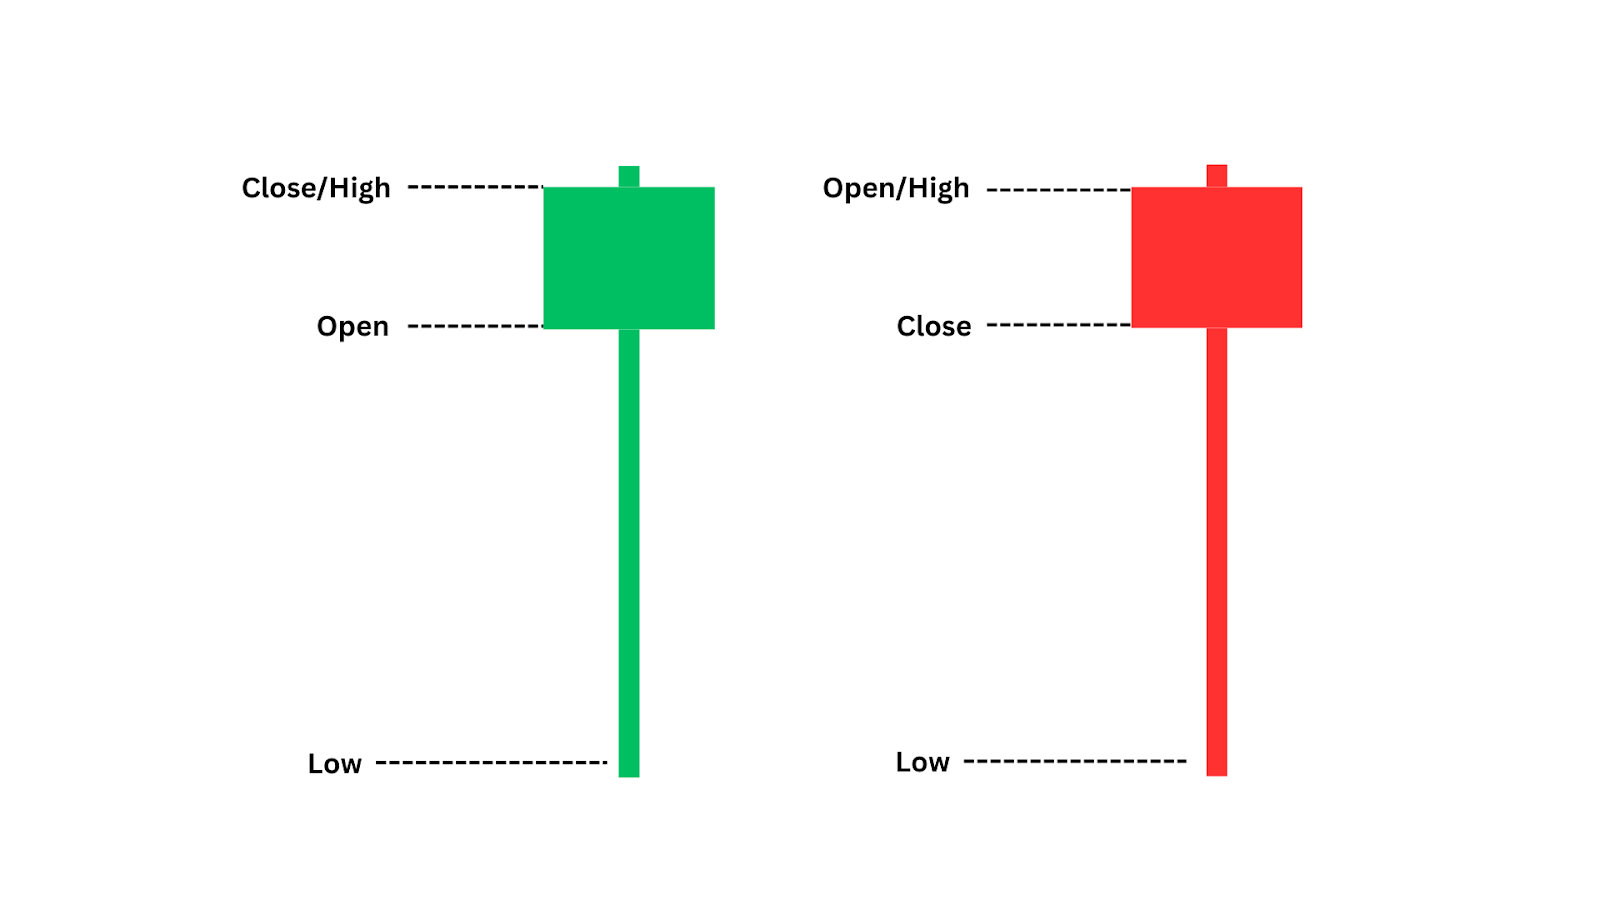
A hammer candlestick is a classic bullish reversal pattern that signals a potential bottom during a downtrend. It forms when the price dips significantly lower after opening but then rallies back around the opening price.
The resulting candle has a small body with a long lower shadow, resembling a hammer. This structure suggests that sellers tried to drive the price lower but were overpowered by buyers, hinting at a possible reversal of the downtrend.
The hammer candlestick can appear both green or red – meaning that the candles open/close are not as important as their large lower shadow.
How does the Hammer Candlestick work?
The hammer candlestick works as a potential reversal signal during a downtrend. The pattern happens when sellers drive the price down during the candlestick’s formation, but buyers come back in with strength, pushing the price back up towards the opening level.
This shift in momentum suggests that the market could be finding a bottom, with buyers stepping in to defend a key price level.
The long lower shadow of the hammer represents the sellers’ attempt to push the price lower, but the small body indicates that they were ultimately unsuccessful.
The presence of a hammer candle signals a possible reversal, and traders use it alongside other bullish indications to enter a long trade.
Let’s dive into how this pattern plays out on live trading charts.
Examples of the Hammer Candlestick Pattern
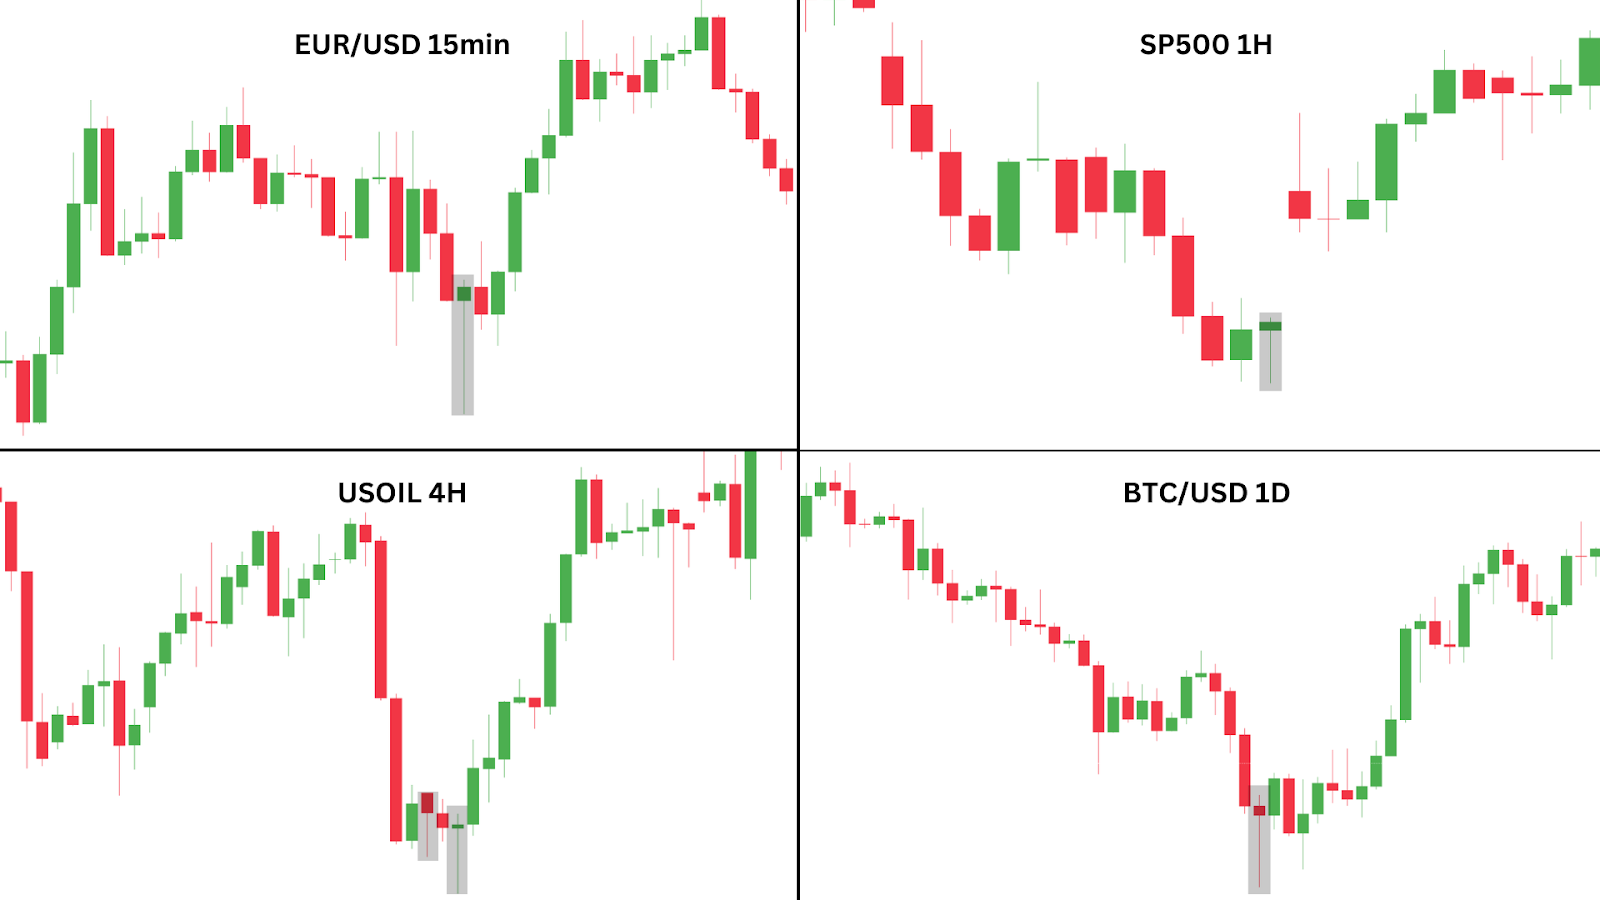
The hammer candlestick pattern is versatile and can appear on various assets and timeframes. Here are some things to keep in mind when looking out for this candlestick pattern.
- Market Structure: Hammers usually form towards the bottom of downtrends, signalling a potential reversal. They can also appear during uptrends after brief pullbacks, indicating trend continuation. For instance, in the EUR/USD 15-minute chart, a hammer forms during a bullish uptrend after a minor pullback, with a large lower wick showing strong buyer support.
- Timeframes: Hammers can be found on any timeframe, from 1-minute to daily candlesticks. The SP500 1-hour chart shows a hammer that’s smaller than our other examples, but is significant as the price gaps up immediately after, confirming the reversal.
- Validity: A hammer is most effective at key support levels or the bottom of a downtrend. For example, in the USOIL 4-hour chart, the second hammer is stronger due to its longer tail and a bullish follow-up candle, making it more reliable than the first, which was followed by a bearish candle.
- Key Characteristics:
- Wick Length: A longer lower wick indicates stronger reversal potential, as seen in our BTC/USD 1-day chart example, where a long wick forms a new swing low.
- Body and Colour: The body size and colour matter less than the shape. A small body with a long lower wick is crucial, with a bullish close adding strength to the reversal signal.
- Confirmation: The follow-up candle is essential for confirmation. A bullish candle following the hammer strengthens the reversal signal.
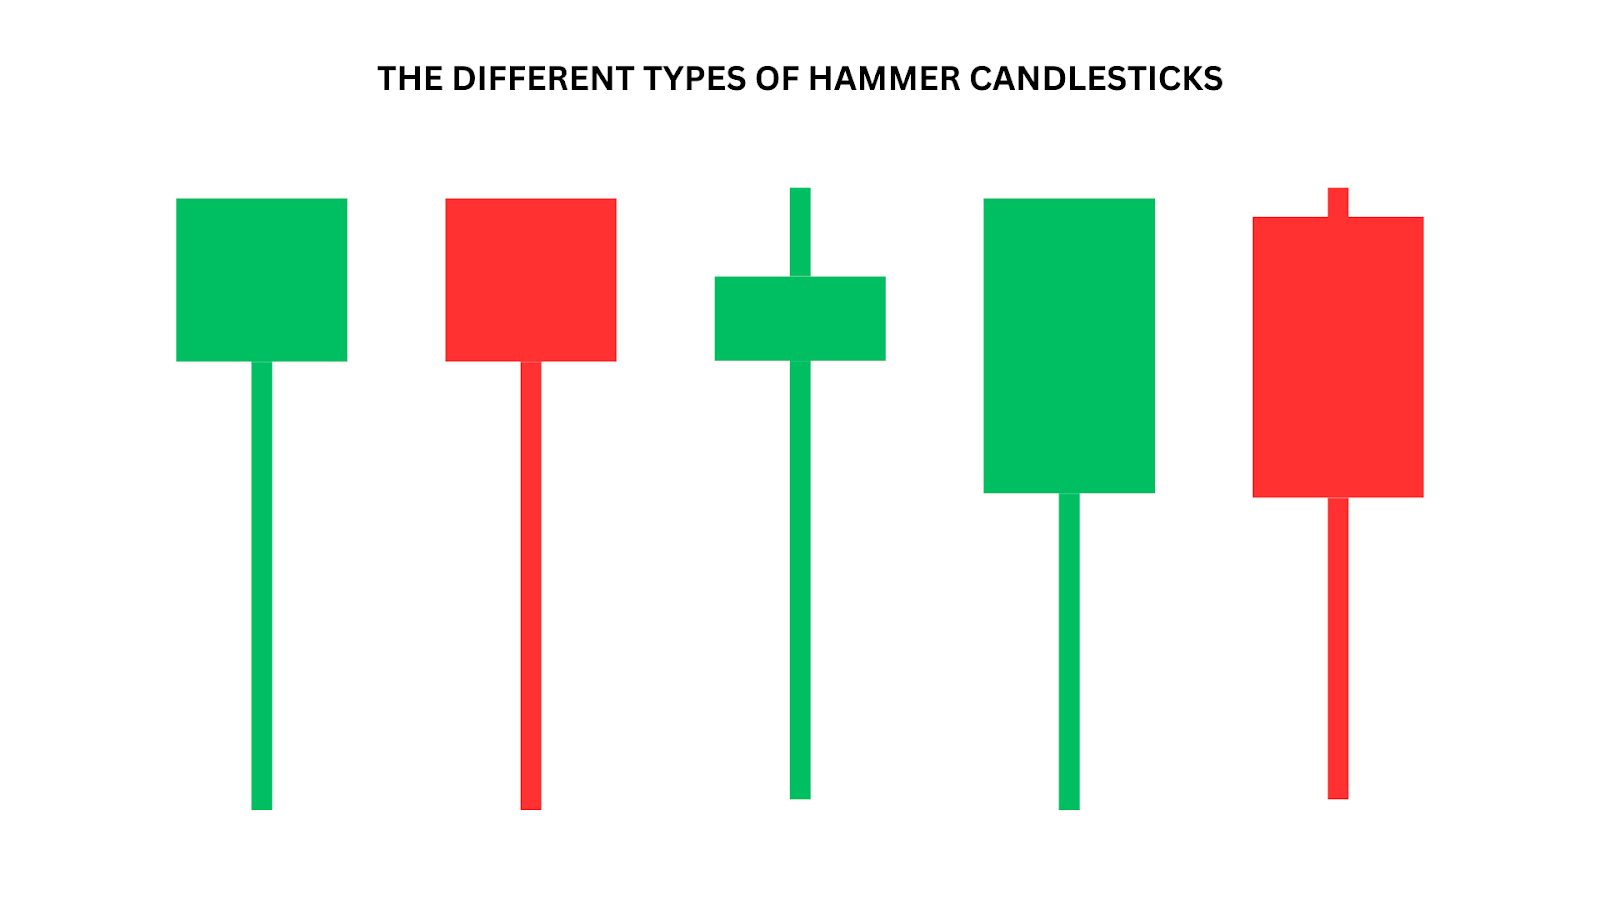
Keep in mind the hammer candlestick can come in various shapes and sizes, as illustrated below. The key identifying factor is its relatively small candle body, and long lower wick.
Case Study: SP500 Hammer Pattern
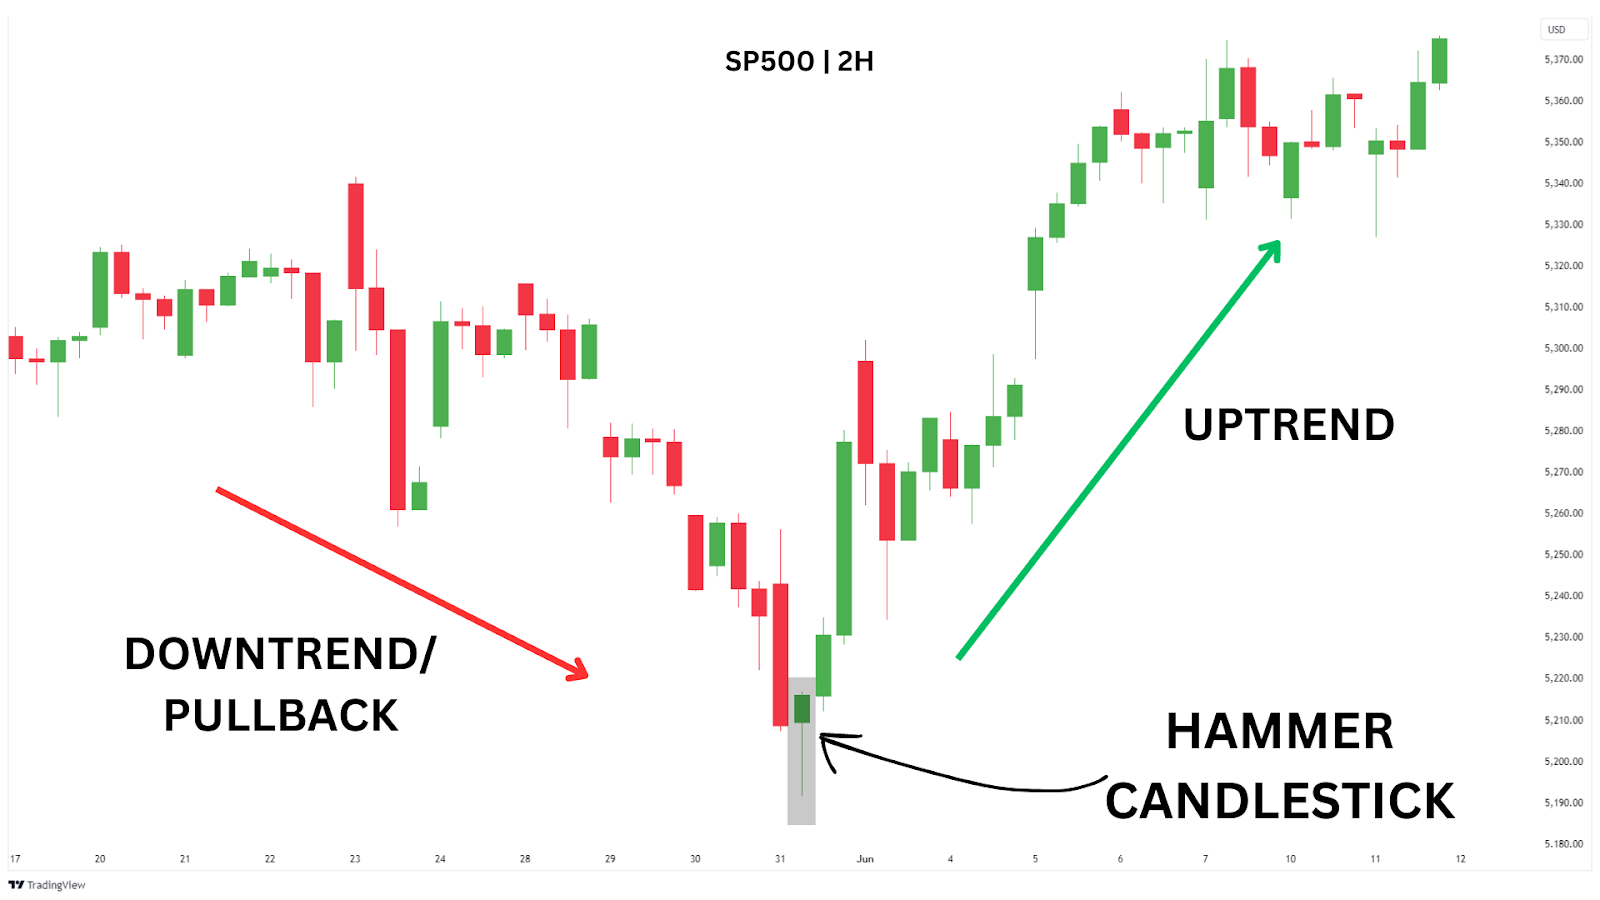
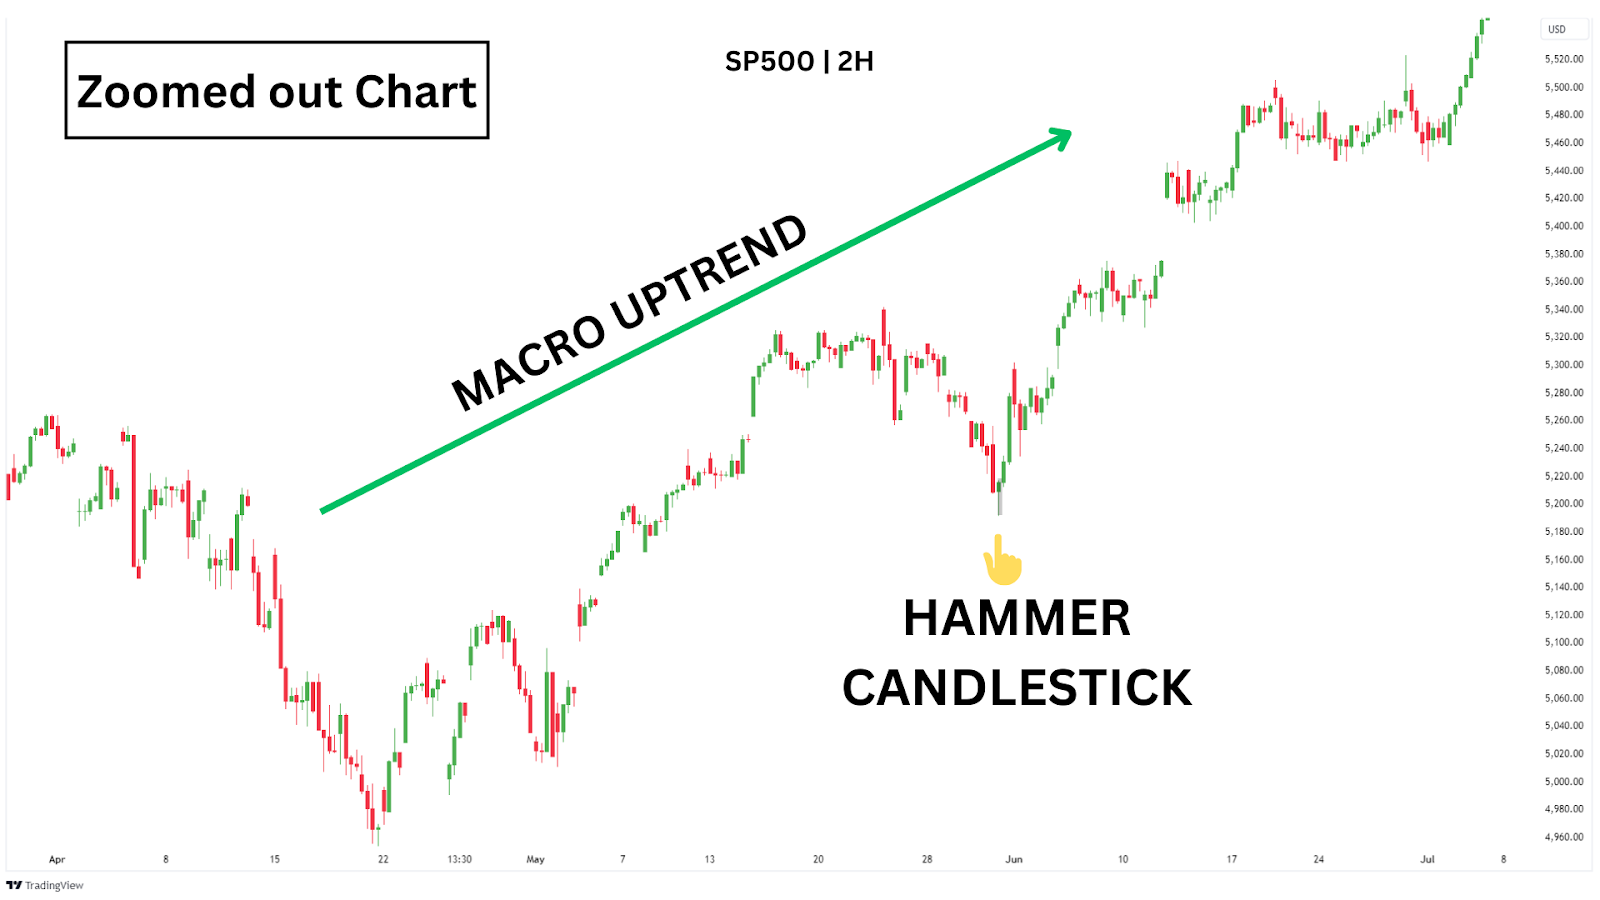
On Friday, 31st May 2024, during the morning session of the New York market, the SP500 exhibited a textbook hammer pattern on the 1-hour chart. This occurred after a brief but aggressive pullback in what was a clear macro uptrend, as seen in this zoomed-out chart.
Our hammer candle was exceptionally strong, featuring a small body with a large lower shadow – indicating that sellers initially pushed the price down, but buyers swiftly stepped in, driving the price back up near the opening level.
The next candle closed with a strong bullish move, confirming the hammer’s reversal signal.
Following this, the price continued to rally aggressively over the next few hours, with the macro uptrend resuming in full force. This pattern highlighted a key buying opportunity for traders who recognised the hammer as a signal that the pullback was temporary, and the broader uptrend was likely to continue.
Now we’ve seen a hammer candlestick in action, let’s explore practical strategies for trading it effectively.
How Do You Trade Hammer Candlesticks?
The hammer candlestick can be traded in a variety of ways, depending on your trading strategy and market conditions.
If you don’t have a trading strategy, and are new to the markets, here are three methods to consider when trading hammer candlesticks.
Method One: Trading Hammer Reversals at Support Zones
A straightforward yet effective way to trade hammer patterns is by focusing on their occurrence at strong support zones, particularly in a macro bullish environment like the SP500 during all-time highs.
Let’s continue with our SP500 chart – first, we’ll zoom out to see the broader picture. This will help us understand how the hammer forms in a previous key zone, the old all-time high consolidation zone (yellow box).
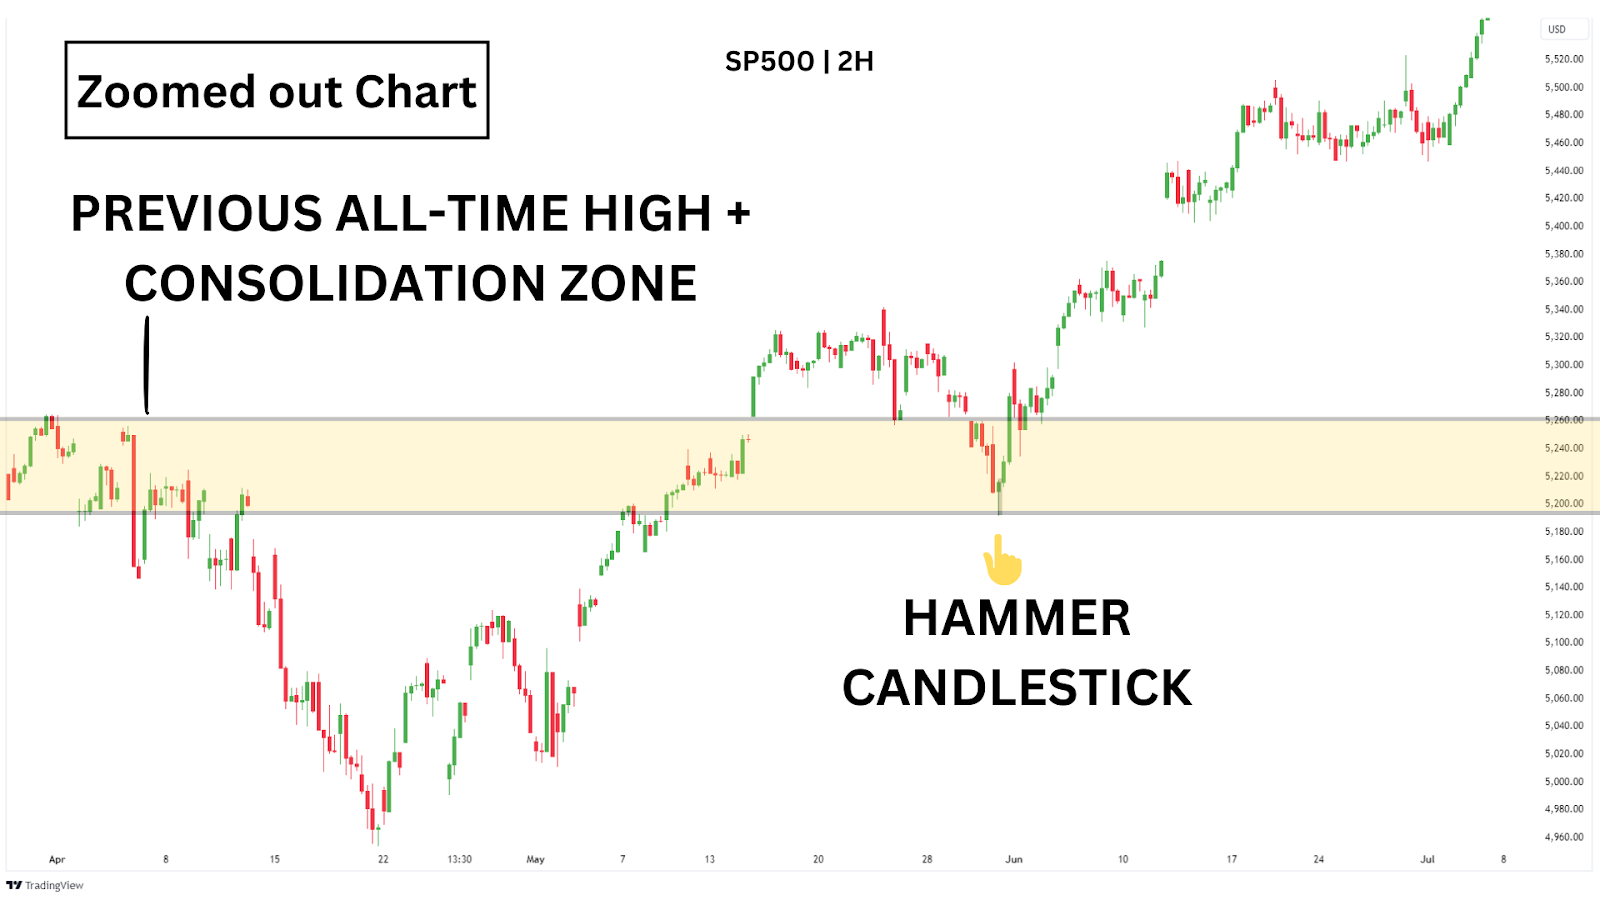
In this case, we are trading in a strongly bullish market, where shorting near support levels AND against the trend is generally not advisable. Instead, the trend is your friend. As we can see, the SP500 had recently broken out to a new all-time-high, and is now pulling back into the yellow zone, a support zone.
The yellow zone consists of the previous high and a consolidation zone, which previously acted as resistance but was flipped into support when it was broken through.
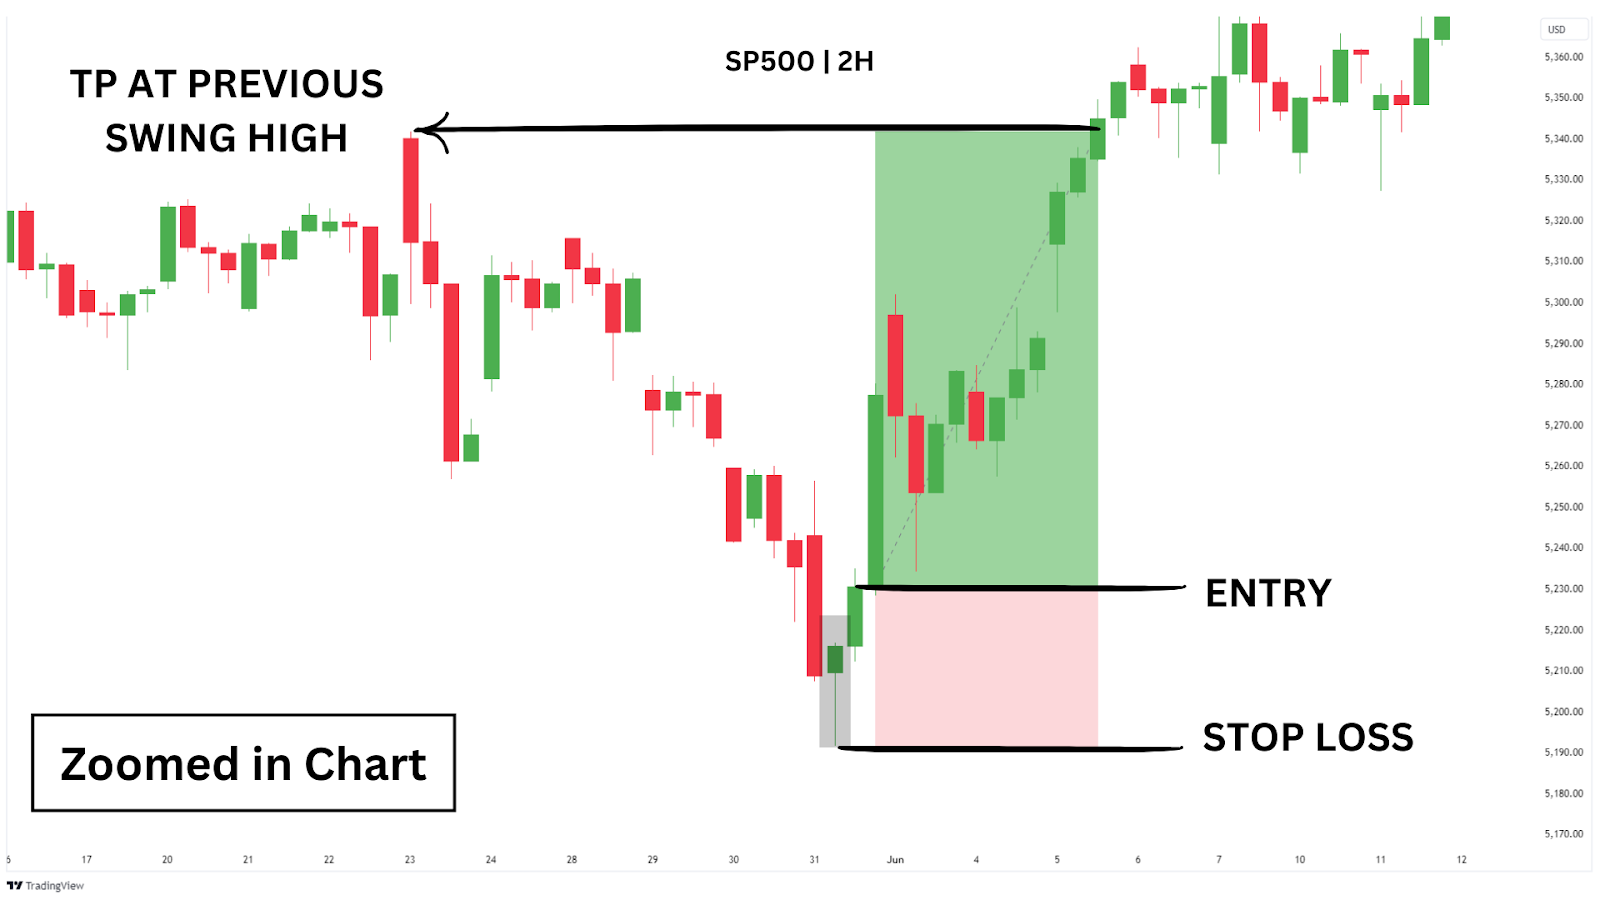
To execute the strategy, we’ll first wait for the hammer to occur at an identified support zone. Then, to confirm the reversal, we will wait for the following candle to close bullish (price closes above the hammer candle). Once the confirmation candle closes bullish, place a market order at the close of the bullish confirmation candle, with our stop-loss positioned just below the hammer’s low.
For take profit, aim for the most recent swing high, aligning with the overall bullish trend.
By using this method, we can align our trades with the prevailing trend, avoiding the pitfalls of shorting in a strong bullish environment and we secure a 2.85 risk-to-reward (RR) trade in only a few hours!
Trading Strategy Summary
Entry Point: Place limit long orders at the close of the bullish confirmation candle that follows a hammer forming at a support zone.
Stop-Loss: Place a stop-loss just below the low of the hammer candlestick.
Profit Target: Aim for the most recent swing high to capture the next move in the uptrend.
| PROS: Highly effective when trading in line with a strong bullish trend, providing clear entry points.Minimises risk by aligning with the broader market trend and placing stop-losses at strategic levels. |
| CONS: May result in missed opportunities if the price does not return to the limit order level. Requires patience as such strong support zones may not form frequently, limiting the number of trading opportunities. |
Method Two: Fibonacci Retracement Strategy
In this method, we’ll be analysing the USOIL 1H chart from Tuesday, 6th of August 2024, where we see a strong bullish reversal forming after a period of downward price action.
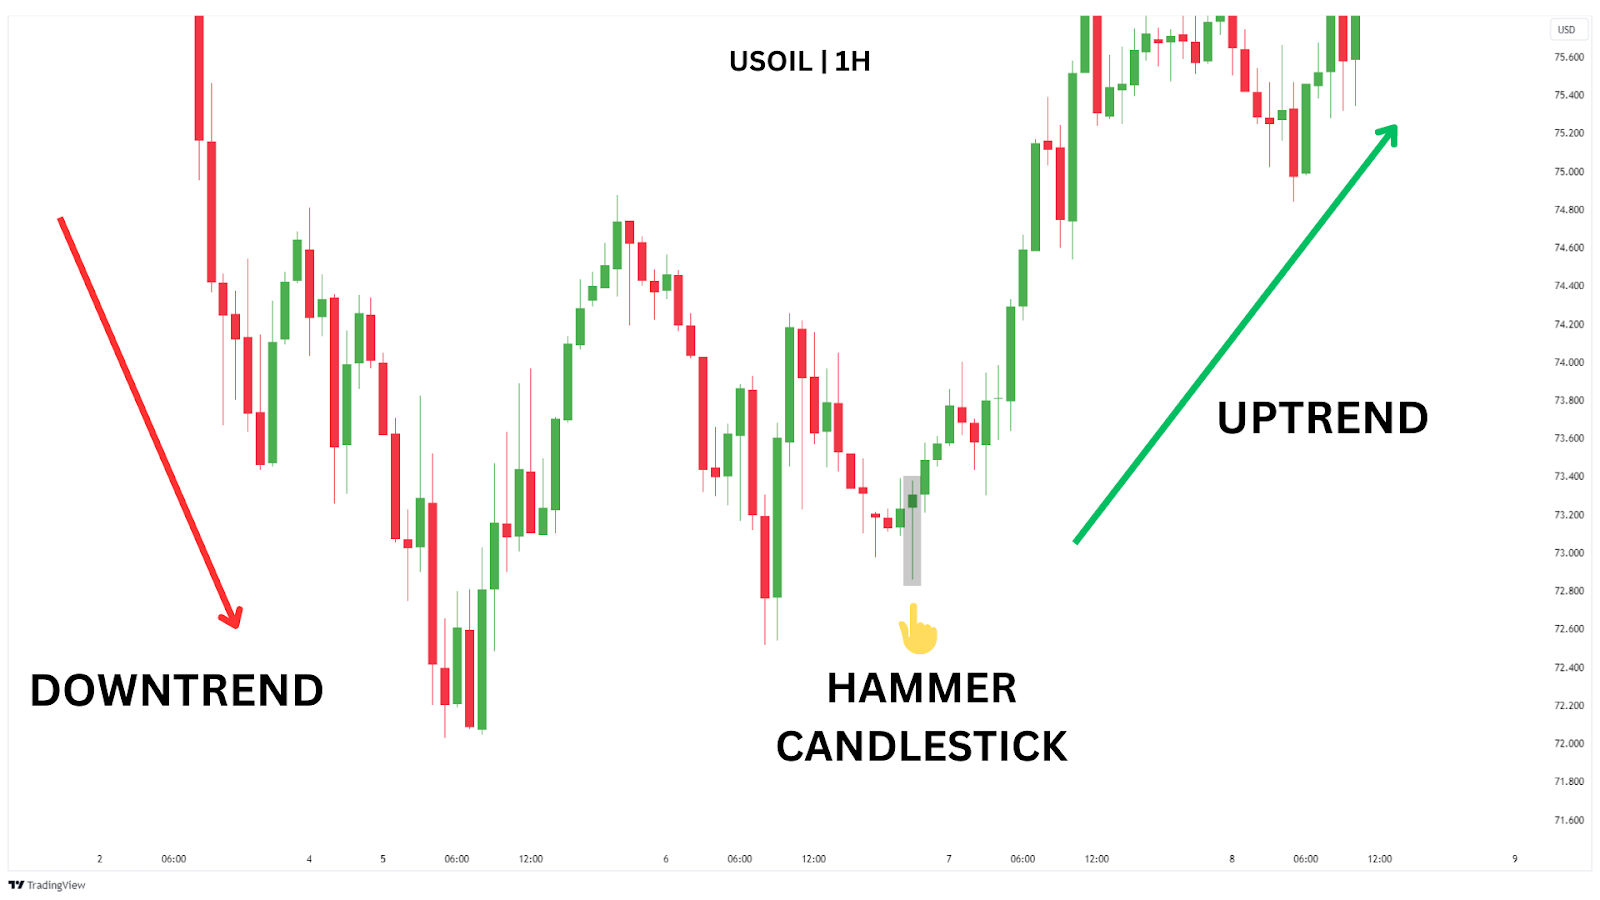
This chart provides a perfect example of how to use Fibonacci retracement levels to identify potential entry points in a recovering market.
After a significant downtrend, the market sets a new lower low, but then makes a higher high, signalling a possible shift in momentum.
To execute this strategy, draw a Fibonacci retracement from the recent low to the new high.
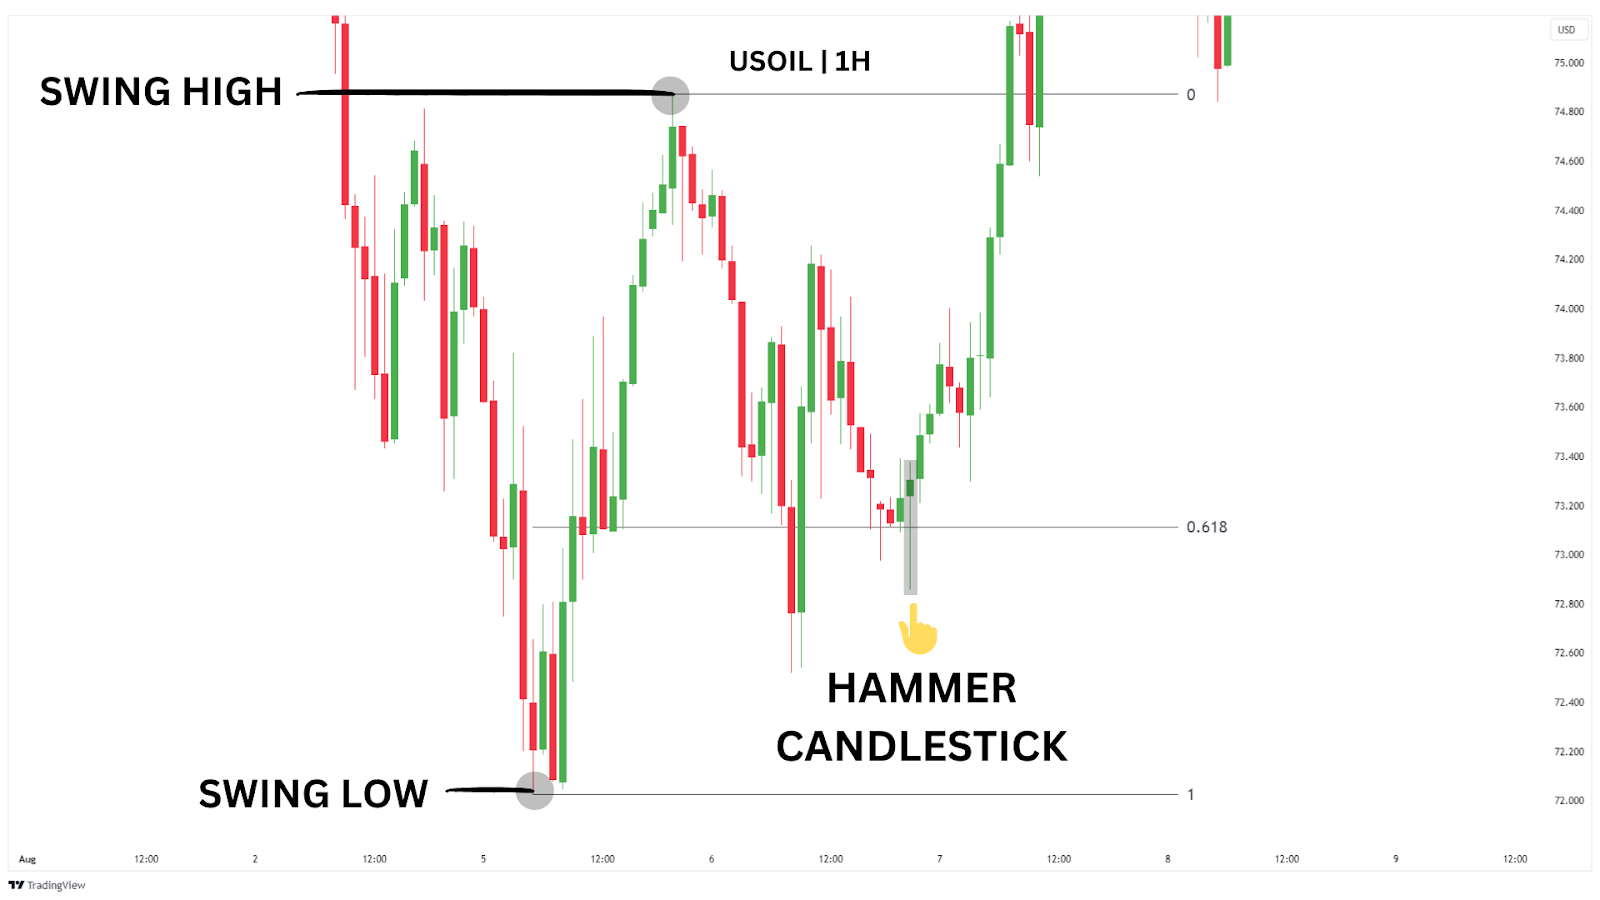
The 0.618 level is key here, as it often acts as a strong support zone where price tends to retrace before continuing its upward movement.
This level is crucial because it represents a common retracement area where buyers are likely to step in, making it an ideal point to watch for a reversal.
Once the price retraces to the 0.618 Fibonacci level, we look for a bullish confirmation signal, such as a hammer candlestick forming at this support zone.
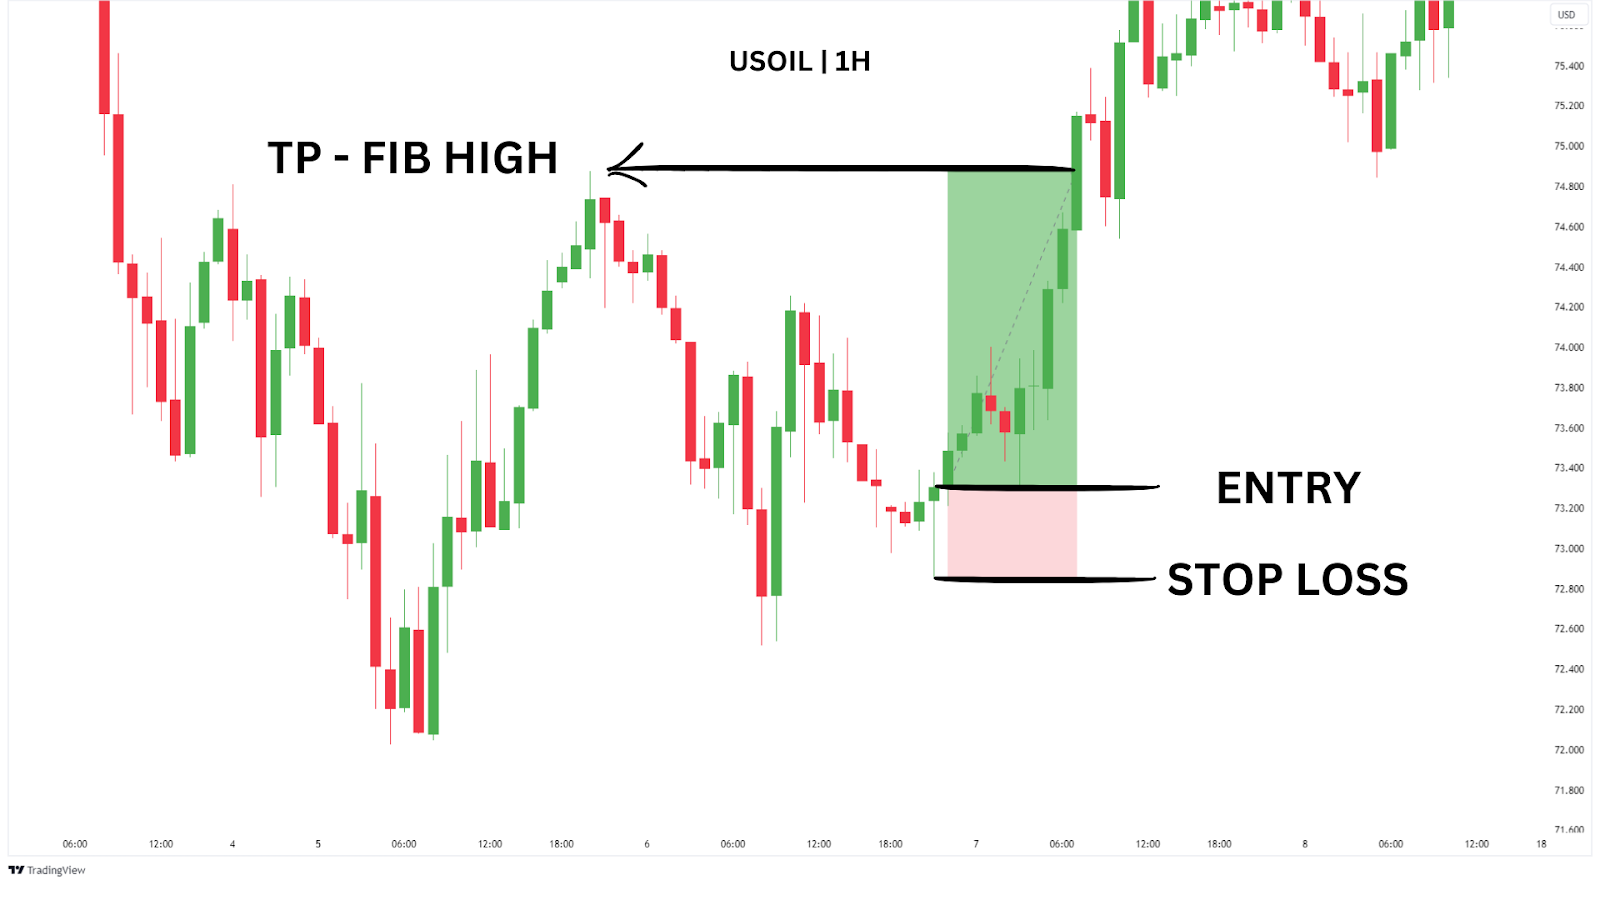
For traders with a higher risk tolerance, the stop-loss can be set just below the hammer’s low. This provides a much better risk-to-reward ratio, but INCREASES your chance of being stopped out. For a more conservative approach, consider placing the stop-loss under the Fibonacci Low.
With the first stop loss approach, this trade yields a 3.5RR return in a few hours – not bad!
Trading Strategy Summary
Entry Point: Place limit long orders at the close of the hammer candle at the 0.618 Fibonacci retracement level, but only after a strong bullish confirmation candle follows.
Stop-Loss: Higher chance of stop loss being hit: Set your stop-loss just below the low of the hammer. Lower chance of stop loss being hit: Place your stop-loss under the Fibonacci low.
Profit Target: Target the Fibonacci high to capture the next move in the uptrend.
| PROS: Utilises Fibonacci levels, which are widely respected in trading, providing a systematic approach to identify entry points. Offers flexibility in risk management by adjusting stop-loss levels based on risk appetite. |
| CONS: Requires accurate identification of Fibonacci levels, which can be challenging for beginners. The strategy might result in missed opportunities if the price doesn’t return to the 0.618 level. |
Method Three: Using RSI Divergence with Hammer Candles
On the 3rd of June, 2024, Gold had been pulling back from all-time highs, so on a macro level, was extremely bullish. We get a textbook hammer candle on the 1H timeframe.
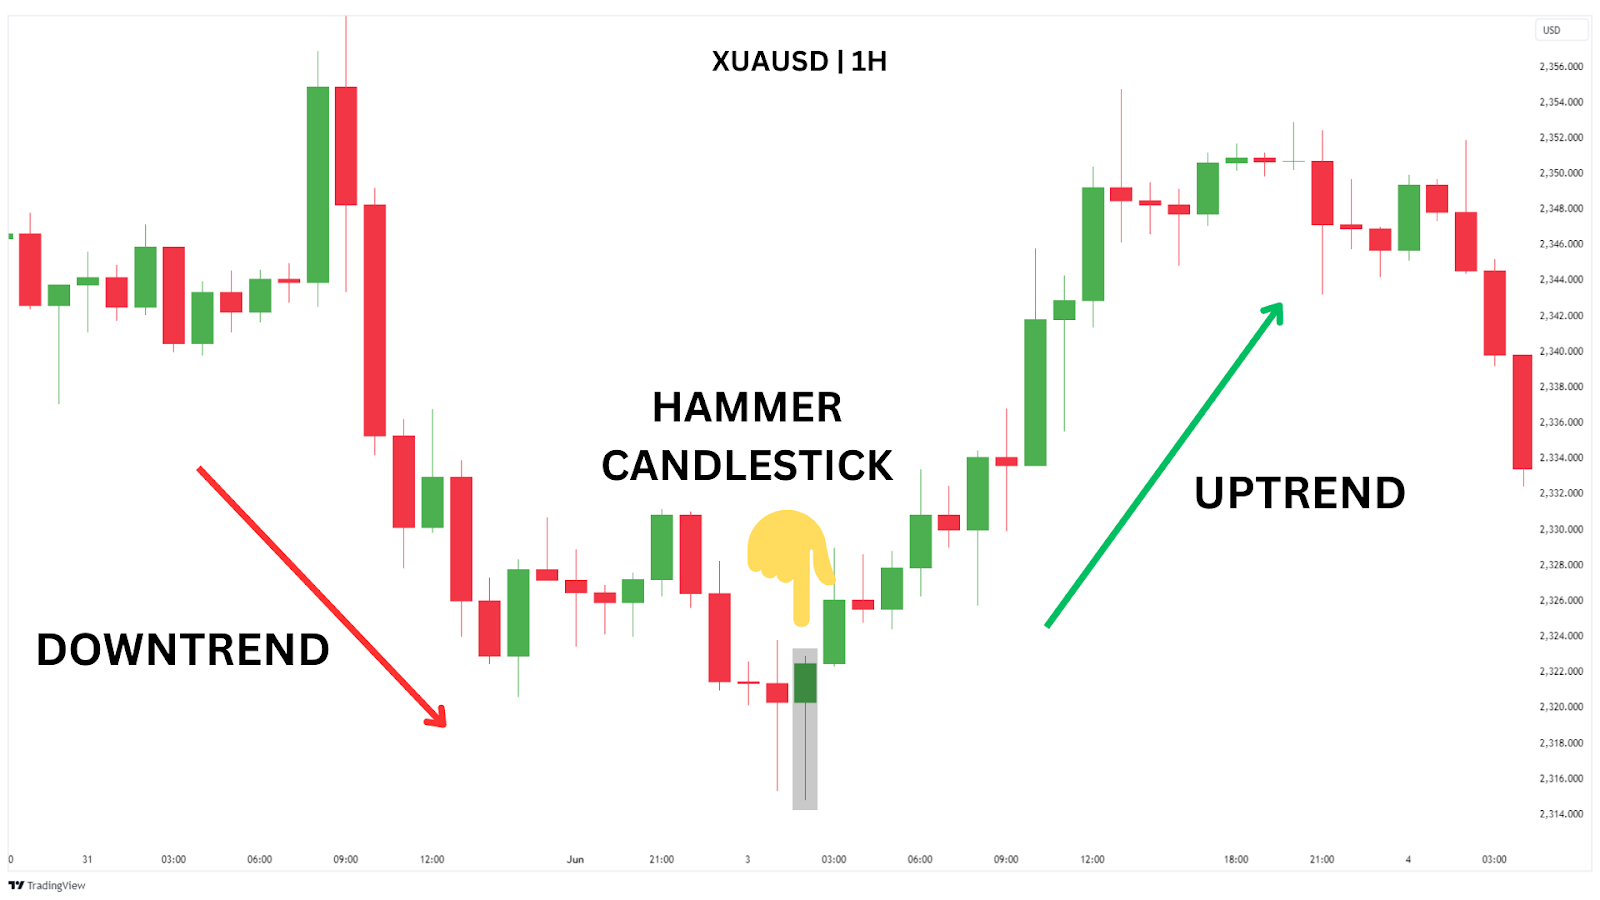
A powerful way to enhance the reliability of the hammer candlestick pattern is by combining it with RSI divergence, particularly when we see it occur in a strong uptrending market like our XAUUSD (Gold) example.
This method builds on the previous techniques by adding a momentum-based confirmation to the mix.
Relative Strength Index (RSI) is a momentum oscillator that measures the speed and change of price movements, typically on a scale of 0 to 100. Traders often use RSI to identify overbought or oversold conditions in the market. When the RSI diverges from the price action, it can signal a potential reversal.
In our XAUUSD chart, after identifying a hammer candlestick, we also notice Bullish RSI Divergence.
This is when price makes a lower low, but the RSI forms a higher low.
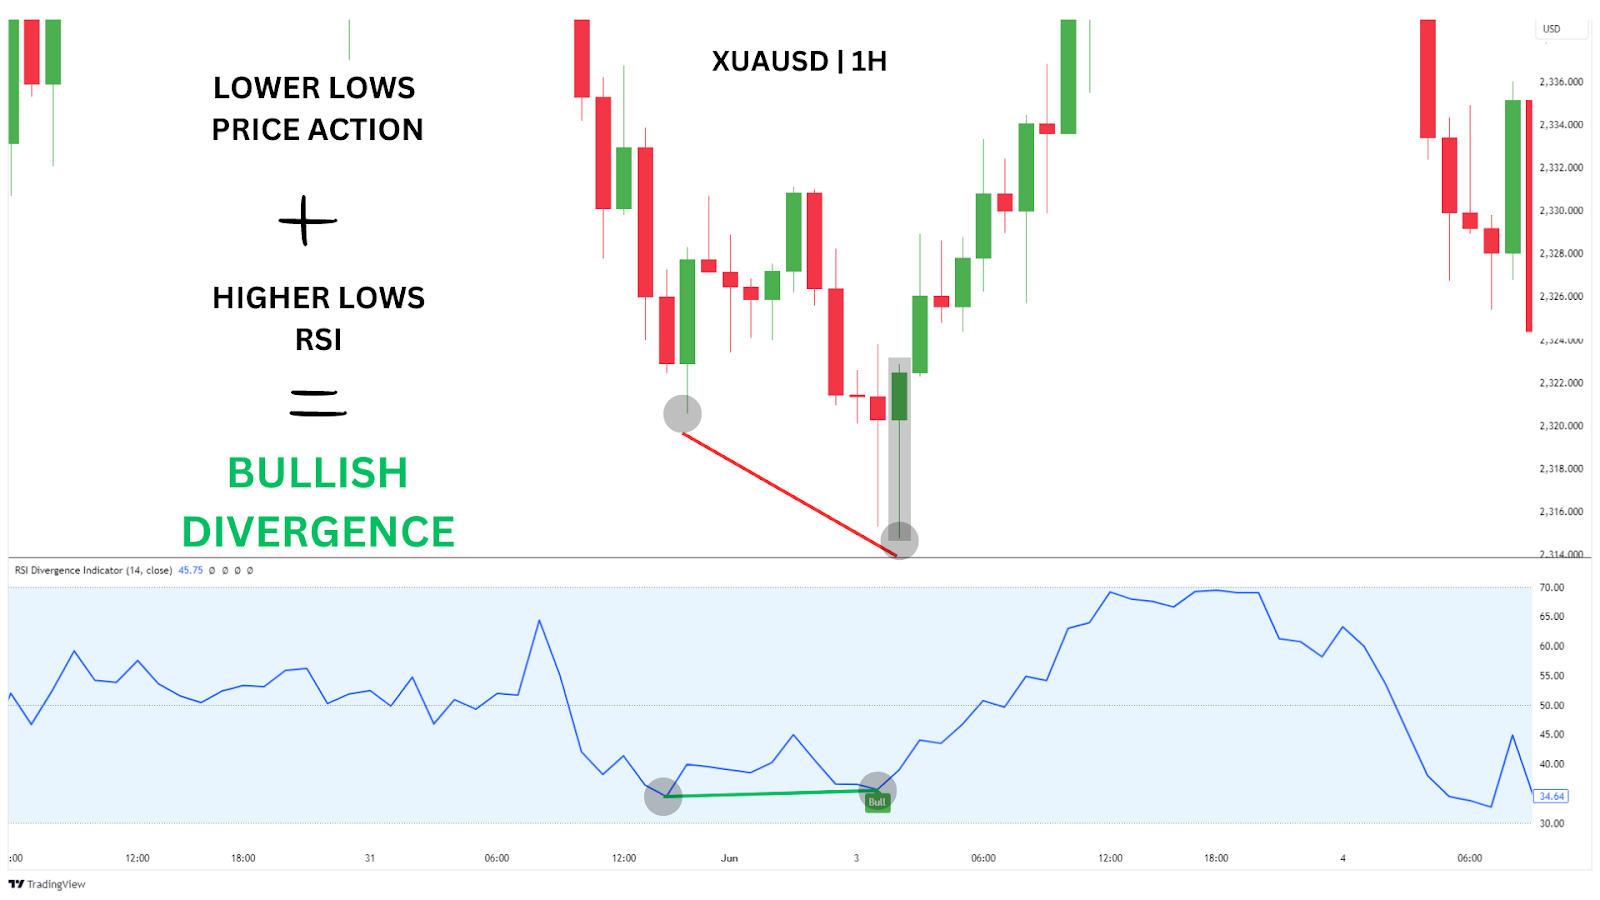
This divergence suggests that while the price was declining, the selling pressure was weakening, hinting at a possible reversal brewing under the hood.
When a hammer candlestick coincides with bullish RSI divergence, it becomes a powerful signal that buyers are stepping in as sellers lose strength. This combination greatly increases the likelihood of a successful reversal, especially in a macro uptrend.
In this instance, we see our hammer from the lower low in the price action, while the RSI diverges and forms a higher high. This, plus our bullish confirmation candle that follows, is our signal to look for long entries.
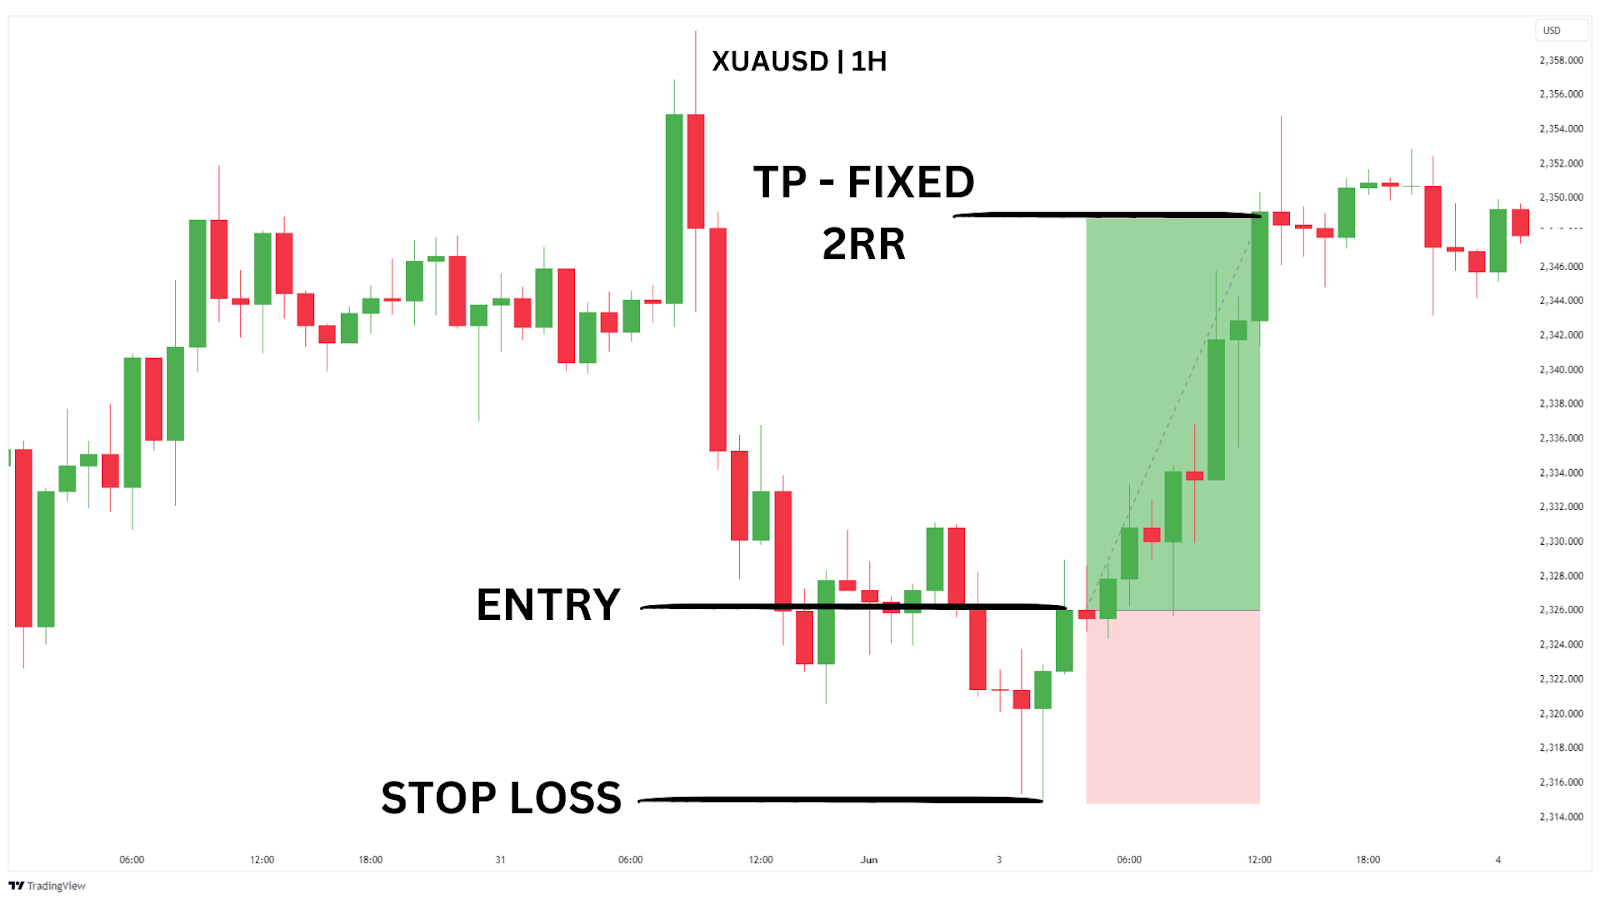
To make this strategy nice and mechanical, removing any guesswork we simply set a limit order at the close of our bullish confirmation candle, with a stop-loss just below its low. For our take profit, we’ll target a fixed risk-to-reward of 1:2.
This trade hits our take profit later that day.
Trading Strategy Summary
Entry Point: Place limit long orders at the close of the bullish confirmation candle that follows the hammer, but only after confirming bullish RSI divergence.
Stop-Loss: Set your stop-loss just below the low of the hammer candle to protect against potential reversals.
Profit Target: Use a fixed risk-to-reward ratio of 1:2, aiming for a calculated profit target based on this ratio.
| PROS: Enhances the reliability of the hammer pattern by confirming with RSI divergence, which reduces the risk of false signals. Provides a clear and systematic approach with a predefined risk-to-reward ratio. |
| CONS: Requires multiple confirmations (RSI divergence, hammer, and bullish candle), which may limit the number of trade opportunities. The need for accurate RSI divergence interpretation can add complexity, especially for less experienced traders. |
What if the Hammer appears during an upswing?
If a hammer candlestick appears during an upswing, it may not be as reliable as a bullish reversal signal. Instead, it could indicate that the price might be facing resistance and that a reversal or pause in the uptrend is possible. This scenario could also be a sign of a hanging man, which is a bearish reversal pattern.
Traders should exercise caution and look for additional confirmation before making any decisions based on the appearance of a hammer during an upswing.
If you’re trading a Hammer candlestick during an upswing, here are some things to pay attention to:
- Look for Resistance Zones: A hammer appearing near strong resistance may indicate a potential reversal or pause in the uptrend.
- Check for Lower Highs: A hammer during an upswing might signal weakening momentum if followed by lower highs, suggesting possible bearish pressure.
- Volume Confirmation: Low volume could indicate weak buying interest, making the hammer less reliable as a reversal signal.
- Watch for Bearish Divergences: If the hammer occurs but bearish divergence is signalling on RSI indicators, be cautious of a potential bearish reversal.
What other types of Hammer Patterns are there?
While this guide focuses on the classic hammer pattern, other similar patterns include the inverted hammer, hanging man, and shooting star.
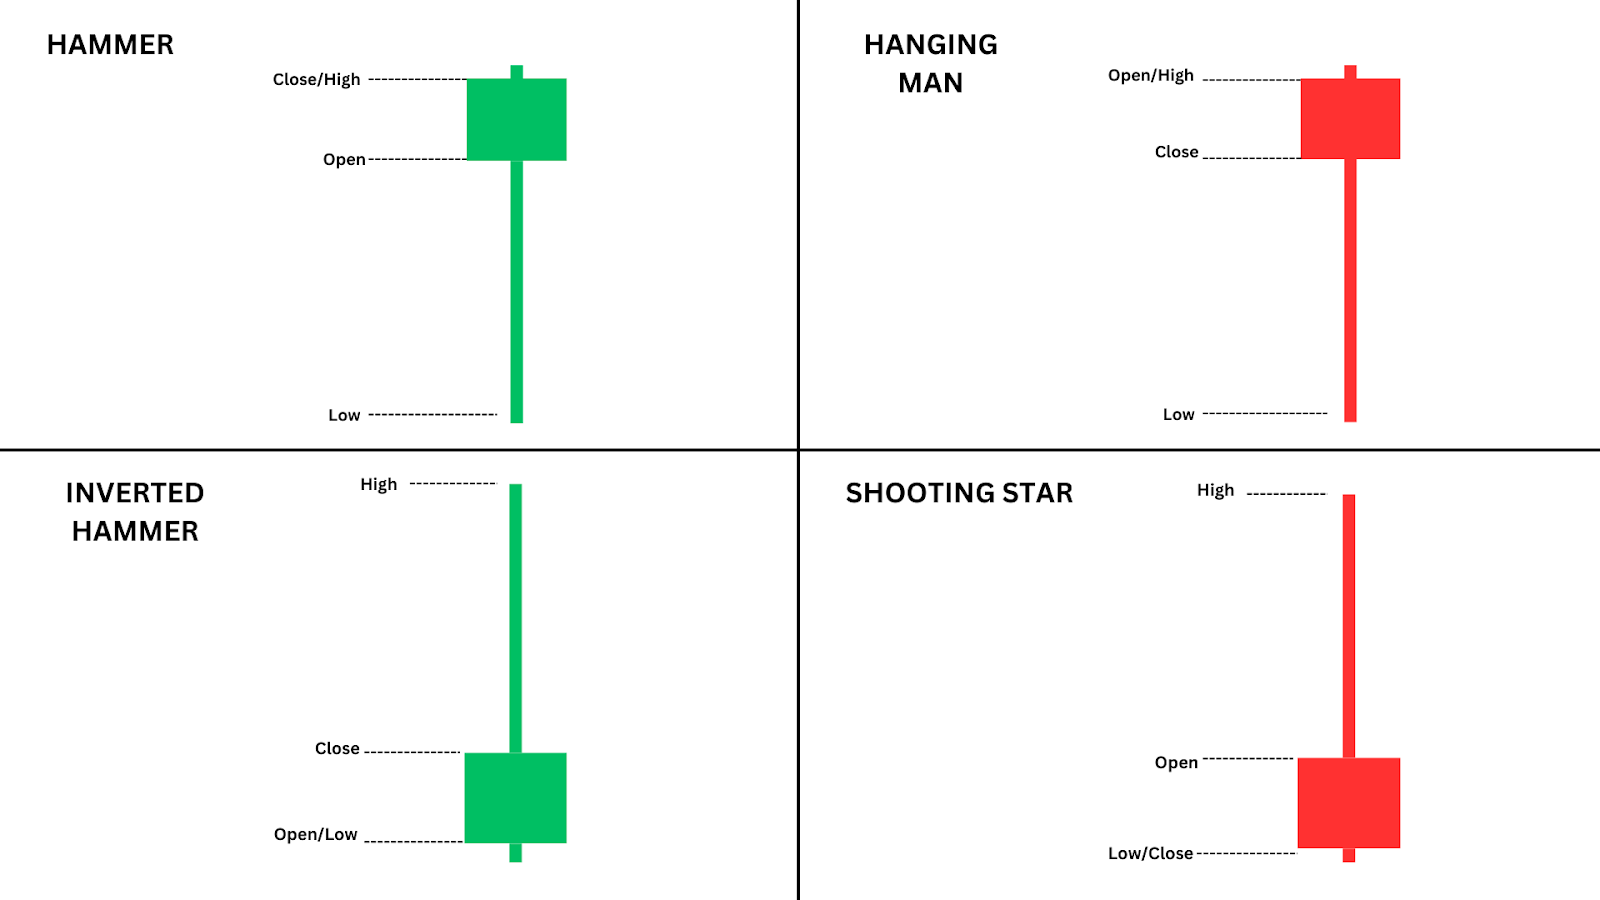
Like the classic hammer pattern, the inverted hammer is also a bullish reversal pattern.It forms with a long upper shadow and a small body, indicating an attempt by buyers to push the price higher after a downtrend.
The hanging man and shooting star, on the other hand, are bearish reversal patterns that appear after an uptrend, signalling a potential reversal to the downside.
The cheat code to distinguishing between these patterns is understanding their placement on the chart. For example, the hammer and inverted hammer are bullish patterns that occur after a downtrend, while the hanging man and shooting star are bearish patterns that appear after an uptrend.
Closing Thoughts on the Hammer Candlestick Pattern
The hammer candlestick pattern is a powerful tool for traders looking to capitalise on bullish reversals. Its clear visual structure and strong reversal signal make it an easy pattern to identify and trade effectively.
When combined with other technical analysis tools and proper risk management, the hammer can become a valuable part of your trading arsenal.
Advantages of Trading the Hammer Candlestick Pattern
- Clear Reversal Signal: The classic hammer candlestick offers a clear and recognisable bullish reversal signal in a downtrend.
- Effective Across Timeframes: This pattern is effective across different timeframes, from intraday trading to longer-term setups.
- Simple to Spot: The hammer’s distinct shape makes it easy to spot on any price chart.
Disadvantages of Trading the Hammer Candlestick Pattern
- Requires Confirmation: The hammer pattern often requires confirmation from the next candle to ensure that a reversal is underway.
- Less Reliable in Strong Downtrends: In strong downtrends, the hammer may produce false signals if additional bearish pressure exists.
- No Defined Price Target: The hammer doesn’t provide a clear exit strategy, requiring traders to rely on other technical tools and detailed trading strategies for target placement.
FAQ Section
When does a hammer candlestick pattern occur?
A hammer candlestick pattern occurs after a downtrend, signalling a potential reversal. It forms when the price dips significantly during the trading session but closes near or above the opening price, leaving a long lower shadow and a small body.
Is the hammer candlestick a bullish or bearish pattern?
The candlestick hammer is a bullish reversal pattern consisting of a long lower shadow and small candle body. It indicates that sellers drove the price lower during the session, but buyers stepped in, pushing the price back up by the close, suggesting a potential upward reversal.
Are doji candlestick patterns similar to the hammer?
While both the hammer and doji patterns can signal reversals, they differ in appearance and meaning. A hammer is a long bullish candlestick with a long lower shadow and a small body, indicating a bullish trend reversal, whereas a doji shows indecision with equal or nearly equal opening and closing prices, signalling a potential bullish continuation pattern or a bearish continuation pattern depending on where the candle appears.
Does the colour of a hammer candlestick pattern matter?
The colour of the hammer candlestick pattern can offer additional insight but is not crucial. A green (bullish candle) hammer may be stronger than a red (bearish candle) hammer, as it shows that buyers fully controlled the close. However, both are considered bullish reversal signals.
What is the hammer vs the hanging man pattern?
Classic hammers are bullish reversal patterns that form at the bottom of downtrends, while the hanging man is a bearish reversal pattern consisting of a long lower shadow and small body that appears at the top of an uptrend. Both share similar structures but indicate different market directions.
What is the Difference Between a Hammer and Other Bullish Candlestick Reversal Patterns?
Typically, most bullish candlestick reversal patterns appear at the lows of a downswing, a short term downtrend. This includes the hammer, the bullish engulfing pattern, the morning star pattern and more. The only real difference between the hammer and other bullish candlestick reversal patterns is their shape, recorded reversal strength, and conventional stop loss/take profit placements.