


Hanging Man Candlestick: A Trader’s Guide to Spotting Reversals
The Hanging Man is a key bearish candlestick pattern that signals potential market tops. This guide walks you through how to identify it, confirm it, and trade it effectively using real chart examples and strategies.
Mastering candlestick patterns is essential for any trader aiming to anticipate market trends. The Hanging Man pattern, like many reversal signals, can offer valuable insights when used correctly. Here’s everything you need to know to spot and trade it effectively.
What is a Hanging Man Candlestick?
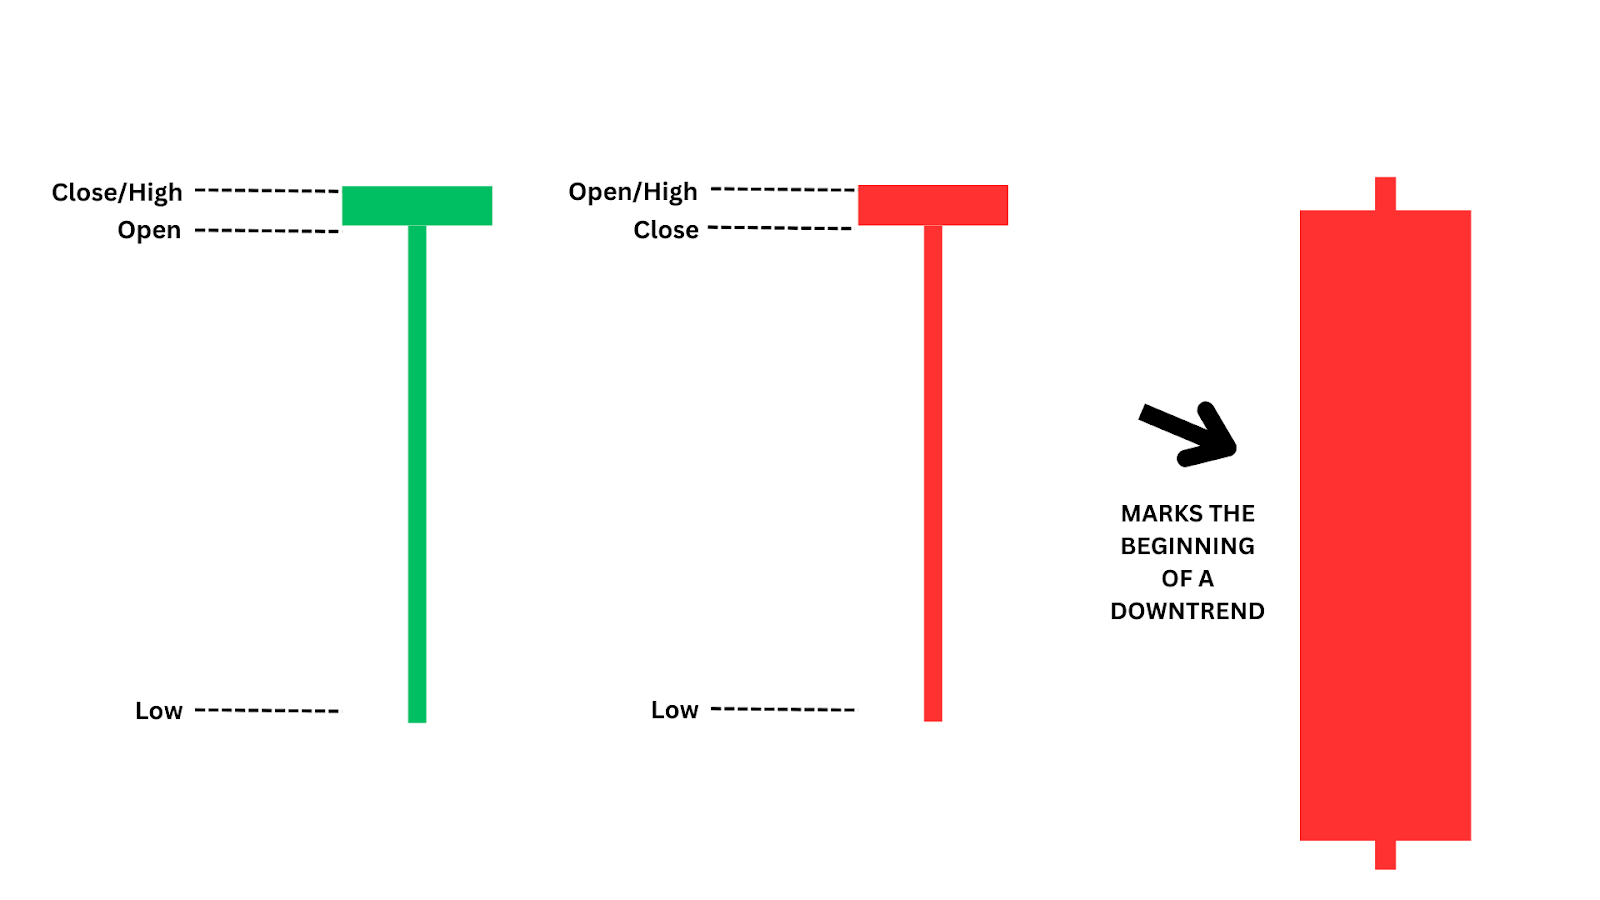
The Hanging Man candlestick is a bearish reversal pattern that signals the potential end of an uptrend. It’s characterised by a small body at the top of the candle range and a long lower shadow, often seen after a significant rally in price. Visually, it looks like a “hanging man” with its small body and extended lower wick.
Imagine a climber reaching the top of a mountain only to lose grip and dangle off the edge – that’s the visual effect of the Hanging Man pattern. It signals that although buyers initially drove prices higher, sellers gained control by the end of the session, indicating potential downward pressure.
This pattern serves as a potential warning that the upward momentum may be nearing exhaustion and that a bearish reversal could be on the horizon. Let’s see how this appears on the charts.
Examples of Hanging Man Candlestick Patterns
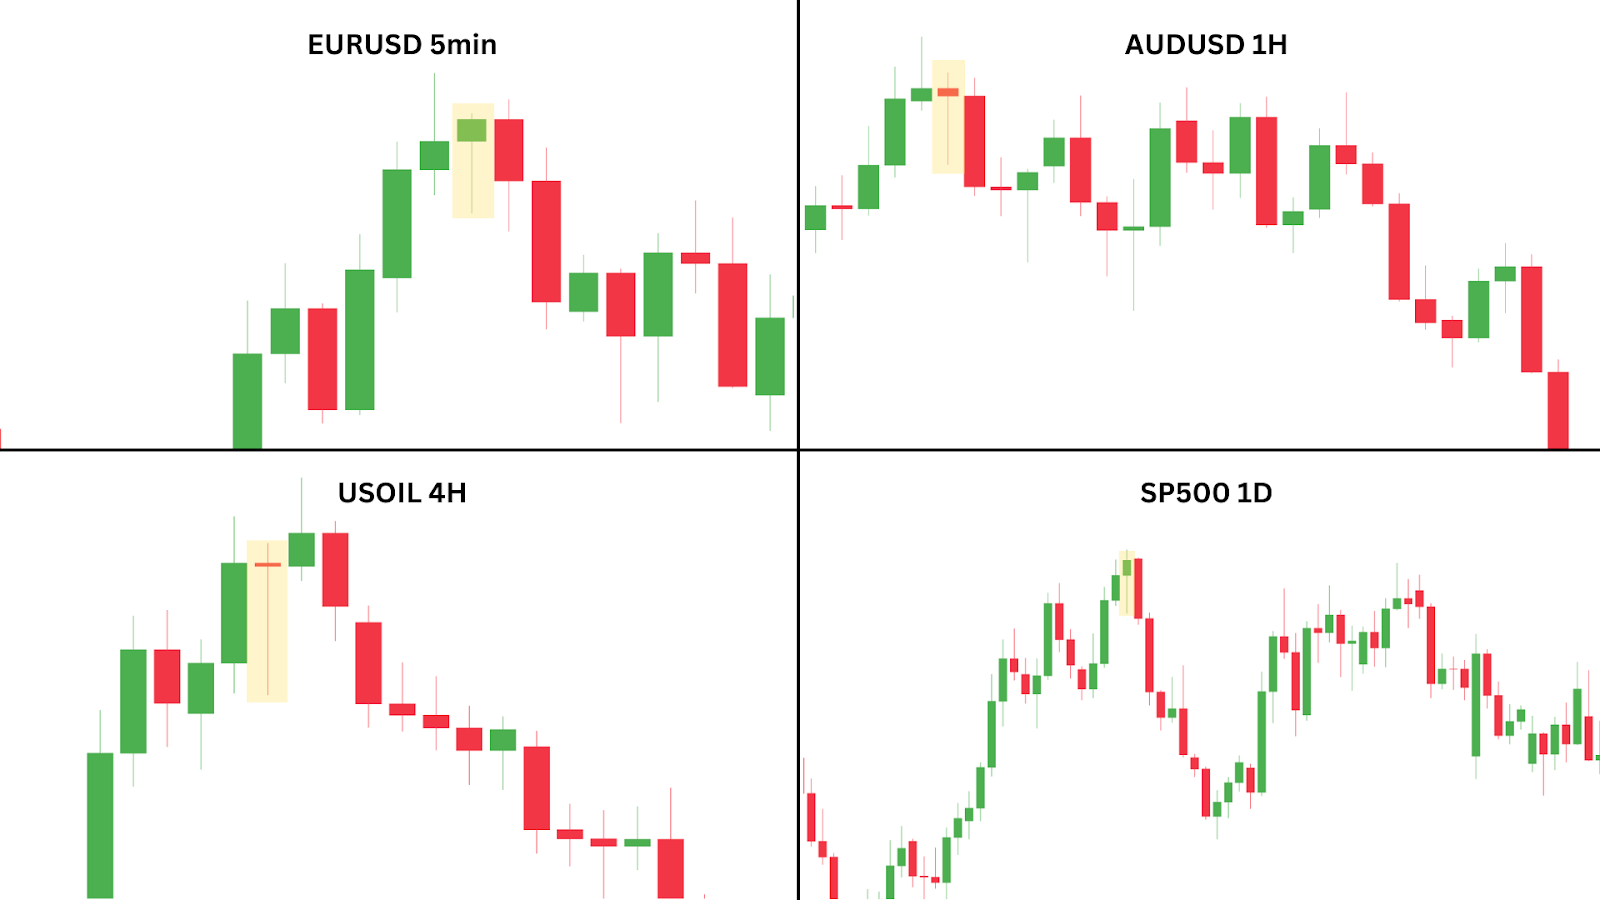
The reliability of a Hanging Man pattern depends on several factors, including the timeframe and market context. Higher timeframes (e.g., daily or weekly charts) generally provide stronger, more reliable signals than lower timeframes.
- Location in Trend: A Hanging Man at a resistance level within a clear uptrend is more reliable than one in choppy markets.
- Key Resistance Levels: Appearing near significant resistance levels strengthens its reversal potential.
- Extended Uptrend: A prolonged uptrend increases the likelihood of the Hanging Man indicating exhaustion in bullish momentum.
- High Volume: High trading volume during the formation signals stronger seller participation, reinforcing the bearish signal.
- Confluence with Indicators: Pairing the pattern with bearish indicators (e.g., RSI divergence) boosts reversal reliability.
- Higher Timeframes: Patterns on daily or weekly charts tend to be more reliable.
- Minimal Upper Wick: A small or absent upper wick enhances the bearish signal, showing that sellers overcame initial buying.
Now, let’s explore a real-life example of the Hanging Man pattern in action and its significance in the markets.
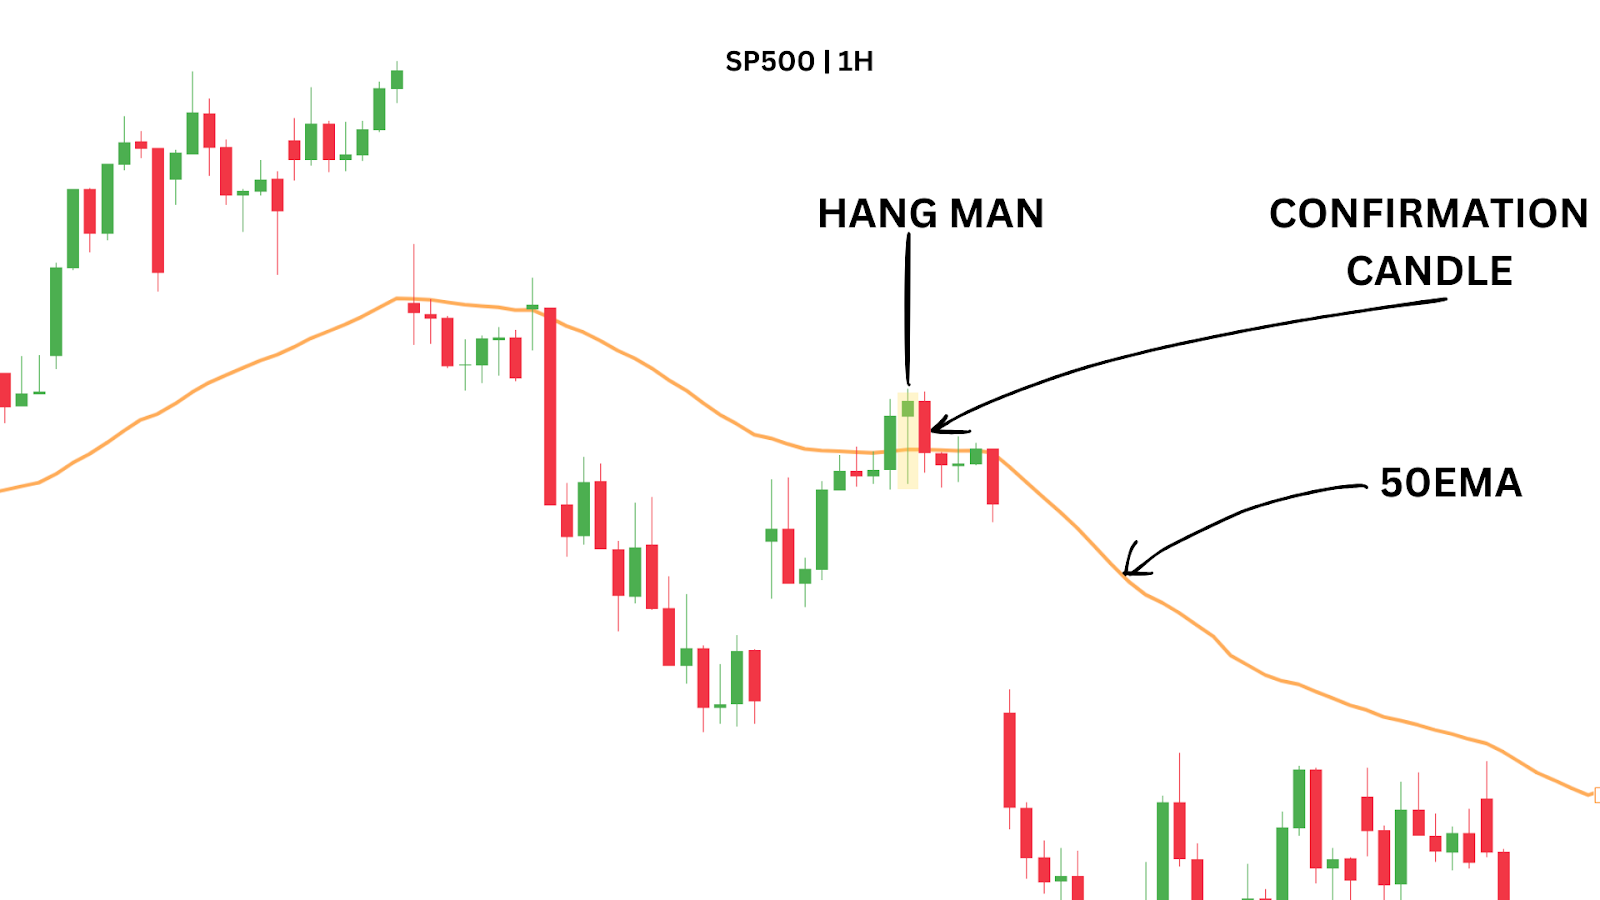
Case Study: SP500 Hanging Man Candlestick Pattern
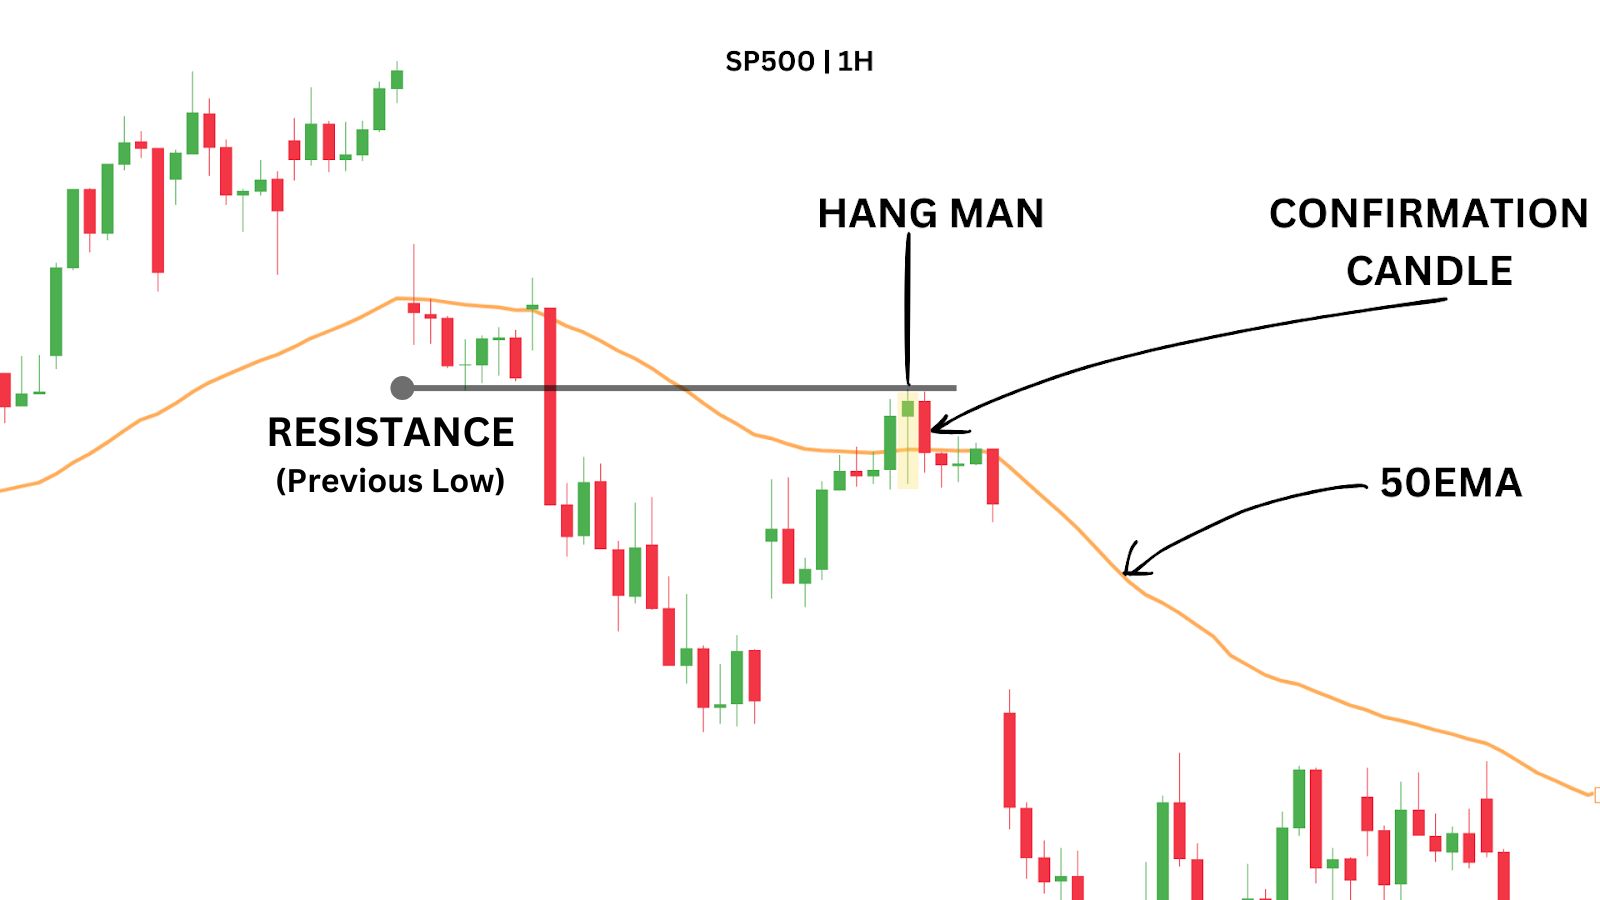
On July 23, 2024, the SP500 1-hour chart displayed a classic Hanging Man pattern that signalled an impending bearish reversal.
After a rally in a broader downtrend, a hanging man appears near the EMA 50 and at a previous low, which has now flipped into resistance. This suggests a potential lower high is forming. At this stage, the reversal isn’t confirmed— it’s only when the following candle closes red, and below the EMA 50 that our confidence for a bearish reversal is boosted.
This setup demonstrates how the Hanging Man pattern, especially when supported by a bearish confirmation candle, can act as an early indicator of a trend reversal.
We’ll explore how you could have capitalised on this price action in method three.
How Do You Trade Hanging Man Candlesticks?
Trading the Hanging Man pattern can be an effective way to capitalise on trend reversals. Here, we’ll explore three different strategies that leverage the pattern’s bearish potential.
Method One – Sell at Resistance with Confirmation Candle
When trading the Hanging Man candlestick, one effective approach is to look for the pattern forming at a key resistance level and wait for a bearish confirmation candle before entering. This setup allows traders to capitalise on potential reversals at resistance, increasing the probability of a successful trade.
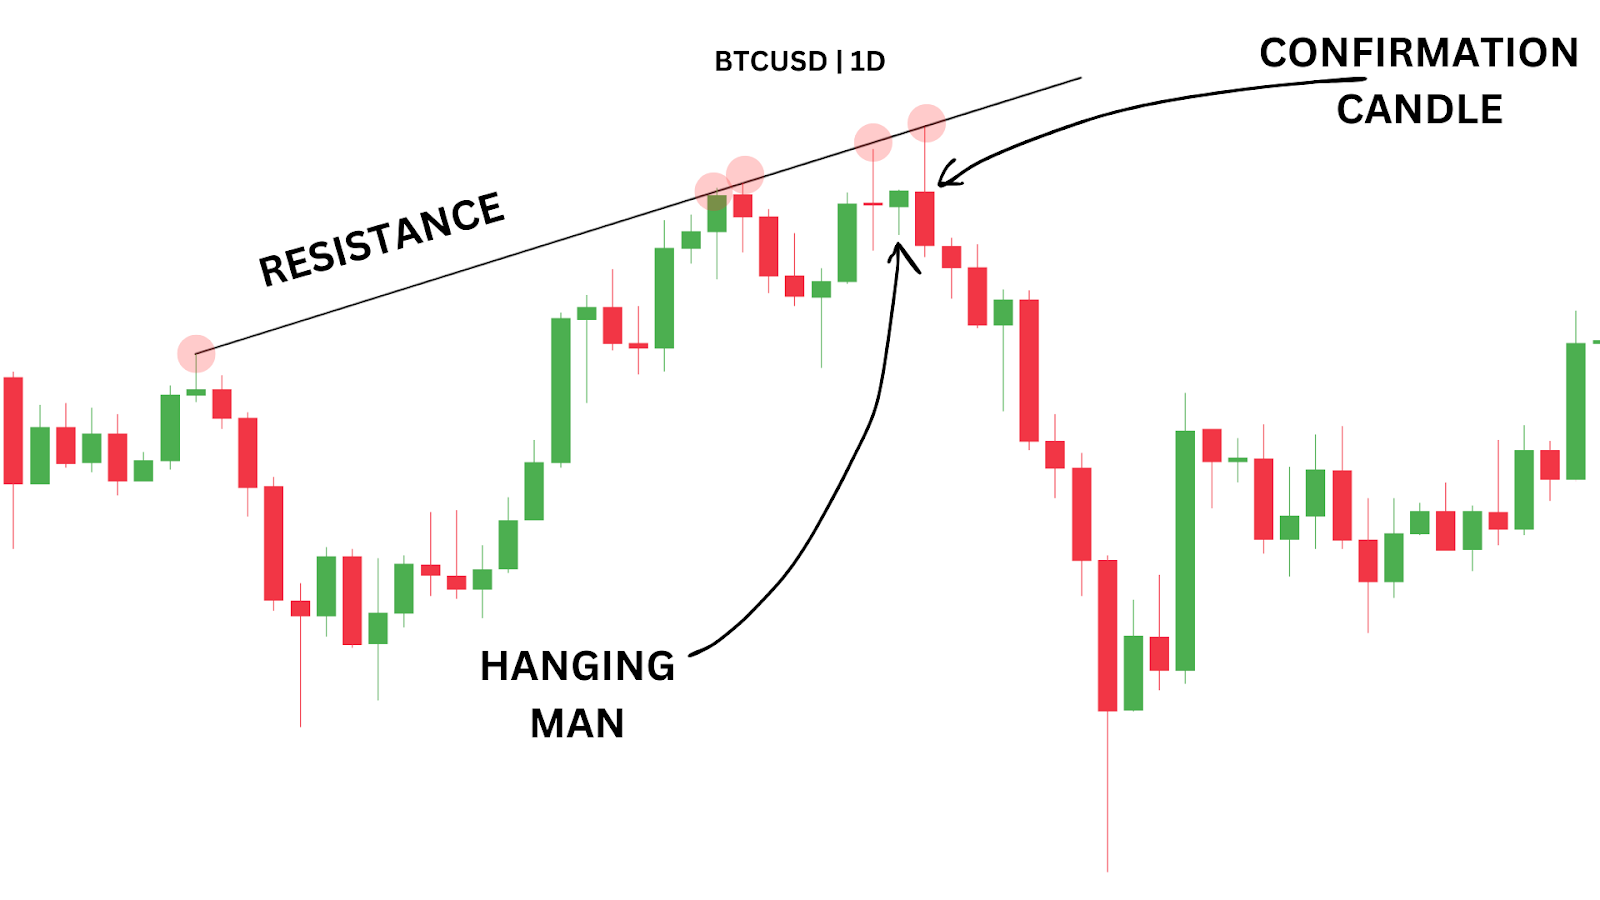
In our example on the BTC 1D chart from July 28, 2024, a Hanging Man pattern appeared near a strong resistance trendline. This trendline has been tested multiple times and has created bearish reactions, validating its ability to act as resistance . A large bearish candle followed the Hanging Man, confirming the reversal and signalling sellers were gaining control.
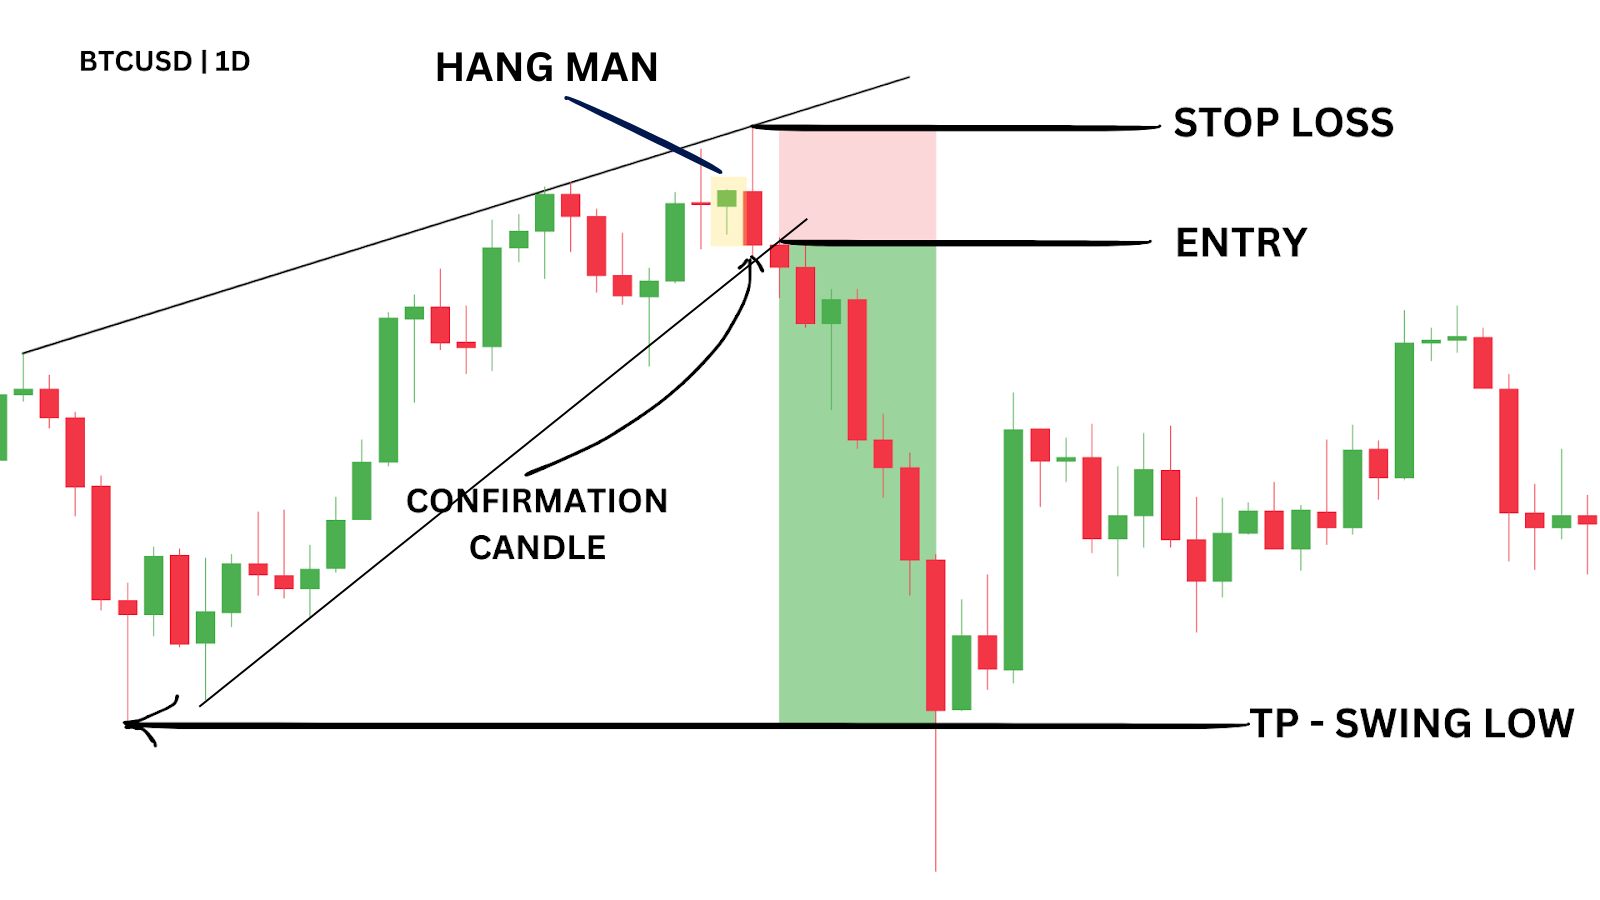
Entering the trade on the next candle with a stop-loss just above the recent swing high allowed for a clean 4:1 reward-to-risk ratio (RRR), with a profit target set at the most recent swing low.
Not only did we have a Hanging Man at resistance, but the pattern also coincided with a rising wedge formation. Rising wedges tend to reverse back to their starting point. In this case, the most recent swing low became a perfect target for the downside move.
This additional confluence between the rising wedge and the Hanging Man pattern boosted the trade’s reliability, providing a more solid foundation for entering the market.
Trading Strategy Summary:
- Entry Point: Enter after the bearish confirmation candle following the Hanging Man.
- Stop-Loss: Place stop-loss above the most recent swing high.
- Profit Target: Target the recent swing low for a 4.06 RRR.
| PROS: High RRR potential when trading at resistance, provides clear entry, stop-loss, and target |
| CONS: Requires patience for confirmation, can miss opportunities in fast-moving markets |
Method Two – Trade the Hanging Man with Bollinger Bands®
Often, after an impulsive move up or down, a consolidation would take place. It’s during these consolidation periods where traders can utilise the Bollinger Bands indicator to find potential support and resistances.
Here’s how the indicator works:
- The upper band is a resistance level during sideways consolidations.
- The lower band acts as a support level during this sideways period.
- The middle band has potential to act as a resistance level when price is below it, or a support level when price is above.
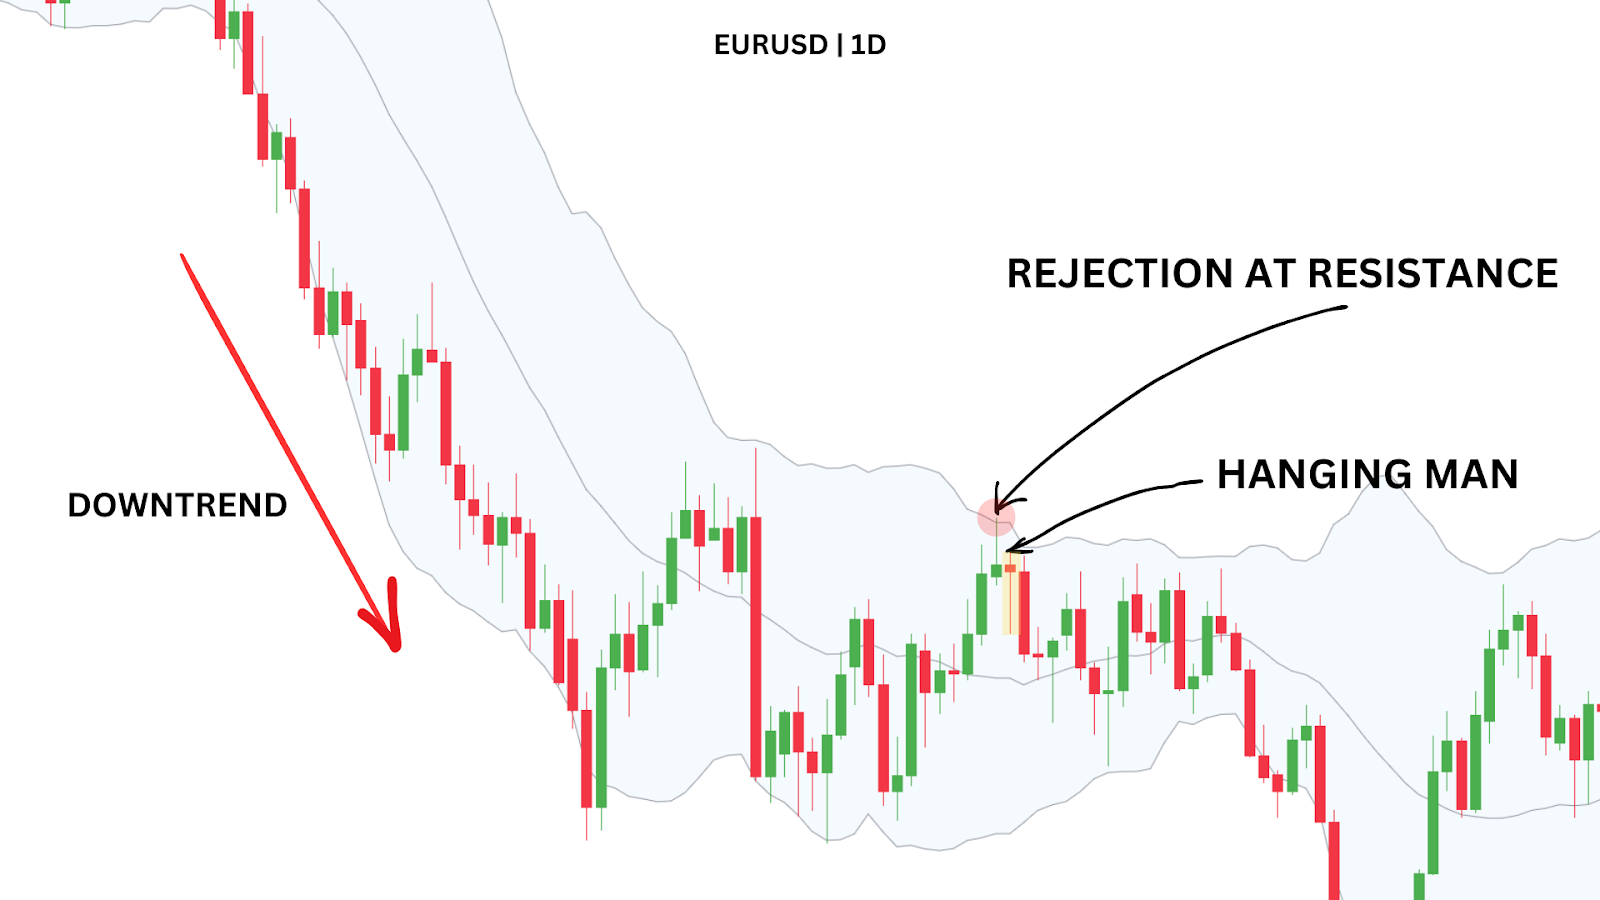
In our example on EUR/USD’s daily chart from July 10, 2018, we see an impulsive push down, followed by a consolidation/sideways period. The Bollinger Bands visually signifies this as well, when the bands begin to curve into a more horizontal, neutral state.
Remember, during a consolidation, the outer bands of the Bollinger can become reliable support and resistance. To trade the hanging man in this scenario, we’d be observing for the following:
- An initial rejection from the upper band.
- The formation of a hanging man candlestick.
- A subsequent candlestick that closes lower, which would serve as the confirmation candle & entry signal.
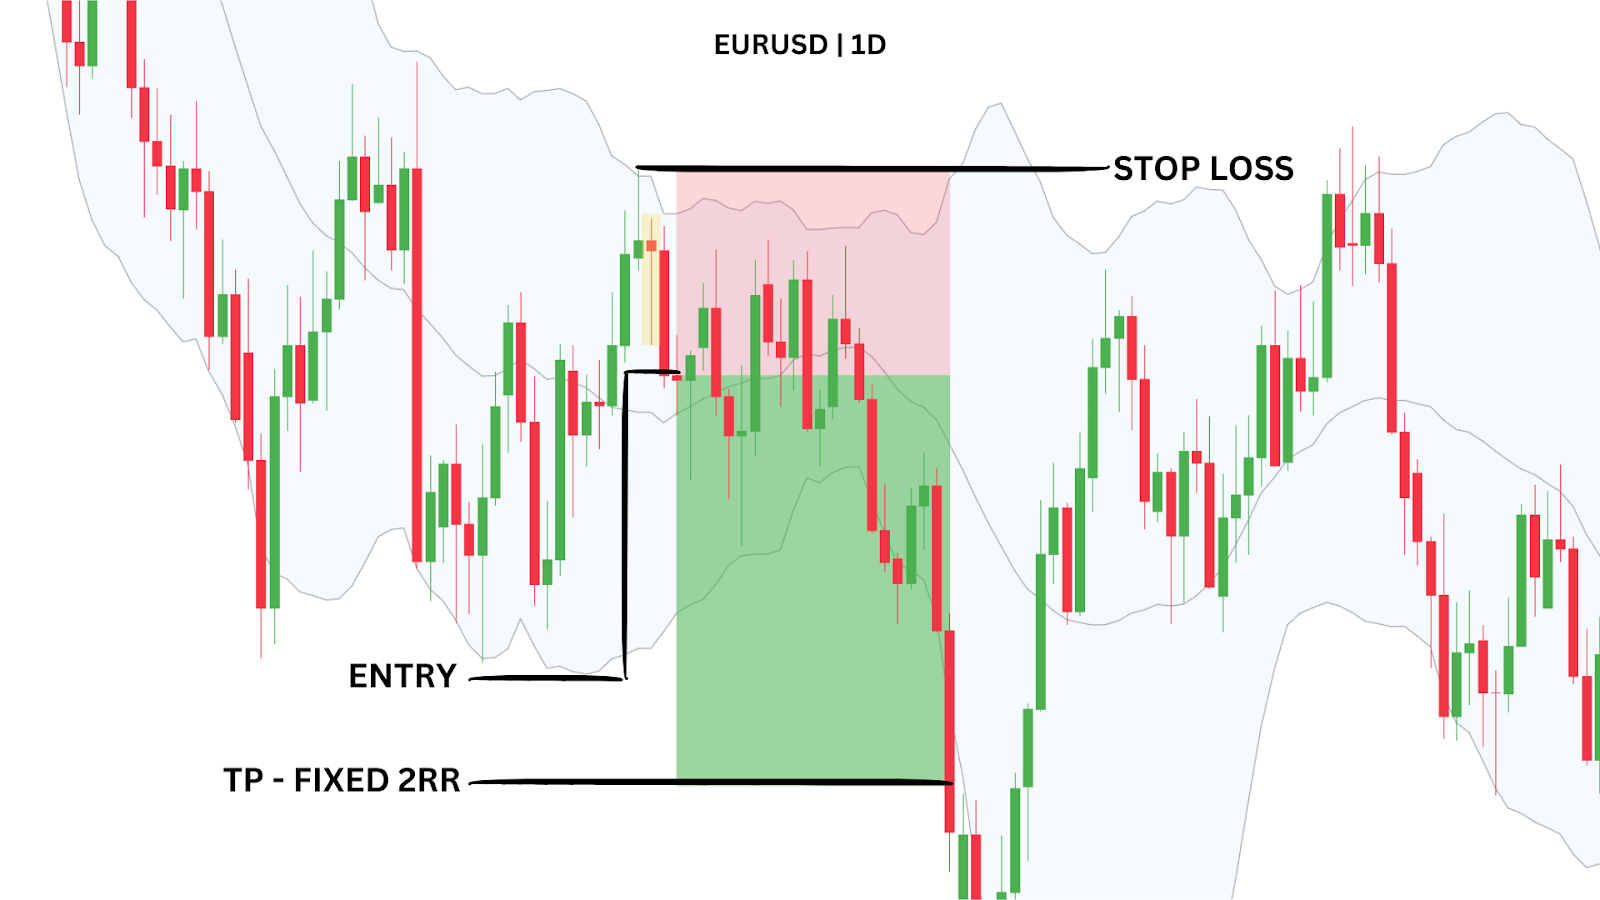
Placing the stop loss above the pivot high, we’re offered a reliable 2:1 reward-to-risk (RRR) trade. The fact that the pivot high was above the Bollinger Band’s top added extra confidence to the setup.
Trading Strategy Summary:
- Entry Point: Enter short after the bearish confirmation candle following the Hanging Man.
- Stop-Loss: Place stop-loss above the pivot high.
- Profit Target: Aim for a fixed 2:1 RRR.
| PROS: Strong confluence with Bollinger Band rejection, aligned with the overarching downtrend |
| CONS: Less effective in choppy or non-trending markets, can miss quick reversals if trend shifts |
Method Three – Failure at the EMAs
This method focuses on the Hanging Man pattern forming at or near a key EMA, signalling a potential failure to break through and a shift in momentum.
On July 23, 2024, the SP500 1-hour chart provided an example of this setup. After aggressively falling through the 50 EMA with a gap down, there was a weak rally back up to the EMA.
At the top of this rally, a Hanging Man candlestick pattern was formed. This alone is not enough for us to enter a short position, however, as the hanging man merely signals a slight potential for a reversal.
Fortunately, the following candle closed back below the 50 EMA, which acts as a confirmation candle of the bearish reversal idea, and that this rally was only a small pullback in the broader downtrend.
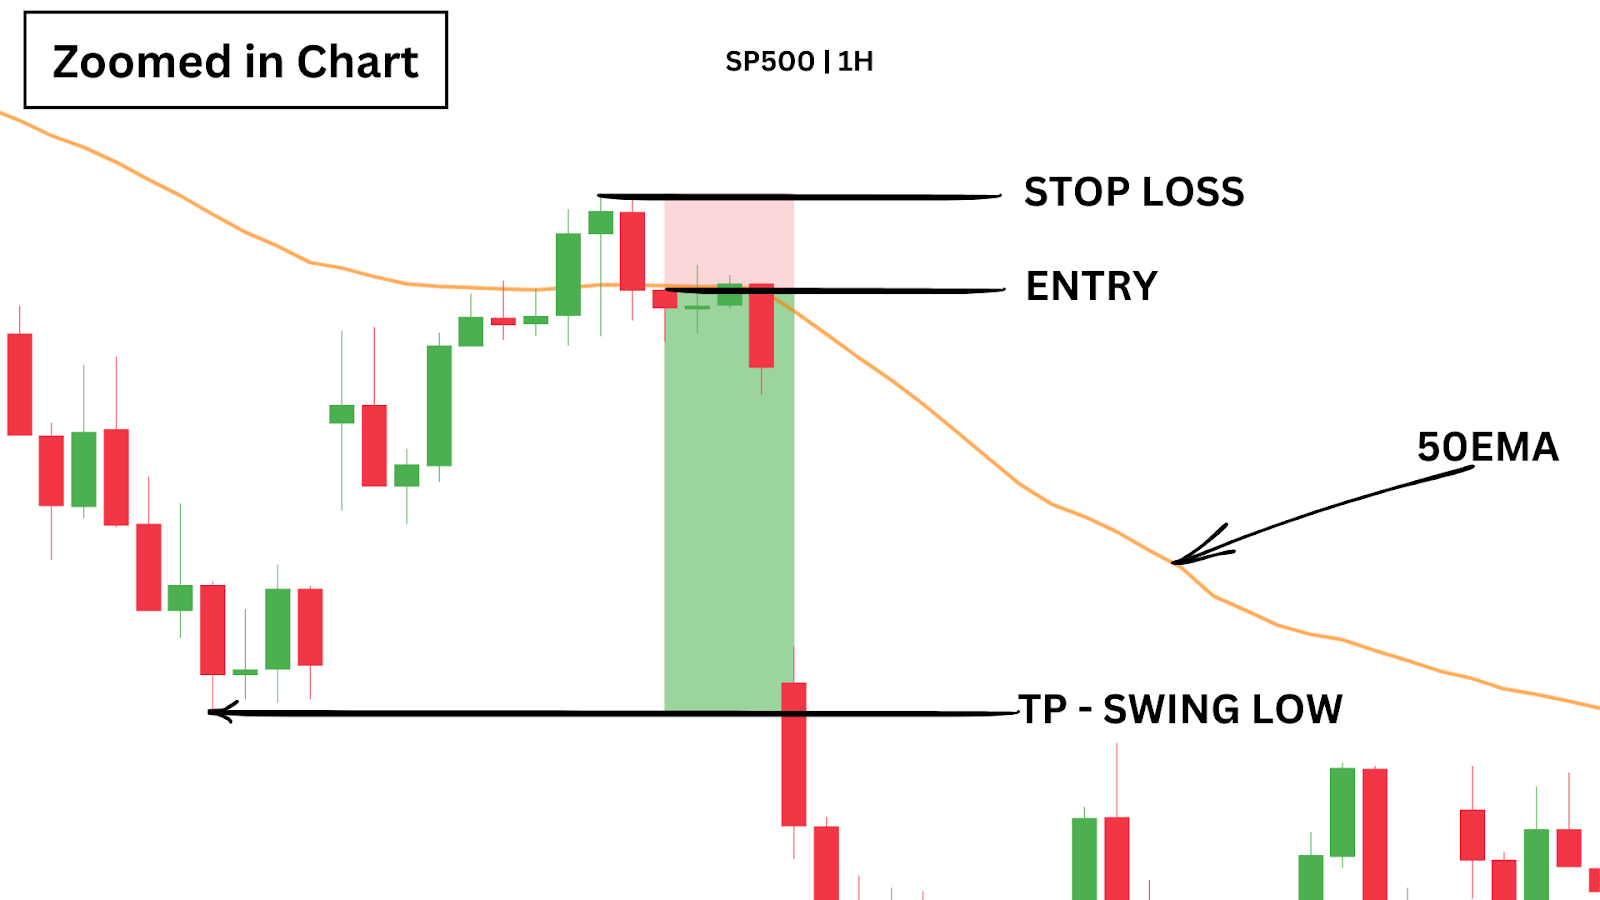
Enter a short position on the next candle’s open with a stop-loss above the high of the Hanging Man allowing for a target at the recent swing low, achieving a 4.35 RRR.
Trading Strategy Summary:
- Entry Point: Enter after a bearish confirmation candle following the Hanging Man with RSI divergence.
- Stop-Loss: Place stop-loss above the Hanging Man’s high.
- Profit Target: Target the recent swing low for a 4.35 RRR.
| PROS: Stronger signal with RSI divergence, high RRR potential in trending markets |
| CONS: Requires familiarity with RSI interpretation, less frequent setups |
Advantages and Disadvantages of Trading the Hanging Man Pattern
The Hanging Man candlestick pattern is a reliable indicator, especially in identifying potential trend reversals. However, as with any trading pattern, it comes with its own set of pros and cons.
Advantages:
- High Probability Setup: When used correctly, the Hanging Man pattern can offer strong reversal signals.
- Versatile: Works well across different timeframes and in conjunction with other indicators like RSI and EMAs.
- Easy to Spot: The distinct shape of the Hanging Man makes it easy for traders to identify in real time.
Disadvantages:
- False Signals: In choppy or range-bound markets, Hanging Man patterns can generate false signals.
- Requires Confirmation: Additional indicators or confluence points are often needed for reliable setups.
Closing Thoughts and Key Notes
The Hanging Man candlestick pattern is a powerful bearish reversal signal, especially when it appears at resistance levels or during pullbacks to significant EMAs. As a trader, it’s essential to understand the pattern’s nuances and use additional indicators to confirm its signals.
Incorporate the Hanging Man pattern into your trading strategy by combining it with technical tools like RSI and moving averages for higher accuracy. Always consider market context and apply proper risk management to avoid potential losses. Take advantage of our Max Lot Size Calculator today to improve your risk management.
FAQs
What is a Hanging Man candlestick pattern?
A Hanging Man candlestick is a bearish reversal pattern that typically appears at the top of an uptrend. It has a small body at the top of the candle range and a long lower shadow, indicating that sellers have gained control after buyers initially pushed the price up.
How is the Hanging Man different from a Hammer candlestick?
The Hanging Man and Hammer patterns look similar but have different meanings based on their position in a trend. The Hanging Man appears in an uptrend and signals a potential reversal to the downside, while the Hammer appears in a downtrend and suggests a possible reversal to the upside.
When is the Hanging Man pattern most reliable?
The Hanging Man pattern is more reliable when it appears at key resistance levels or after an extended uptrend. Additional confirmations, like high trading volume or bearish signals from other indicators (such as RSI divergence), can increase its reliability.
Can the Hanging Man pattern be used on all timeframes?
Yes, the Hanging Man pattern can appear on any timeframe. However, it tends to be more reliable on higher timeframes like daily or weekly charts, as these provide stronger market signals and reduce the chance of false positives.
What are the limitations of trading the Hanging Man pattern?
While powerful, the Hanging Man pattern can produce false signals in choppy or range-bound markets. It often requires confirmation from other indicators or price action before entering a trade, and it’s crucial to apply proper risk management to avoid potential losses
What is a Hanging Man Candlestick?
The Hanging Man candlestick is a bearish reversal pattern that signals the potential end of an uptrend. It’s characterised by a small body at the top of the candle range and a long lower shadow, often seen after a significant rally in price. Visually, it looks like a “hanging man” with its small body and extended lower wick.
Imagine a climber reaching the top of a mountain only to lose grip and dangle off the edge – that’s the visual effect of the Hanging Man pattern. It signals that although buyers initially drove prices higher, sellers gained control by the end of the session, indicating potential downward pressure.
This pattern serves as a potential warning that the upward momentum may be nearing exhaustion and that a bearish reversal could be on the horizon. Let’s see how this appears on the charts.
Examples of Hanging Man Candlestick Patterns
The reliability of a Hanging Man pattern depends on several factors, including the timeframe and market context. Higher timeframes (e.g., daily or weekly charts) generally provide stronger, more reliable signals than lower timeframes.
- Location in Trend: A Hanging Man at a resistance level within a clear uptrend is more reliable than one in choppy markets.
- Key Resistance Levels: Appearing near significant resistance levels strengthens its reversal potential.
- Extended Uptrend: A prolonged uptrend increases the likelihood of the Hanging Man indicating exhaustion in bullish momentum.
- High Volume: High trading volume during the formation signals stronger seller participation, reinforcing the bearish signal.
- Confluence with Indicators: Pairing the pattern with bearish indicators (e.g., RSI divergence) boosts reversal reliability.
- Higher Timeframes: Patterns on daily or weekly charts tend to be more reliable.
- Minimal Upper Wick: A small or absent upper wick enhances the bearish signal, showing that sellers overcame initial buying.
Now, let’s explore a real-life example of the Hanging Man pattern in action and its significance in the markets.
Case Study: SP500 Hanging Man Candlestick Pattern
On July 23, 2024, the SP500 1-hour chart displayed a classic Hanging Man pattern that signalled an impending bearish reversal.
After a rally in a broader downtrend, a hanging man appears near the EMA 50 and at a previous low, which has now flipped into resistance. This suggests a potential lower high is forming. At this stage, the reversal isn’t confirmed— it’s only when the following candle closes red, and below the EMA 50 that our confidence for a bearish reversal is boosted.
This setup demonstrates how the Hanging Man pattern, especially when supported by a bearish confirmation candle, can act as an early indicator of a trend reversal.
We’ll explore how you could have capitalised on this price action in method three.
How Do You Trade Hanging Man Candlesticks?
Trading the Hanging Man pattern can be an effective way to capitalise on trend reversals. Here, we’ll explore three different strategies that leverage the pattern’s bearish potential.
Method One – Sell at Resistance with Confirmation Candle
When trading the Hanging Man candlestick, one effective approach is to look for the pattern forming at a key resistance level and wait for a bearish confirmation candle before entering. This setup allows traders to capitalise on potential reversals at resistance, increasing the probability of a successful trade.
In our example on the BTC 1D chart from July 28, 2024, a Hanging Man pattern appeared near a strong resistance trendline. This trendline has been tested multiple times and has created bearish reactions, validating its ability to act as resistance . A large bearish candle followed the Hanging Man, confirming the reversal and signalling sellers were gaining control.
Entering the trade on the next candle with a stop-loss just above the recent swing high allowed for a clean 4:1 reward-to-risk ratio (RRR), with a profit target set at the most recent swing low.
Not only did we have a Hanging Man at resistance, but the pattern also coincided with a rising wedge formation. Rising wedges tend to reverse back to their starting point. In this case, the most recent swing low became a perfect target for the downside move.
This additional confluence between the rising wedge and the Hanging Man pattern boosted the trade’s reliability, providing a more solid foundation for entering the market.
Trading Strategy Summary:
- Entry Point: Enter after the bearish confirmation candle following the Hanging Man.
- Stop-Loss: Place stop-loss above the most recent swing high.
- Profit Target: Target the recent swing low for a 4.06 RRR.
| PROS: High RRR potential when trading at resistance, provides clear entry, stop-loss, and target |
| CONS: Requires patience for confirmation, can miss opportunities in fast-moving markets |
Method Two – Trade the Hanging Man with Bollinger Bands®
Often, after an impulsive move up or down, a consolidation would take place. It’s during these consolidation periods where traders can utilise the Bollinger Bands indicator to find potential support and resistances.
Here’s how the indicator works:
- The upper band is a resistance level during sideways consolidations.
- The lower band acts as a support level during this sideways period.
- The middle band has potential to act as a resistance level when price is below it, or a support level when price is above.
In our example on EUR/USD’s daily chart from July 10, 2018, we see an impulsive push down, followed by a consolidation/sideways period. The Bollinger Bands visually signifies this as well, when the bands begin to curve into a more horizontal, neutral state.
Remember, during a consolidation, the outer bands of the Bollinger can become reliable support and resistance. To trade the hanging man in this scenario, we’d be observing for the following:
- An initial rejection from the upper band.
- The formation of a hanging man candlestick.
- A subsequent candlestick that closes lower, which would serve as the confirmation candle & entry signal.
Placing the stop loss above the pivot high, we’re offered a reliable 2:1 reward-to-risk (RRR) trade. The fact that the pivot high was above the Bollinger Band’s top added extra confidence to the setup.
Trading Strategy Summary:
- Entry Point: Enter short after the bearish confirmation candle following the Hanging Man.
- Stop-Loss: Place stop-loss above the pivot high.
- Profit Target: Aim for a fixed 2:1 RRR.
| PROS: Strong confluence with Bollinger Band rejection, aligned with the overarching downtrend |
| CONS: Less effective in choppy or non-trending markets, can miss quick reversals if trend shifts |
Method Three – Failure at the EMAs
This method focuses on the Hanging Man pattern forming at or near a key EMA, signalling a potential failure to break through and a shift in momentum.
On July 23, 2024, the SP500 1-hour chart provided an example of this setup. After aggressively falling through the 50 EMA with a gap down, there was a weak rally back up to the EMA.
At the top of this rally, a Hanging Man candlestick pattern was formed. This alone is not enough for us to enter a short position, however, as the hanging man merely signals a slight potential for a reversal.
Fortunately, the following candle closed back below the 50 EMA, which acts as a confirmation candle of the bearish reversal idea, and that this rally was only a small pullback in the broader downtrend.
Enter a short position on the next candle’s open with a stop-loss above the high of the Hanging Man allowing for a target at the recent swing low, achieving a 4.35 RRR.
Trading Strategy Summary:
- Entry Point: Enter after a bearish confirmation candle following the Hanging Man with RSI divergence.
- Stop-Loss: Place stop-loss above the Hanging Man’s high.
- Profit Target: Target the recent swing low for a 4.35 RRR.
| PROS: Stronger signal with RSI divergence, high RRR potential in trending markets |
| CONS: Requires familiarity with RSI interpretation, less frequent setups |
Advantages and Disadvantages of Trading the Hanging Man Pattern
The Hanging Man candlestick pattern is a reliable indicator, especially in identifying potential trend reversals. However, as with any trading pattern, it comes with its own set of pros and cons.
Advantages:
- High Probability Setup: When used correctly, the Hanging Man pattern can offer strong reversal signals.
- Versatile: Works well across different timeframes and in conjunction with other indicators like RSI and EMAs.
- Easy to Spot: The distinct shape of the Hanging Man makes it easy for traders to identify in real time.
Disadvantages:
- False Signals: In choppy or range-bound markets, Hanging Man patterns can generate false signals.
- Requires Confirmation: Additional indicators or confluence points are often needed for reliable setups.
Closing Thoughts and Key Notes
The Hanging Man candlestick pattern is a powerful bearish reversal signal, especially when it appears at resistance levels or during pullbacks to significant EMAs. As a trader, it’s essential to understand the pattern’s nuances and use additional indicators to confirm its signals.
Incorporate the Hanging Man pattern into your trading strategy by combining it with technical tools like RSI and moving averages for higher accuracy. Always consider market context and apply proper risk management to avoid potential losses. Take advantage of our Max Lot Size Calculator today to improve your risk management.
FAQs
What is a Hanging Man candlestick pattern?
A Hanging Man candlestick is a bearish reversal pattern that typically appears at the top of an uptrend. It has a small body at the top of the candle range and a long lower shadow, indicating that sellers have gained control after buyers initially pushed the price up.
How is the Hanging Man different from a Hammer candlestick?
The Hanging Man and Hammer patterns look similar but have different meanings based on their position in a trend. The Hanging Man appears in an uptrend and signals a potential reversal to the downside, while the Hammer appears in a downtrend and suggests a possible reversal to the upside.
When is the Hanging Man pattern most reliable?
The Hanging Man pattern is more reliable when it appears at key resistance levels or after an extended uptrend. Additional confirmations, like high trading volume or bearish signals from other indicators (such as RSI divergence), can increase its reliability.
Can the Hanging Man pattern be used on all timeframes?
Yes, the Hanging Man pattern can appear on any timeframe. However, it tends to be more reliable on higher timeframes like daily or weekly charts, as these provide stronger market signals and reduce the chance of false positives.
What are the limitations of trading the Hanging Man pattern?
While powerful, the Hanging Man pattern can produce false signals in choppy or range-bound markets. It often requires confirmation from other indicators or price action before entering a trade, and it’s crucial to apply proper risk management to avoid potential losses