


Mastering the Inverted Hammer: A Trader’s Guide to Spotting Reversals
Want to learn how the inverted hammer candlestick can signal potential bullish reversals? This guide explains how to identify and trade this unique pattern in the markets.
Understanding candlestick patterns is crucial for traders who want to spot potential reversals and shifts. The Inverted Hammer, a powerful bullish reversal signal, can provide key insights at the end of a downtrend. Here’s what you need to know to recognise and trade it effectively.
What is an Inverted Hammer Candlestick?
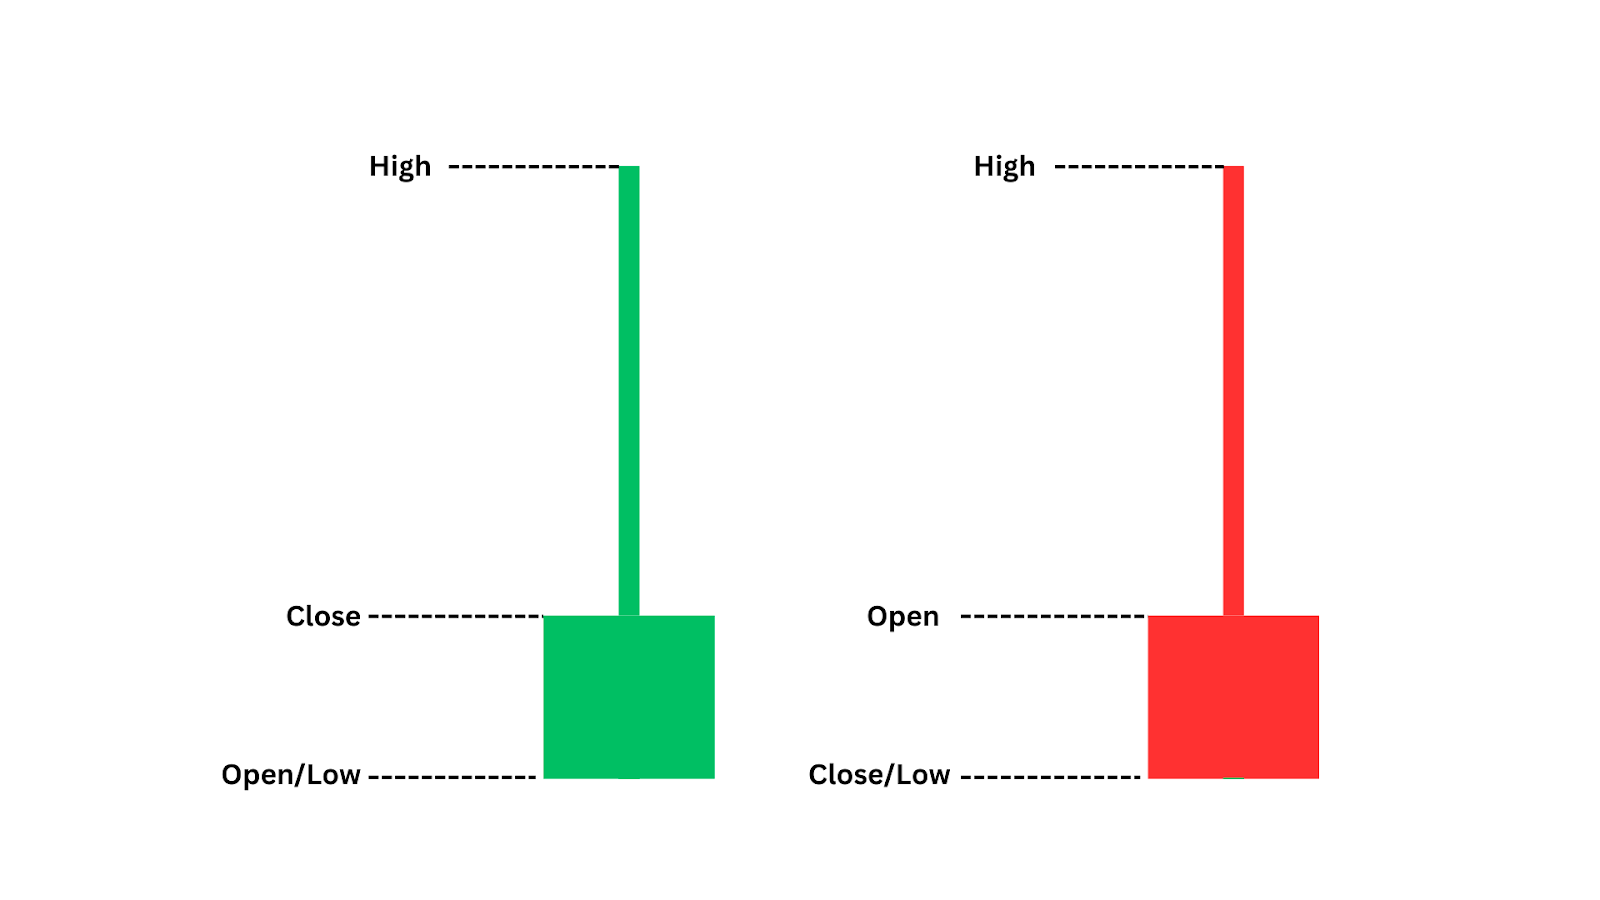
An inverted hammer candlestick is a bullish reversal pattern that typically appears at the bottom of a downtrend, signalling potential upward movement.
It has a small body at the lower end of the candle range and a long upper wick, which shows that buyers tried to push prices higher. This buying interest suggests a potential trend reversal, even in a bearish environment.
The inverted hammer reflects buyers testing higher prices, hinting at a possible shift in momentum.
Examples of Inverted Hammer Candlestick Patterns
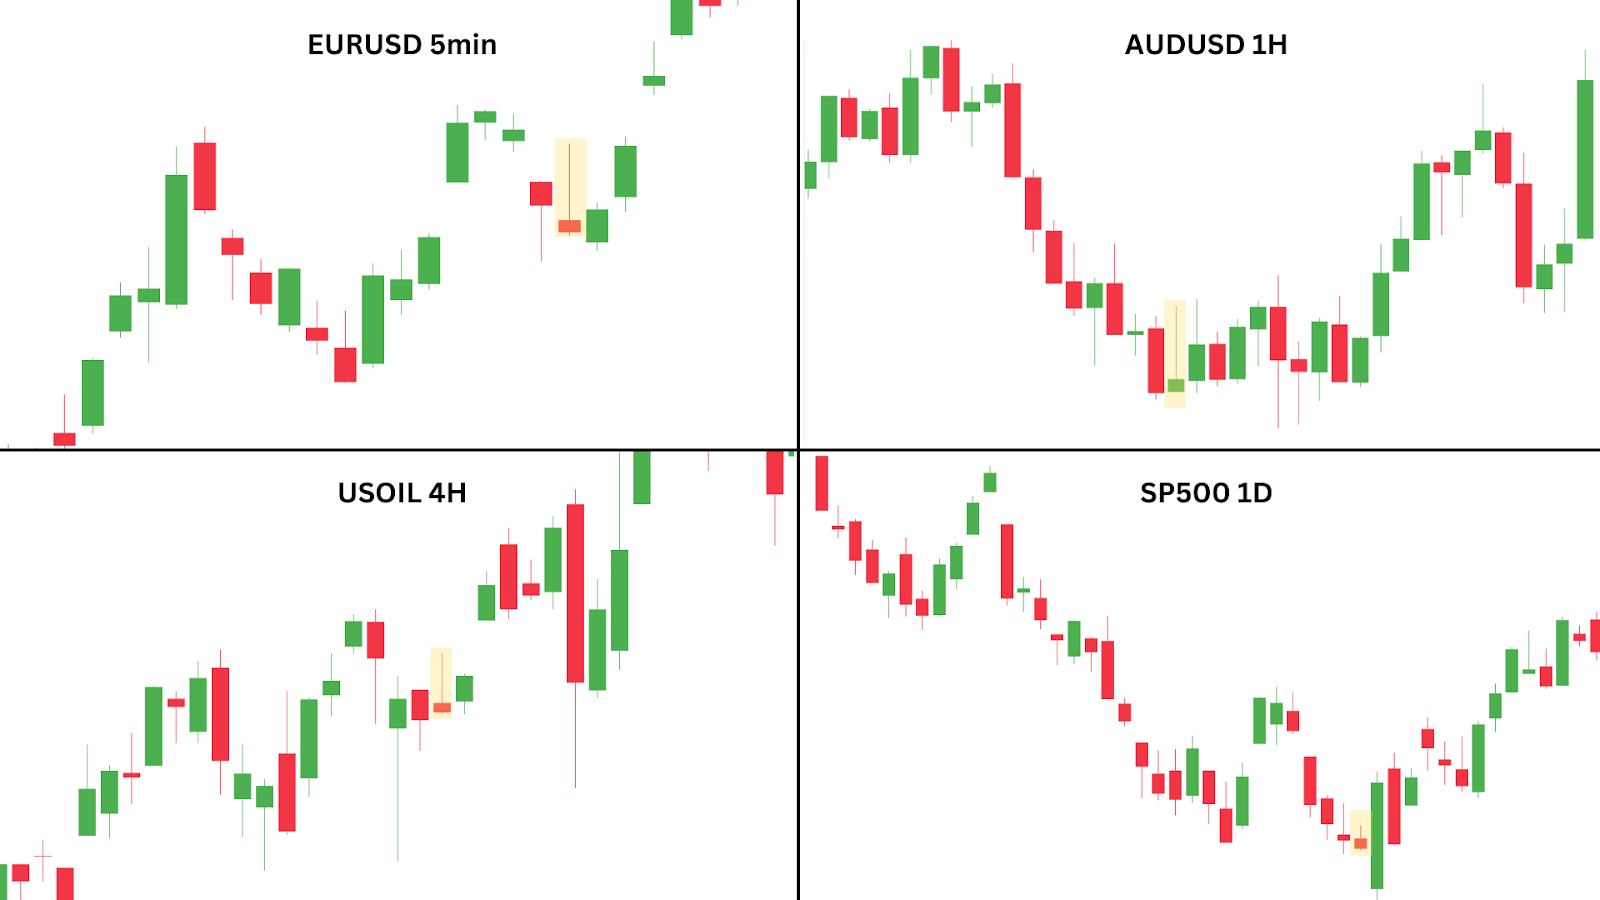
Not all inverted hammers are equally reliable. The pattern’s strength varies based on timeframe and market conditions:
- Higher Timeframes: Daily or weekly inverted hammers are more reliable than those on 15-minute or 1-hour charts.
- Market Context: Patterns near strong support levels or after a defined downtrend hold more weight than those in choppy markets.
- Additional Confirmations: Using other indicators (e.g., RSI divergence, moving average crossovers) can validate the signal.
Key characteristics that enhance the inverted hammer’s reversal potential include:
- Appears at Key Support Levels – Indicates buyers stepping in at a critical point, increasing the chances of reversal.
- Follows a Prolonged Downtrend – Signals potential exhaustion in bearish momentum, making the reversal more credible.
- High Trading Volume – Shows stronger buying interest, reinforcing the likelihood of a trend reversal.
- Confluence with Other Indicators – Aligning with bullish indicators like RSI adds credibility.
- Minimal Lower Wick – Indicates that buyers quickly pushed prices higher with little initial selling pressure.
Let’s explore a real-life example of this pattern in action to see how it can be effectively utilised in trading setups.
Case Study: SP500 Inverted Hammer Candlestick Pattern
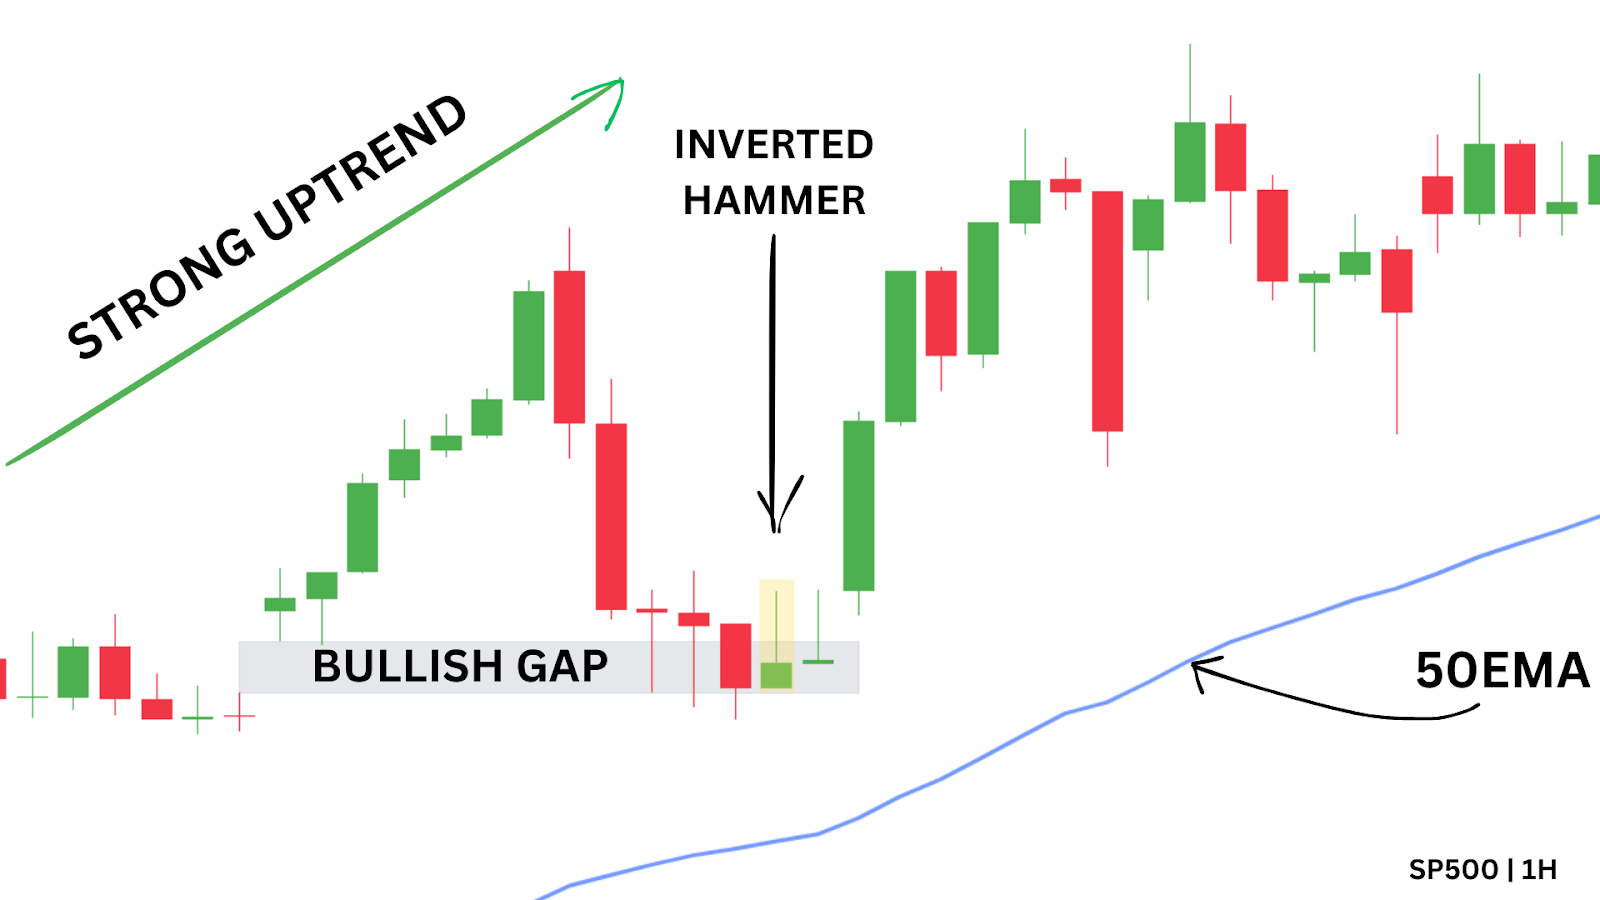
On July 11, 2024, the 1-hour SP500 chart provided an excellent example of an inverted hammer in action. After a strong bullish rally, price returned to fill a gap created by prior momentum.
During this pullback, an inverted hammer formed, followed by another smaller inverted hammer. These candlesticks indicated that buyers were testing the waters and attempting to reclaim control.
With the price positioned above the 50 EMA which was still firmly angled upwards, bullish continuation is likely. The 50 EMA could also be a great place to put stop losses, as will be discussed in trading method one.
The market then resumed its upward trajectory with a robust move, showcasing how this pattern can act as an early signal for a bullish reversal.
How Do You Trade Inverted Hammer Candlesticks?
The inverted hammer pattern offers versatile trading opportunities, especially when used with additional confluences. Here are three effective methods for trading it.
Method One: Buy at Support
One effective strategy for trading the inverted hammer is to look for it forming near a significant support level, especially when a previous resistance has flipped into support. This support is our bullish gap that was left behind by price action.
This method leverages the strength of price action combined with the confirmation provided by the pattern itself.
In our previously mentioned SP500 case study from July 11, 2024, the inverted hammer appeared during a pullback to a key support level at a bullish gap. Market gaps often act as pivotal support or resistance levels when revisited. Here, a confirmation candle – a bullish close following the inverted hammer—validated that buyers were stepping in.
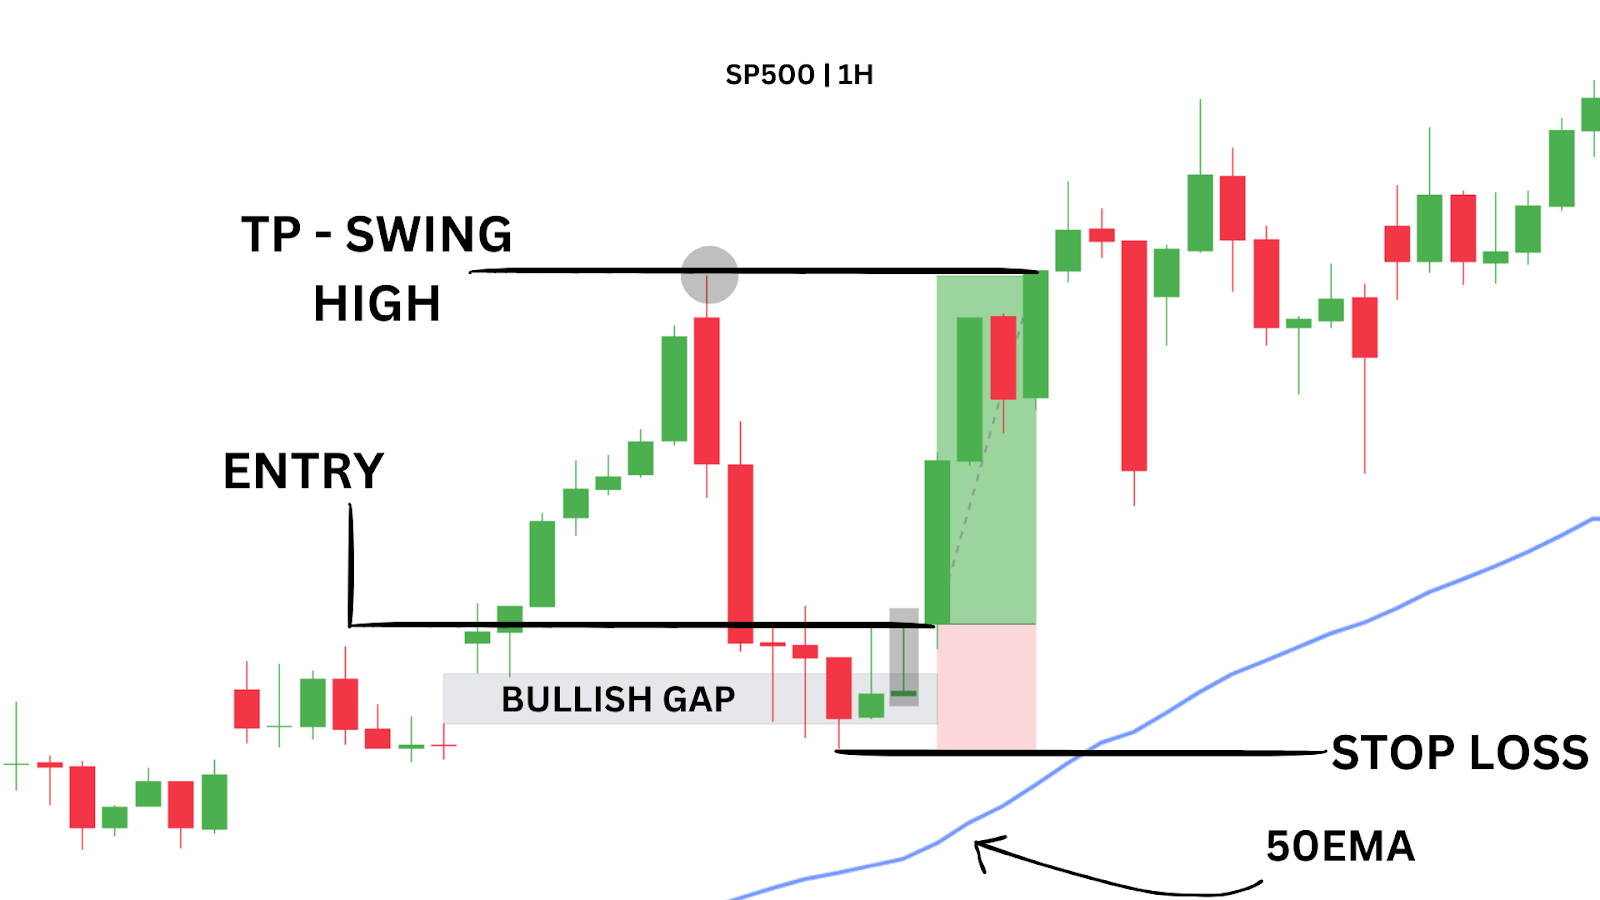
Traders can place their stop-loss below the most recent swing low (as shown in the image) or the 50 EMA for a more conservative approach, while targeting the most recent swing high for a 1:2.8 risk-to-reward ratio.
Trading Strategy Summary:
- Entry Point: Market enter after a bullish confirmation candle forms after our inverted hammer.
- Stop-Loss: Below the recent swing low or the 50 EMA for a more conservative trade.
- Profit Target: Recent swing high.
| PROS: Strong confluence with support levels, better risk management with tighter stop-losses. |
| CONS: Requires patience for confirmation, may miss opportunities in fast-moving markets. |
Method Two: Buy During a Pullback with EMA
For this method, traders wait for the price to pull back to a key EMA (e.g., 20 or 50 EMA) and look for the formation of an inverted hammer as a bullish signal. For this method to work, price must be ABOVE the EMA – this approach combines the support provided by the EMA with the bullish reversal implications of the pattern.
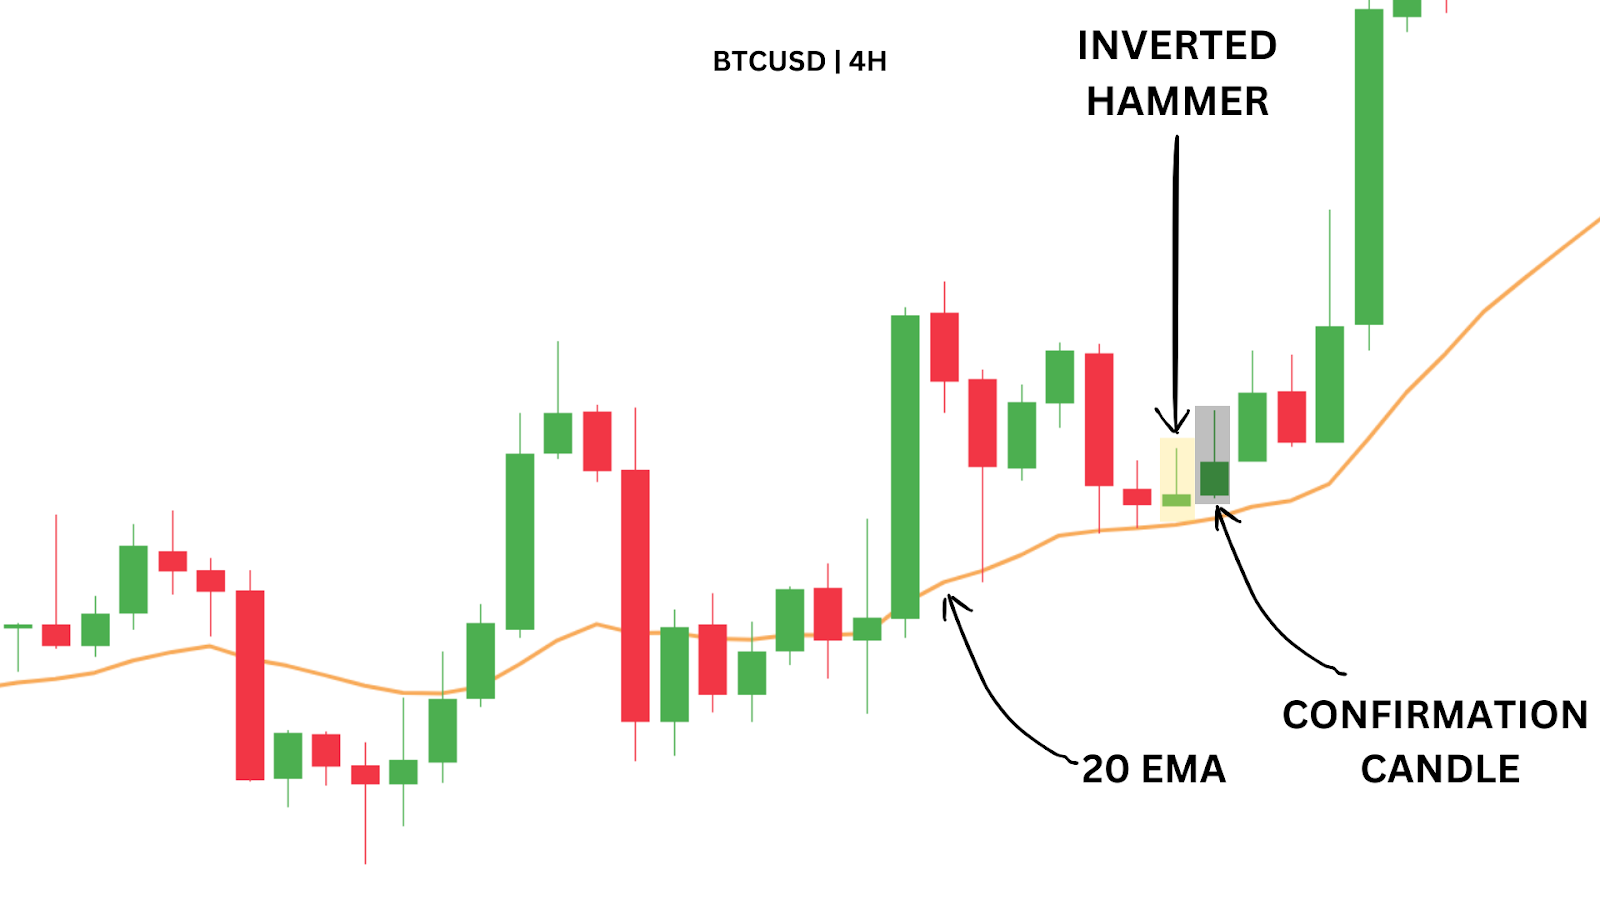
On August 23, 2024, the 4-hour Bitcoin chart showed an inverted hammer forming at the 20 EMA, which had recently flipped into support.
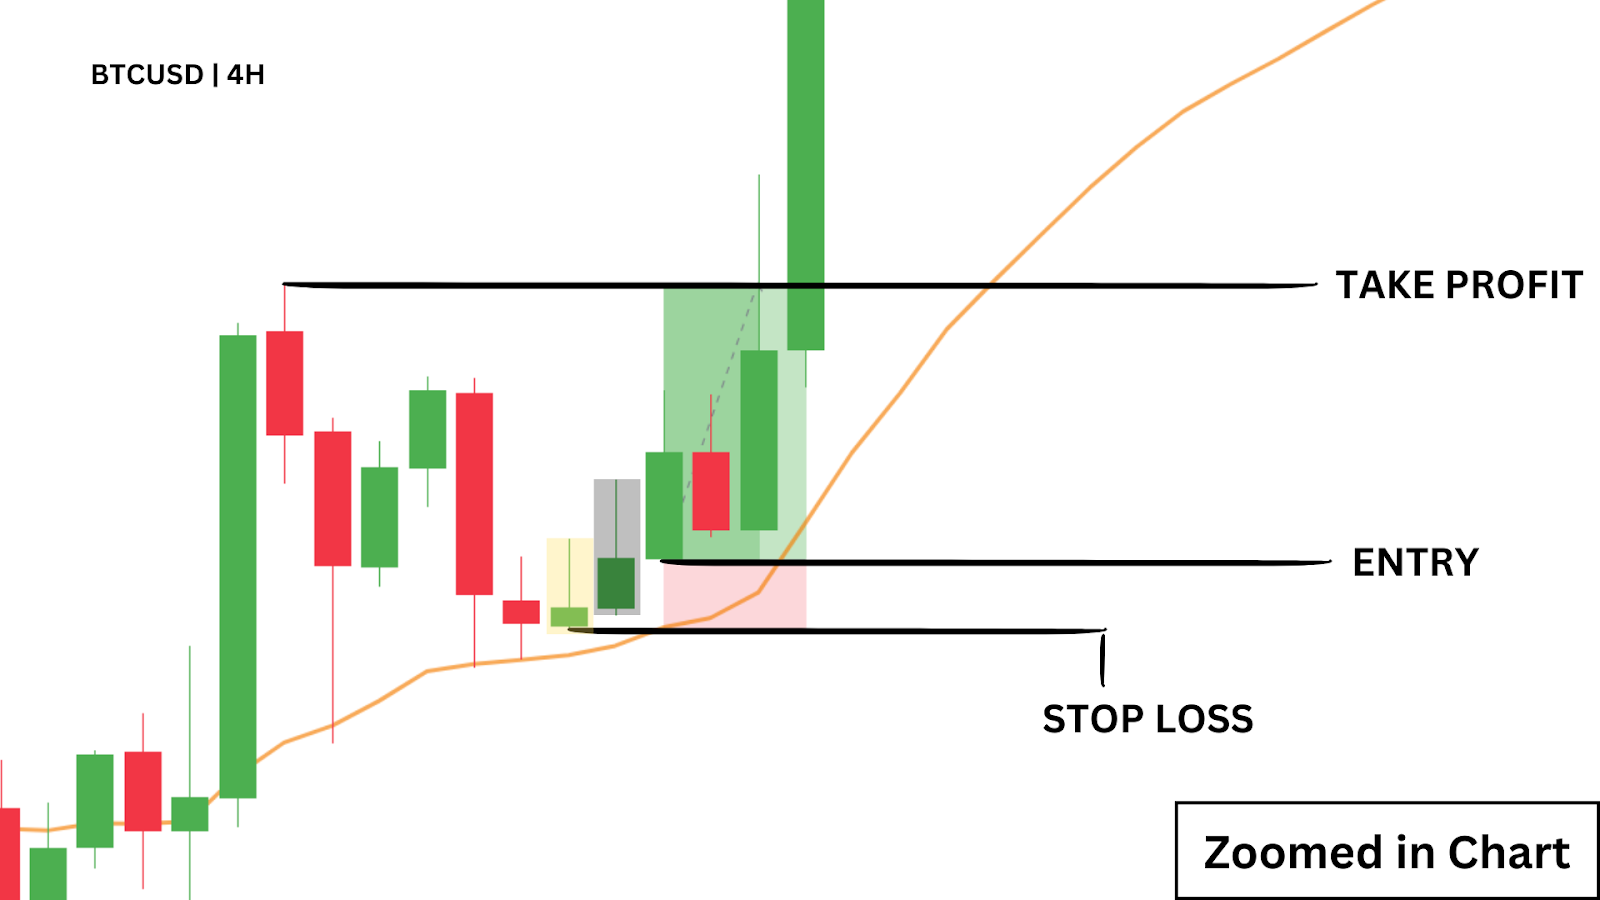
After a bullish confirmation candle followed, traders could enter the market, set a stop-loss just below the inverted hammer’s low, and target the most recent swing high for a 1:4 risk-to-reward ratio trade.
Trading Strategy Summary:
- Entry Point: Enter after a bullish confirmation candle following the inverted hammer.
- Stop-Loss: Below the inverted hammer’s low.
- Profit Target: Recent swing high.
| PROS: High-probability setups when combined with EMA support, effective in trending markets. |
| CONS: Relies on EMA support, which may not always hold in choppy markets. |
Method Three: Inverted Hammer with Bullish RSI Divergence
Combining the inverted hammer pattern with RSI divergence can strengthen the reversal signal.
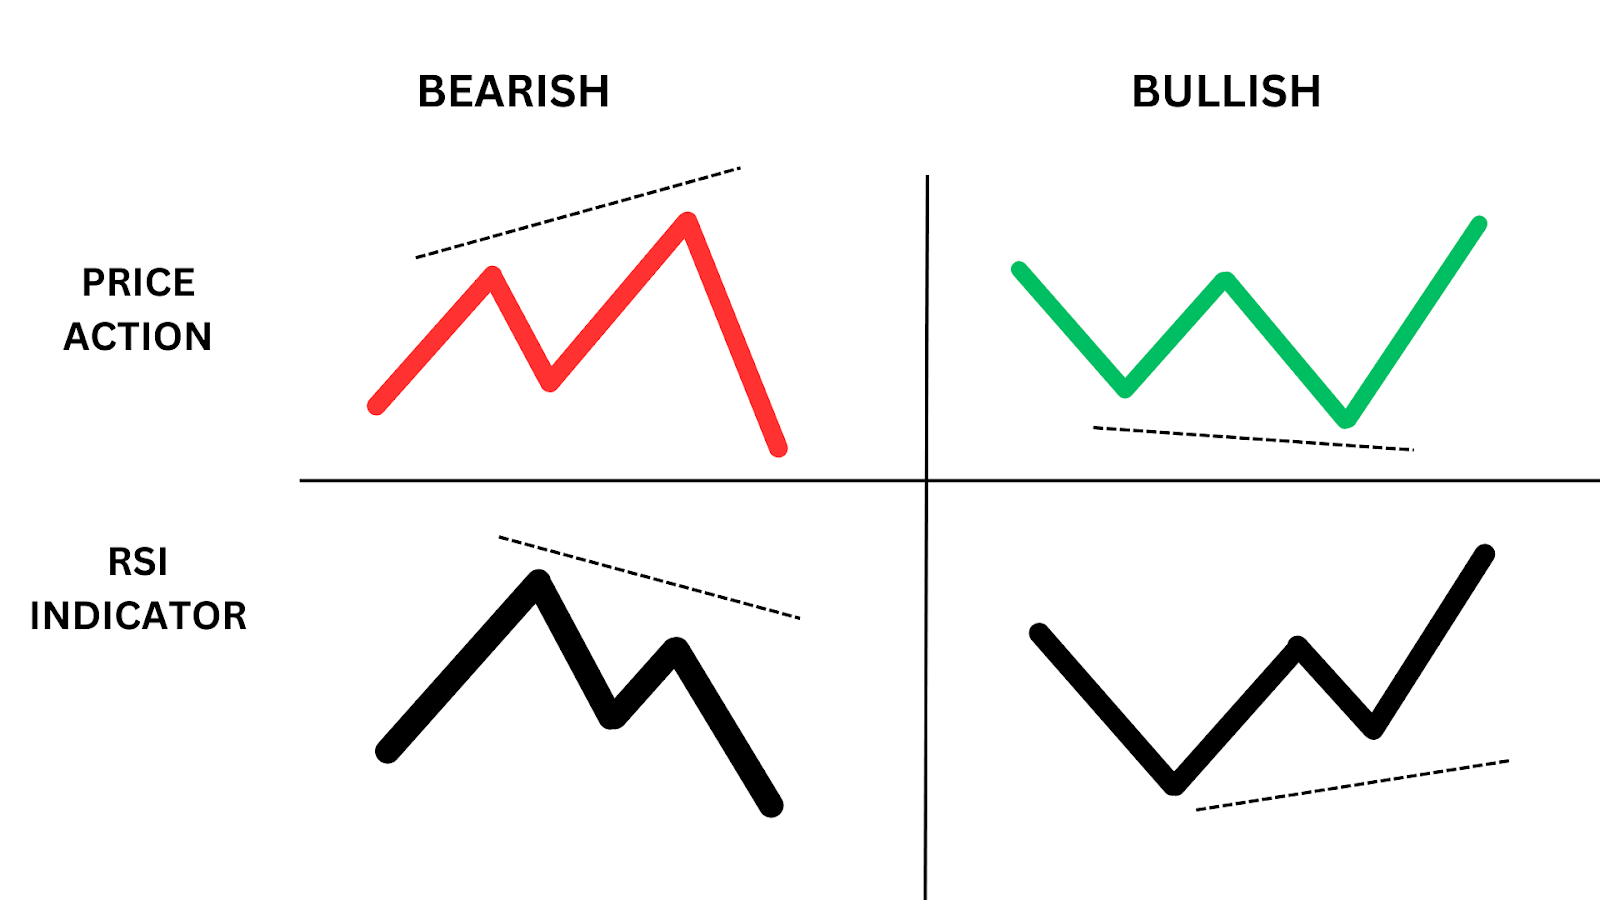
RSI divergence occurs when the price makes a new low, but the RSI fails to do the same, indicating weakening bearish momentum.
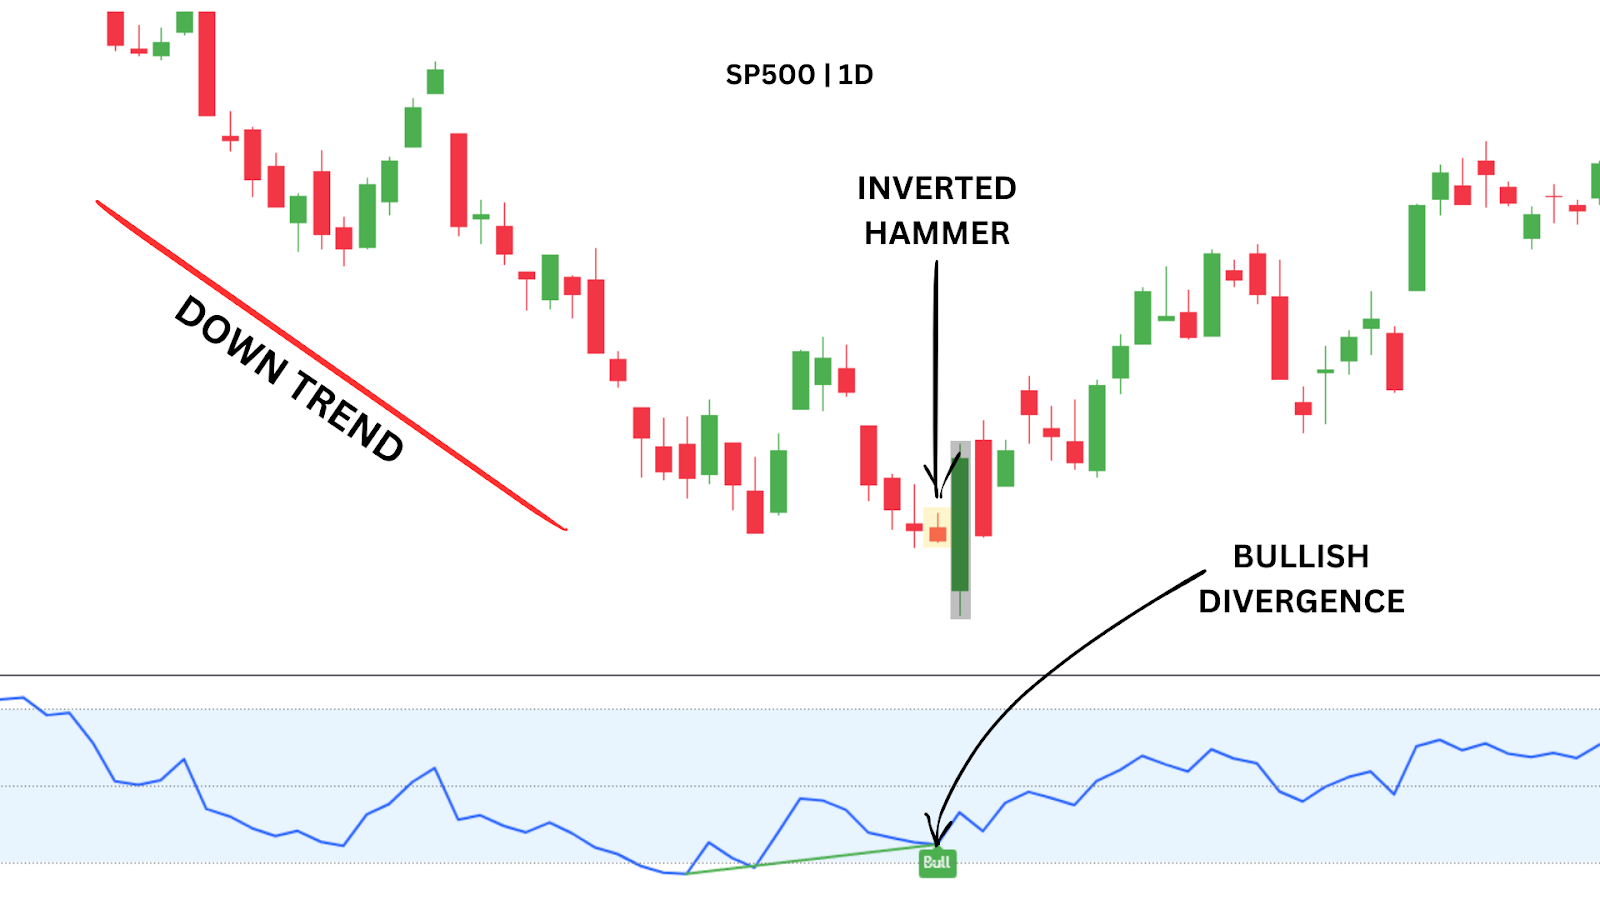
On October 12, 2022, the SP500 daily chart featured bullish RSI divergence along with an inverted hammer at the bottom of a downtrend.
This combination was confirmed by a subsequent bullish engulfing candle, providing a confirmation of a strong incoming bullish reversal. Here in our example, since the bullish engulfing candle was such an impulsive move, it’s likely that price would experience some sort of a retracement.
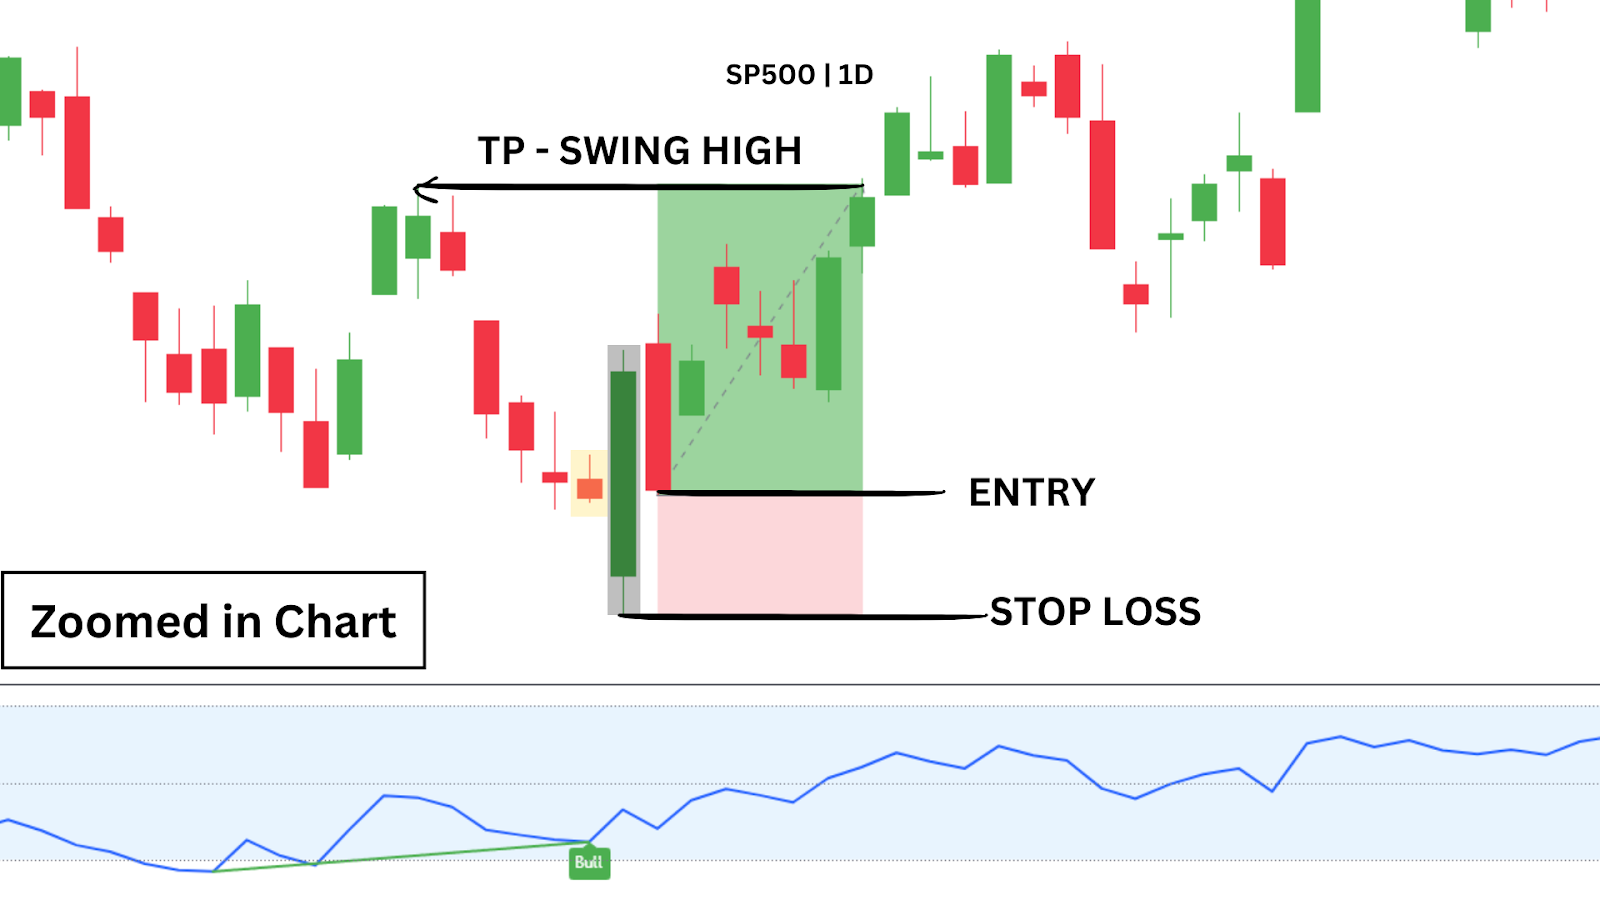
Notice how the retracement does not close under the closing price of the inverted hammer, which allows us to enter a comfortable trade with 1.27 reward-to-risk ratio.
Trading Strategy Summary:
- Entry Point: Market enter after a confirmation candle has followed our inverted hammer, which in this case was our bullish engulfing candlestick. You can choose to wait for a retracement or directly enter.
- Stop-Loss: Below the recent low.
- Profit Target: Recent swing high.
| PROS: Provides additional confirmation through RSI, reducing false signals, reliable high-probability setups. |
| CONS: Requires understanding of RSI analysis, setups can be less frequent. |
Advantages and Disadvantages of Trading the Inverted Hammer Pattern
The inverted hammer candlestick pattern is a valuable tool for traders, especially when identifying potential bullish reversals. However, like any trading pattern, it has its strengths and limitations. Here’s a breakdown of what makes this pattern useful – and where it can fall short.
Advantages:
- High Probability Reversal Signal: When it appears in the right context, such as near a key support level after a prolonged downtrend, the inverted hammer can serve as a reliable signal for a potential bullish reversal.
- Versatility Across Timeframes: The inverted hammer pattern works well on various timeframes, from intraday charts to weekly and monthly charts, making it accessible for both short-term and long-term traders.
- Clear Visual Pattern: With its unique shape—a small body with a long upper shadow and little to no lower wick—the inverted hammer is easy for traders to spot on the charts, even for beginners.
Disadvantages:
- Prone to False Signals in Choppy Markets: In markets that lack a clear trend, the inverted hammer can produce misleading signals, leading to potential losses if not confirmed by other indicators.
- Requires Additional Confirmation: While it can indicate a potential reversal, the inverted hammer pattern often needs confirmation from other indicators, such as volume, RSI divergence, or EMAs, to improve accuracy and avoid premature entries.
Closing Thoughts and Key Notes
The inverted hammer candlestick pattern is a powerful tool for identifying potential bullish reversals, especially when it appears after a sustained downtrend or at a key support level. Its unique shape—a small body with a long upper shadow – signals that buyers are attempting to push prices higher, hinting at a possible shift in market sentiment.
While the inverted hammer is an effective pattern, it’s most reliable when combined with additional indicators, like RSI, moving averages, or support levels, to confirm the trend reversal. Practising good risk management, such as setting appropriate stop-loss levels, will further enhance the effectiveness of this pattern. Take advantage of our Max Lot Size Calculator today to improve your risk management.
Get Funded with FXIFY Today
At FXIFY™, we believe in empowering traders with the capital and resources they need to succeed. With our variety of evaluation phases and funding levels, you have the opportunity to access up to $400K in starting capital. Our performance splits go up to 90%, and we offer flexible add-ons to support your trading journey.
Join FXIFY™ today and put your trading knowledge to work with a funded account. Start with a challenge, prove your skills, and get instant access to your gains on demand—no delays, no hidden terms.
Trade smart. Trade with FXIFY.
FAQs
What is the Difference Between an Inverted Hammer and a Shooting Star?
The inverted hammer is a bullish reversal pattern that appears after a downtrend, while the shooting star is a bearish reversal pattern that appears after an uptrend. Both patterns have similar shapes but serve opposite functions based on their position within the trend.
Can the Inverted Hammer Pattern be Used on All Timeframes?
Yes, the inverted hammer pattern can be used across various timeframes, but it’s generally more reliable on higher timeframes like daily or weekly charts. Lower timeframes may produce more false signals due to market noise.
How Do I Confirm an Inverted Hammer Pattern?
Look for additional confirmation from other indicators or technical analysis tools. For example, a nearby support level, volume increase, or bullish indicators like RSI divergence can help confirm the pattern and improve its reliability.
Is the Inverted Hammer Pattern Reliable on Its Own?
While it can provide a strong reversal signal, the inverted hammer is best used with other forms of technical analysis to improve accuracy. Confirmation from indicators like moving averages, volume, or support levels can strengthen the signal and reduce the likelihood of false entries.
What Are Common Mistakes When Trading the Inverted Hammer Pattern?
Common mistakes include trading the pattern in isolation without confirmation, ignoring market context, and using it in choppy or range-bound markets where false signals are more likely. To enhance accuracy, always look for confluence with other indicators and set appropriate stop-loss levels.