


MACD Indicator Guide: How to Detect Trends and Divergences
Master MACD for trend and divergence trading. Learn how prop traders use this powerful indicator for timing, entries, and exits.
Introduction
The MACD indicator—short for Moving Average Convergence Divergence (MACD)—is a cornerstone of modern technical analysis. By comparing two exponential moving averages and visualising their relationship, it lets many traders gauge momentum, spot trend direction, and anticipate potential reversals.
For funded prop traders at FXIFY, where timing and draw-down control are paramount, mastering MACD can be the difference between a clean equity curve and an avoidable loss. In this guide, you’ll discover how MACD works, the best settings for different strategies, and actionable tactics for trading trends and divergences—while staying within FXIFY’s flexible rules.
What Is MACD and How Does It Work?
The Basics of MACD
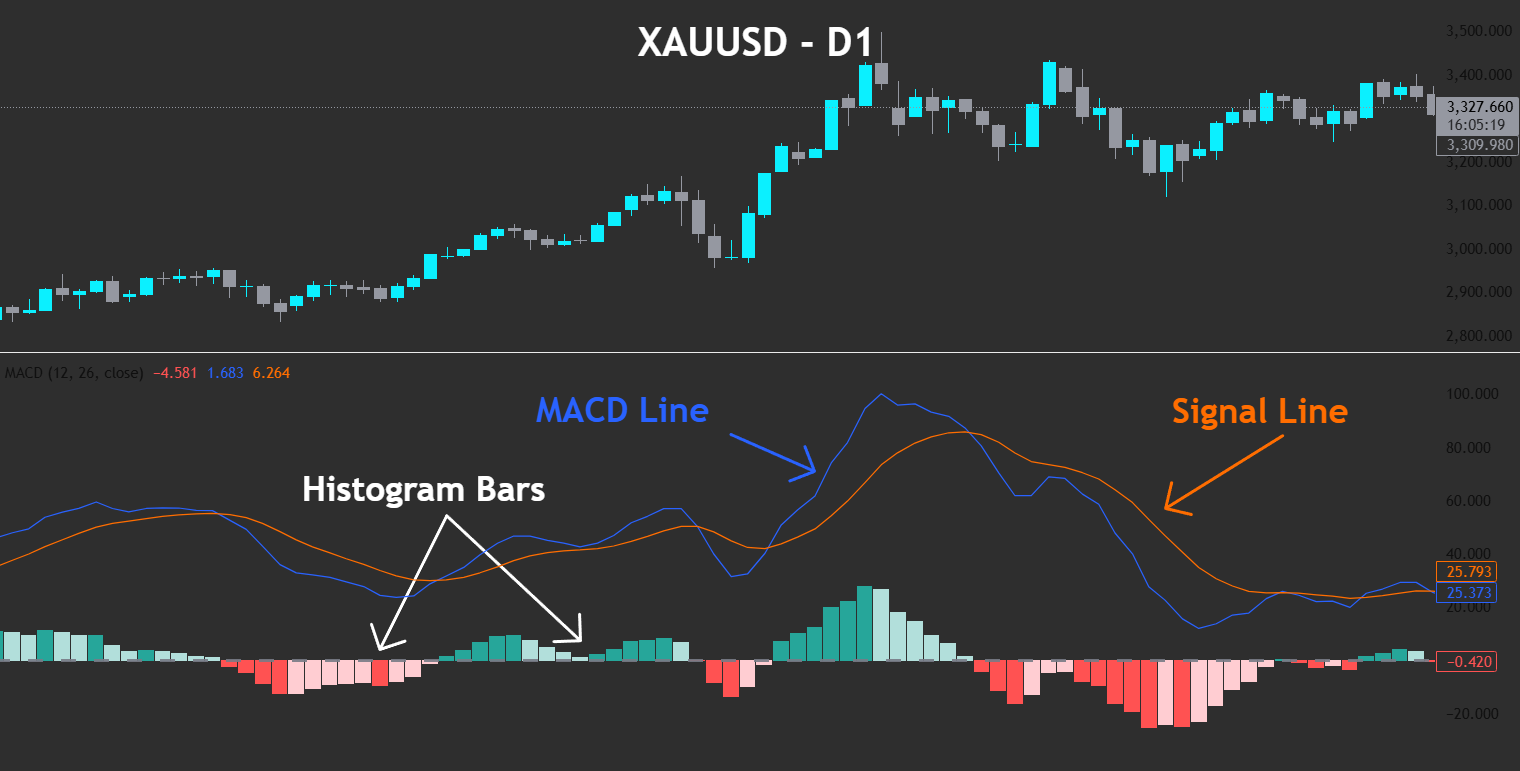
- MACD Line (blue line) – the difference between the 12-period and 26-period exponential moving averages (EMAs) of closing prices.
- Signal Line (red line) – a 9-period EMA of the MACD Line.
- Histogram – bars that plot the difference between the MACD Line and the Signal Line, rising above the zero line when upside momentum increases and falling below it when downside momentum builds.
The diagram below uses idealised, synthetic price data so each MACD component is crystal-clear; real-world charts rarely look this neat.
The MACD indicator oscillates above and below a zero line, providing a quick visual of bullish versus bearish momentum. When the MACD Line crosses above the Signal Line, the histogram prints a positive value, hinting at growing upside momentum; the opposite crossover occurs when momentum turns bearish.
Why MACD Matters for Traders
MACD summarises price action into three simple visuals. A single glance tells you:
- Whether momentum aligns with prevailing price trends.
- How strong—or-weak—current moves are, thanks to MACD histogram height.
- When momentum shifts, allowing early warnings before price structure breaks.
For prop traders, these insights translate into well-timed entries, exits, and fewer false signals—crucial when daily drawdown and payout schedules are on the line.
MACD Settings Explained: Standard vs Custom
Default MACD Settings (12, 26, 9)
Most platforms ship with 12-26-9 because:
- 12 and 26 EMAs capture monthly and half-monthly cycles on the daily chart.
- A 9-period EMA of the MACD Line smooths noise without excessive lag.
- The combination balances responsiveness and reliability—ideal for an average convergence divergence MACD approach.
When to Customise MACD
| Trading Style | Suggested Settings | Rationale |
| Scalping / Fast Day Trades | 6-13-5 | Faster EMAs capture swift price movement. |
| Intraday Trend Trading | 8-21-9 | Balances speed and noise on high-volume assets. |
| Swing / Position Trading | 24-52-9 | Filters intraday whipsaws, focuses on primary trend. |
Customising MACD lets you sync the indicator with session volatility and FXIFY’s tailored account types. Traders on Raw spreads may prefer shorter settings to exploit tight pricing, while those on All-In feeds favour longer settings that match broader swings.
The Classic 12-26-9 Strategy in Action
Traders often ask, “Is the standard 12-26-9 combination still valid in 2025?”
The answer is yes—provided you understand its rhythm. Because the 12-period exponential moving average reacts nearly twice as fast as the 26-period EMA, their difference (the MACD Line) highlights shifts pure price-watching can miss.
When the MACD Line crosses above the Signal Line and the crossover happens above the zero line, momentum and trend are stacked in your favour. Conversely, a bearish crossover above zero can be an early warning that upside momentum is fading.

MACD for Trend Trading
Spotting Trend Direction with MACD Line and Signal Line
A bullish crossover appears when the blue MACD Line crosses above the red Signal Line. It’s a bullish signal indicating upward momentum, especially if the crossover starts below the zero line and drives through it. Conversely, a bearish crossover suggests downside momentum.
Confirming Trends with the MACD Histogram
Think of the histogram as a visual amplifier:
- Rising green bars above zero = upside momentum building.
- Deepening red bars below zero = bearish signal accelerating.
- Flattening bars warn that momentum is fading even if price keeps climbing.
Entry and Exit Tactics for Trend Trading
- Identify the crossover aligned with the larger trend on your price chart.
- Confirm with structure—higher-highs for longs, lower-lows for shorts.
- Place a stop beyond the last structural swing (optional at FXIFY but wise).
- Exit when the histogram contracts sharply or an opposite crossover forms.
Use FXIFY dashboard alerts to catch signal line crosses even during busy news.
MACD Divergence Trading Strategy
What Is Divergence in MACD?
Divergence occurs when price moves in one direction but MACD fails to follow, signalling a mismatch between momentum and price action. This disagreement can hint that the current trend is weakening—often ahead of a potential reversal or pullback.
There are two main types of divergence:
- Regular Divergence – Signals a possible trend reversal.
- Hidden Divergence – Suggests a trend continuation.
MACD divergence can appear:
- In the MACD histogram (earlier but less reliable)
- Or in the MACD Line itself (slightly delayed but more trustworthy)
Types of Divergence (Cheatsheet)
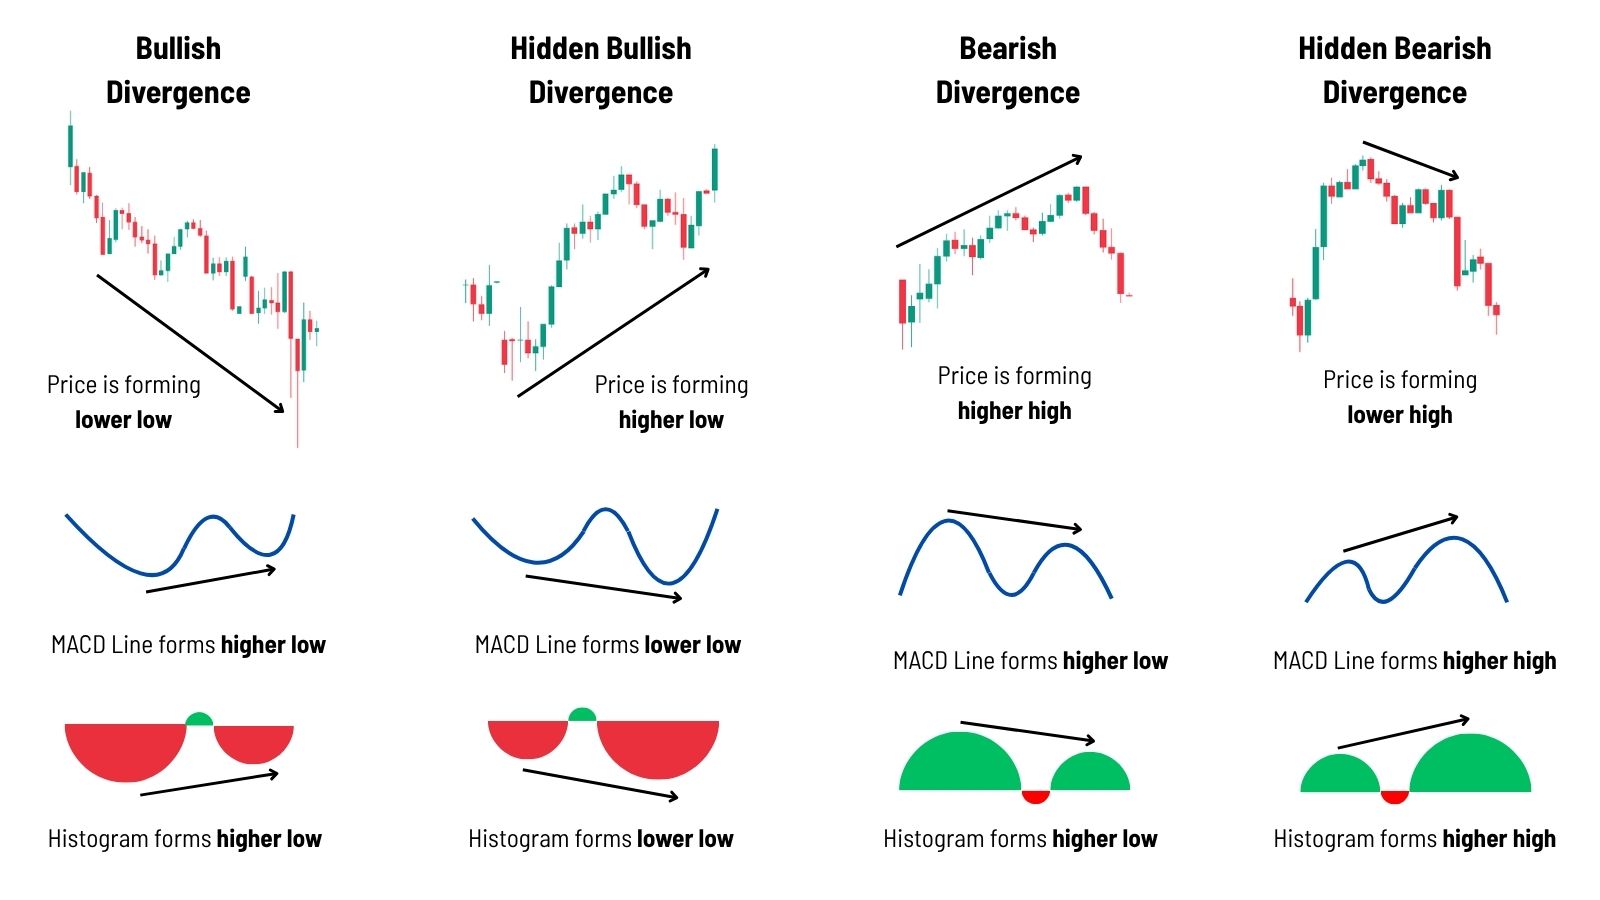
Regular Bullish Divergence
- Price makes: Lower lows
- MACD fails to confirm: No lower low
- What it means: Downtrend momentum is fading — watch for a bullish reversal.
Regular Bearish Divergence
- Price makes: Higher highs
- MACD fails to confirm: No higher high
- What it means: Uptrend is losing steam — a bearish reversal may follow.
Hidden Bullish Divergence
- Price makes: Higher lows
- MACD fails to confirm: No higher low
- What it means: Hidden signal the uptrend may continue — watch for bullish continuation setups.
Hidden Bearish Divergence
- Price makes: Lower highs
- MACD fails to confirm: No lower high
- What it means: Bearish continuation signal — trend likely to resume downward.
How to Trade MACD Divergences
Divergences can show up in two places within the MACD indicator: the histogram and the MACD Line. Both reflect a disagreement between price action and momentum—but each carries a different weight and timing.
| Source | Signal Timing | Reliability | Usage Tip |
|---|---|---|---|
| Histogram | Early | Less reliable | Use as an initial heads-up; requires confirmation |
| MACD Line | Slightly delayed | More reliable | Best used with structure breaks or candle patterns |
| Signal Line | ❌ Not used | — | Irrelevant for divergence setups |
💡 You do not need MACD to form exact lower lows or higher highs like price does. Divergence occurs simply when MACD fails to follow price structure — that’s the signal.
Step-by-Step Setup:
- Spot the divergence on your chart — price makes a new high/low while the MACD histogram or line does not.
- Zoom out to check if you’re in a late-stage trend or near key structure (support/resistance).
- Wait for confirmation — e.g. bullish engulfing candle, pin bar, or trendline break.
- Enter once confirmation appears. For bullish setups: above the confirming candle. For bearish: below.
- Stop-loss beyond the invalidation level (the recent swing point).
- Exit when:
- The histogram flips through the zero line, or
- A new opposite divergence forms.
Divergence setups work best on H4 and D1, where market noise is reduced and institutional order flow is clearer.
Quick MACD Strategy Examples
Example 1: Bearish Continuation Trade on USDJPY (D1)
The chart below shows USDJPY on the daily timeframe. Price pushes into overbought territory, then prints a MACD bearish crossover that lines up with RSI > 70. This confluence triggers a short
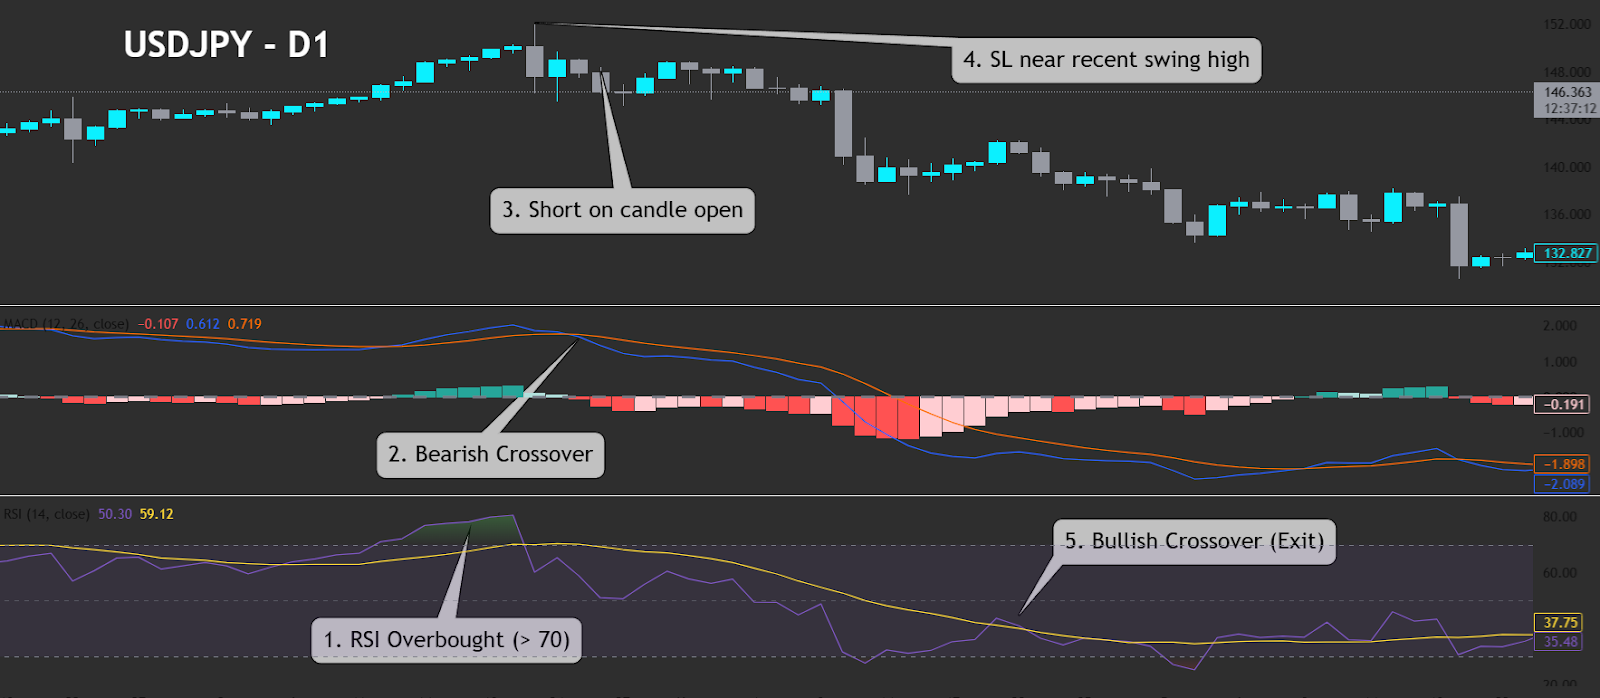
| Conditions | Explanation |
|---|---|
| 1. RSI > 70 | Price rallied into overbought territory. |
| 2. MACD bearish crossover | MACD Line dipped below Signal Line; histogram flipped negative. |
| 3. Short on candle open | Entry taken at candle open post-crossover. |
| 4. Stop-loss above recent swing-high | SL beyond prior top. |
| 5. MACD bullish crossover (exit) | MACD crossed back up. |
Example 2: Regular Bullish Divergence on XAUUSD (H1)
The chart below highlights a regular bullish divergence where price prints lower lows while the MACD prints higher lows. Such a mismatch often warns that bearish momentum is fading and a bounce is possible.
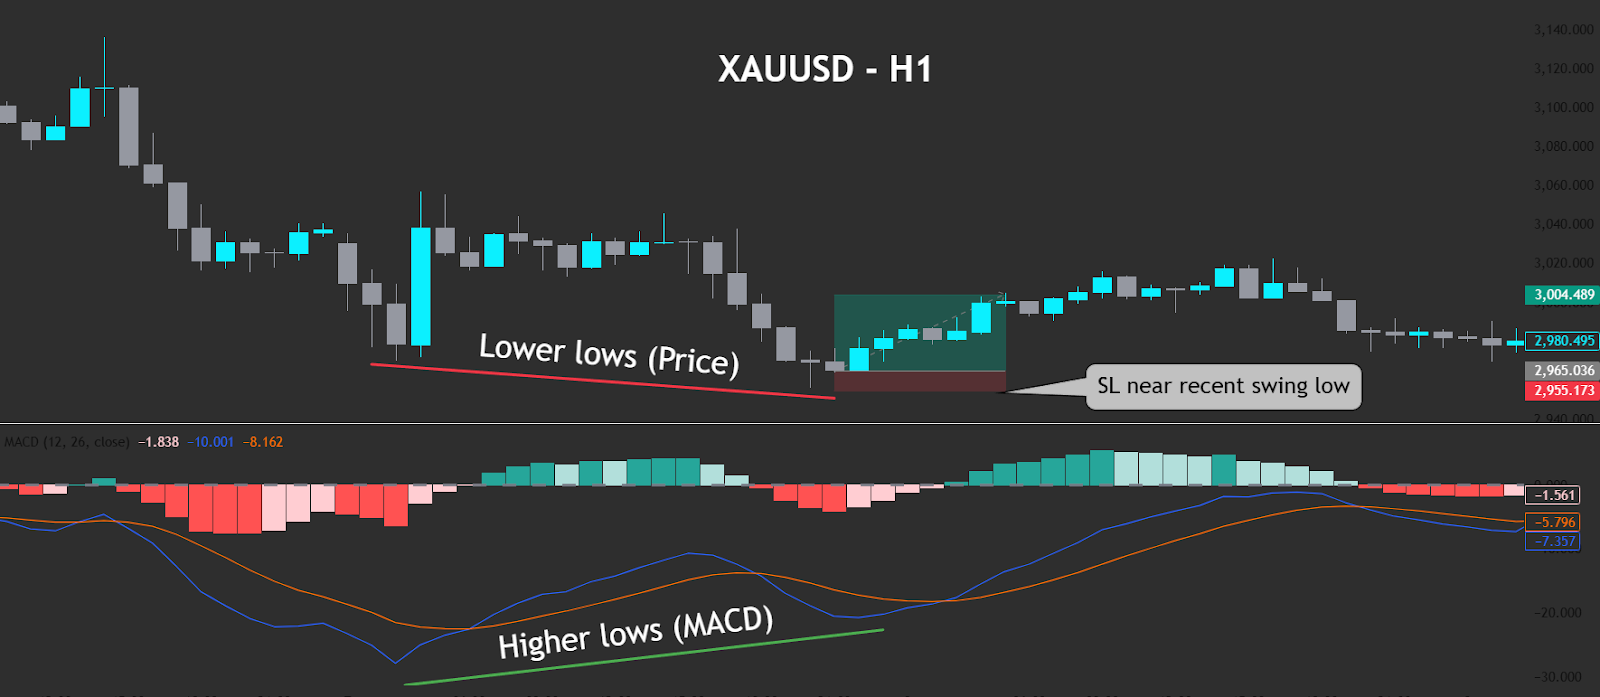
| Step | Explanation |
|---|---|
| 1. Price forms lower low | Price goes lower. |
| 2. Higher lows in MACD | Momentum is increasing. |
| 3. Potential long zone | Price bases and forms bullish candle. |
| 4. Stop-loss near recent swing-low | SL below divergence low. |
| 5. Managing the trade | Scale out, trail, or exit at structure. |
Timeframes and Market Conditions
Ideal Timeframes for MACD
- H1–H4 – quick but meaningful swings; perfect for intraday funded accounts.
- D1 + – clearer divergences and trend context for swing traders.
Trending vs Ranging Markets
| Market Condition | Crossover Strategy | Divergence Strategy |
| Strong Trend | High-probability crossovers; ride momentum until histogram peaks. | Low probability—momentum confirms trend. |
| Late-Stage Trend | Weaker crossovers; watch for false signals. | Bearish divergence occurs in up-trends, bullish divergence occurs in down-trends. |
| Sideways Range | Crossovers produce many false triggers. | Divergence near extremes can highlight breakout traps. |
MACD in Prop Trading Environments
The MACD is a versatile indicator that can work well for prop traders—if their strategy fits within drawdown limits. Its signals often need wider stop losses by default, so demo trading is a smart first step.
Use that to figure out your risk sizing (based on your account size) before going live.
Why MACD Works for Prop Traders
The MACD gives prop traders a rule-based way to spot breakout moves and potential reversals, making it a useful tool for planning both entries and exits.
- Objective entry and exit points minimise emotional trades.
- No mandatory stop-loss fits FXIFY’s no-SL policy while still offering visual risk cues.
- Alerts support tight daily drawdown management.
Practical Use with FXIFY
- Use the Economic Calendar to find news with higher volatility — increases chance of a breakout or reversal.
- Shorter MACD length settings thrive on Raw spreads, where scalping conditions are excellent.
- Unlimited trading days let hidden divergence on daily charts mature without stress.
- Explore FXIFY programs to align MACD style with tailored capital.
Common MACD Mistakes to Avoid
The MACD can be powerful, but it’s also easy to misuse—especially if you treat every crossover like a green light. Here are some common slip-ups that trip traders up:
- Trading every crossover without broader market sentiment checks.
- Ignoring the zero line—above-zero bullish signals differ from below-zero.
- Using MACD alone in overbought or oversold conditions.
- Failing to tweak MACD settings by timeframe or asset liquidity.
Tips for Better MACD Performance
To get more out of your MACD setups, it helps to combine it with other tools and context. These tips can help sharpen your entries and avoid false signals:
- Always confirm with other technical indicators such as RSI or Bollinger Bands.
- Focus on crossovers aligned with higher-timeframe momentum.
- Overlay a period EMA (e.g., 50-EMA) to filter counter-trend trades.
- Check macro news via Trading Central to sidestep data-driven whipsaws.
- Journal MACD trades in FXIFY’s dashboard to refine your MACD trading strategy.
Frequently Asked Questions
What does the MACD tell you?
It shows whether upside or downside momentum dominates, highlights trend strength, and flags potential reversals when momentum diverges from price.
How do you use MACD for beginners?
Start with 12-26-9, trade crossovers that match the higher-timeframe trend, and confirm with basic structure.
Which is better, MACD or RSI?
They complement each other. While the MACD is excellent for momentum and the RSI is great for spotting over-extended prices, their true power is unlocked when used together.
In fact, using a dedicated MACD and RSI divergence strategy is one of the best ways to confirm high-probability reversals and reduce false signals.
What is a good MACD value?
There’s no universal “good” figure—focus on crossovers, histogram expansion, and position relative to the zero line.
Is the MACD 12-26-9 strategy profitable?
Yes—when combined with sound risk management, higher-timeframe confluence, and disciplined execution.
Final Thoughts on MACD & Funded Trading
Mastering MACD gives funded traders a systematic lens for reading momentum—critical when capital and payouts depend on disciplined execution. Whether you prefer rapid line crossovers on intraday charts or patient divergence setups on swing timeframes, MACD fits any FXIFY program. Dive deeper with our guides on multi-timeframe trade planning and prop-firm risk management.
Conclusion
The MACD indicator distils complex market moves into two lines and a histogram, offering clear trend and divergence signals for disciplined traders. By customising settings, combining MACD with broader technical analysis, and applying the tactics in this guide, you can trade with greater confidence—especially inside.
FXIFY’s trader-first ecosystem. Ready to put MACD to work? Choose your evaluation, secure up to $400 K in starting capital, and start trading like a pro today.