


MACD and RSI Divergence Strategy to Trade Forex and Gold
A powerful MACD and RSI divergence strategy to effectively spot trend reversals and trade Forex and Gold, including prop trading applications.

Have you ever thought about how you could improve the quality of your trades? This guide aims to empower traders with a comprehensive strategy that uses the MACD and RSI divergence to help you anticipate and confirm the likelihood of a market reversal.
As opposed to fundamental trading strategies that rely on economic data or revenue growth reports. This approach focuses on technical analysis by examining price trends and signals directly on the price chart. This method is simple to use, even for manual traders, and works well with other tools or automated systems.
Overview of the Strategy
This strategy builds on the complementary strengths of MACD and RSI to anticipate market reversals with precision. While MACD highlights momentum and trend direction, RSI excels at spotting overbought and oversold conditions, especially when divergence appears between price and indicator.
By combining these tools, traders can detect potential turning points before they become obvious in price action. RSI divergence acts as an early signal that a reversal may be underway, while MACD confirms the broader momentum shift.
This layered confirmation increases the probability of accurate entries and reduces the chances of false signals, making it a powerful tool in both Forex and Gold markets.
The Logic Behind the Strategy
This strategy leverages RSI divergence and MACD momentum shifts to anticipate market reversals before or as they occur. When the RSI indicates divergence, and then the MACD line crosses the signal line, this confluence creates a high-probability trading signal.
This approach contrasts with other technical indicators and fundamental analysis, providing a balanced view that captures both historical price action and current market sentiment.
Indicators Settings
| Indicator | Component | Description |
|---|---|---|
| MACD | MACD Line | Difference between 12-period EMA and 26-period EMA |
| Signal Line | 9-period EMA of the MACD Line | |
| Histogram | Visual representation of the distance between MACD Line and Signal Line | |
| RSI | RSI Value | Momentum indicator scaled from 0 to 100 |
| Overbought | RSI > 70, may signal a potential reversal or pullback | |
| Oversold | RSI < 30, may indicate a potential rebound or trend shift | |
| Divergence | When price and RSI move in opposite directions, signaling possible reversal |
The combination of these indicators can produce useful trading signals, offering a structured approach that doesn’t rely on complex modelling techniques.
Best Assets to Trade
This strategy shines on:
- Gold (XAU/USD)
- Major Forex pairs such as EUR/USD, GBP/USD, and USD/JPY
These financial instruments frequently exhibit clear price trends and volatility, ideal for spotting divergence patterns that may signal a downward trend reversal or a burst of buying momentum.
Trading Approach & Timeframes
- Scalping: Ideal for short-term trades on the 5-minute to 15-minute charts.
- Day Trading: Best applied on 1-hour to 4-hour charts.
- Swing Trading: Suitable for longer-term positions on daily to weekly charts.
This flexible approach complements both technical trading and fundamental analysis, although it primarily focuses on capturing short- to medium-term price trends.
What is the MACD Indicator?
The MACD is a lagging indicator that captures momentum by comparing two exponential moving averages. Its visual simplicity is enhanced by the two lines—the MACD line and the Signal line—which help traders quickly identify changes in trend direction.
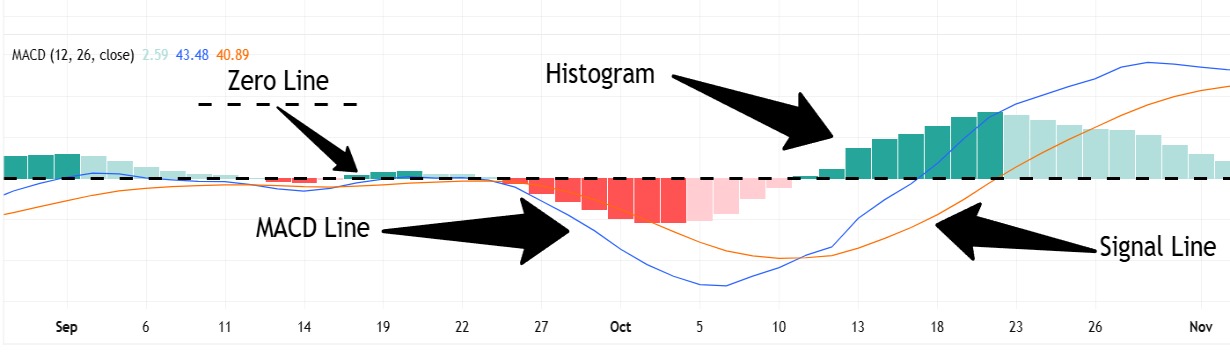
Key Components of MACD
- MACD Line: The difference between the 12 EMA and the 26 EMA. It indicates the direction of the trend and provides early warnings when the momentum shifts.
- Signal Line: A 9-period EMA of the MACD Line. Crosses between the MACD line and the Signal line—often referred to as MACD line crossover—are key signals for trade entries and exits.
- Histogram: Represents the gap between the MACD Line and the Signal Line. A widening histogram can suggest strengthening trends, while a narrowing one might indicate a reversal is imminent.
- Zero Line: A central reference point indicating neutral momentum. When the MACD Line or histogram is above, it signals bullish momentum is present. When they’re below, bearish momentum is dominant.
How We Use MACD
MACD crossovers serve as key confirmation signals to validate potential trend reversals.
- MACD Line Crossovers: When the MACD Line crosses above the Signal Line, it can confirm a bullish shift in momentum. A cross below the Signal Line, on the other hand, may confirm a bearish move.
- Zero Line Crossovers: A crossover above the Zero Line reinforces bullish momentum, while a move below it can signal a strengthening bearish trend.
These crossovers add conviction to the trade setup, especially when they align with RSI divergence.
What is the RSI Indicator?
The RSI is a momentum oscillator that measures the speed and magnitude of recent price movements. While it is technically a lagging indicator, traders often use it in a predictive way to identify overbought or oversold conditions that may signal potential trend reversals.
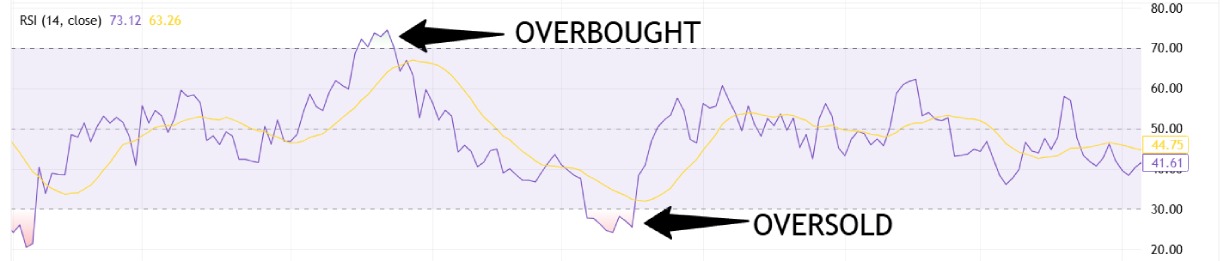
Key Components of RSI
- Overbought or Oversold Conditions: The RSI typically fluctuates between 0 and 100. Readings above 70 suggest overbought conditions, while those below 30 indicate oversold conditions.
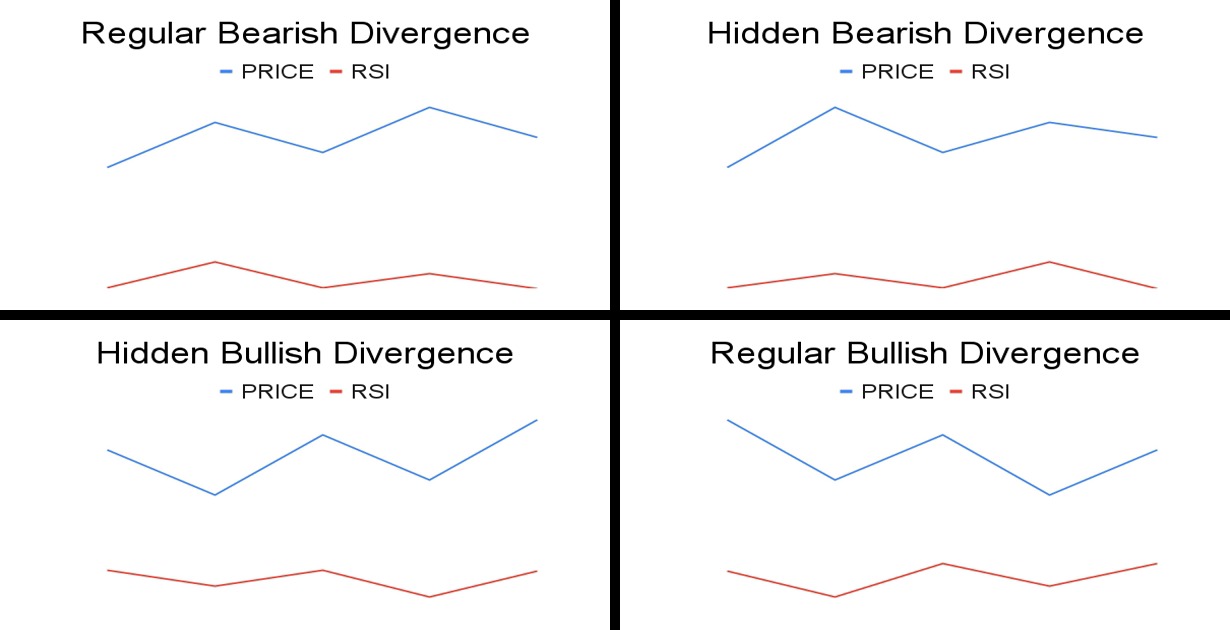
- Divergence: Divergence occurs when the price chart and RSI do not align—this can be an early warning of a trend reversal, often seen in both bullish and bearish setups.
Divergence Cheat Sheet:
How We Use RSI
We primarily rely on identifying regular RSI divergences as our main signal for anticipating potential reversals.
Regular divergences occur when the price and RSI move in opposite directions, highlighting a weakening momentum that often precedes trend reversals.
- Trade Confirmation: Regular RSI divergence, coupled with MACD crossovers or a weakening MACD histogram, significantly enhances the reliability of trade signals.
- Precision in Entries: When regular RSI divergence is detected in overbought or oversold territories (RSI above 70 or below 30), it provides additional confirmation, helping to reduce false signals. This nuance distinguishes our approach from strategies that rely solely on other technical indicators.
Strategy Breakdown
This section provides a detailed breakdown of how to combine MACD and RSI divergence for effective trade setups.
What to Look For
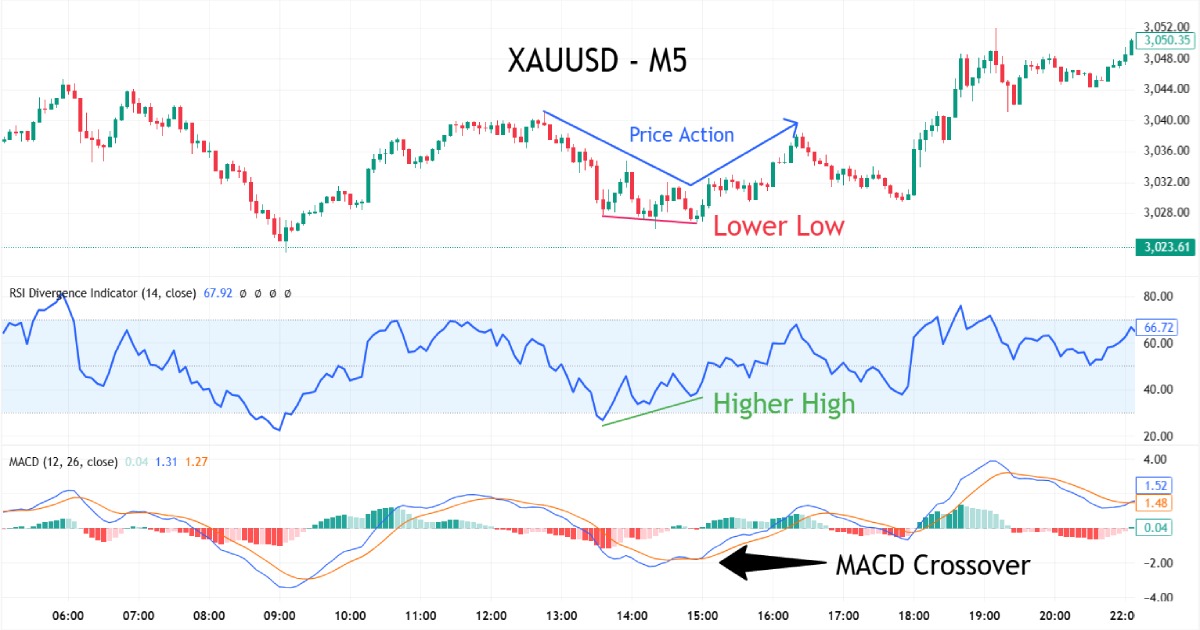
- RSI Divergence: Look for mismatches between the price chart and the MACD/RSI indicators. For example, if the price forms a new low but the RSI forms a higher low, it could be a sign of bullish divergence.
- MACD Confirmation: A crossover where the MACD line crosses above the Signal line, or even crosses the zero line, confirms the reversal.
- RSI Confirmation: Checking that RSI is near or below 30 for long setups—or above 70 for shorts—can strengthen the signal generated by the MACD, potentially increasing the probability of a reversal signal.
These steps ensure that the trading signals produced are robust, minimising the risk of a sudden decline that can occur in volatile markets.
Entry and Exit Rules
A disciplined approach is key to successful trading. Below are the detailed entry and exit rules that form the backbone of this strategy.
Entry Rules
Long Trade Setup:
- Price Action: The price forms a new low while the RSI forms higher lows — a classic regular bullish divergence.
- RSI Confirmation (Optional): RSI being in oversold territory (below 30) can add confidence to the setup but isn’t required.
- MACD Signal: A bullish MACD crossover (MACD line crossing above the signal line) confirms the potential reversal.
- Additional Checks: Look for supporting candlestick patterns (e.g., bullish engulfing or hammer) or other technical confirmations, such as trendline breaks or volume spikes, to strengthen the setup.
Example Bullish Entry:
Short Trade Setup:
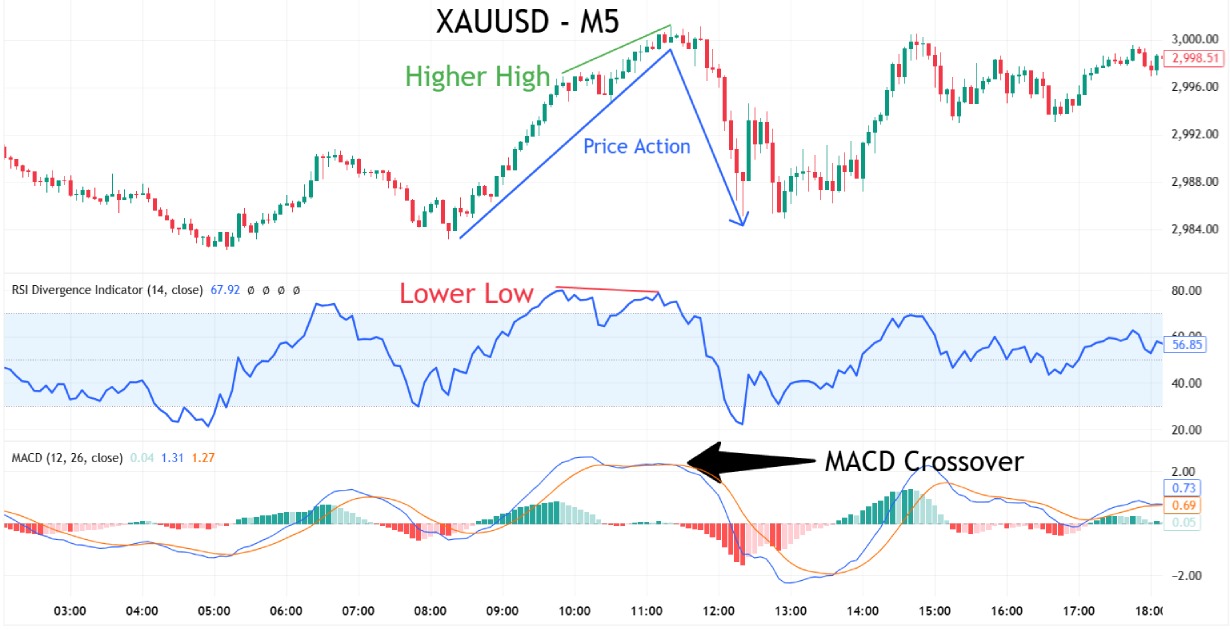
- Price Action: The price forms a new high while the RSI and MACD form lower highs — regular bearish divergence.
- RSI Confirmation (Optional): RSI being in overbought territory (above 70) may strengthen the case for a reversal but isn’t essential.
- MACD Signal: A bearish MACD crossover (MACD line crossing below the signal line) supports the short setup.
Additional Checks: Watch for bearish candlestick patterns (e.g., shooting star or bearish engulfing) or other technical confirmations like resistance zones or trendline rejections to validate the short idea.
Example Bearish Entry:
Exit Rules
Exiting a trade is just as important as entering — but how and when you exit can vary based on your trading style and objectives. Here are a few common methods traders use to manage exits:
- MACD Crossover Against Trade Direction: Some traders choose to exit when the MACD crosses in the opposite direction, signalling a potential momentum shift.
- RSI Levels as Profit Targets: For long trades, reaching overbought levels (above 70) can suggest it’s time to take profit; for shorts, an oversold reading (below 30) may prompt an exit.
- Trailing Stop-Loss: Adjusting your stop-loss as the trade moves in your favour can help lock in gains while allowing room for the trade to develop.
Example Bearish Exit:
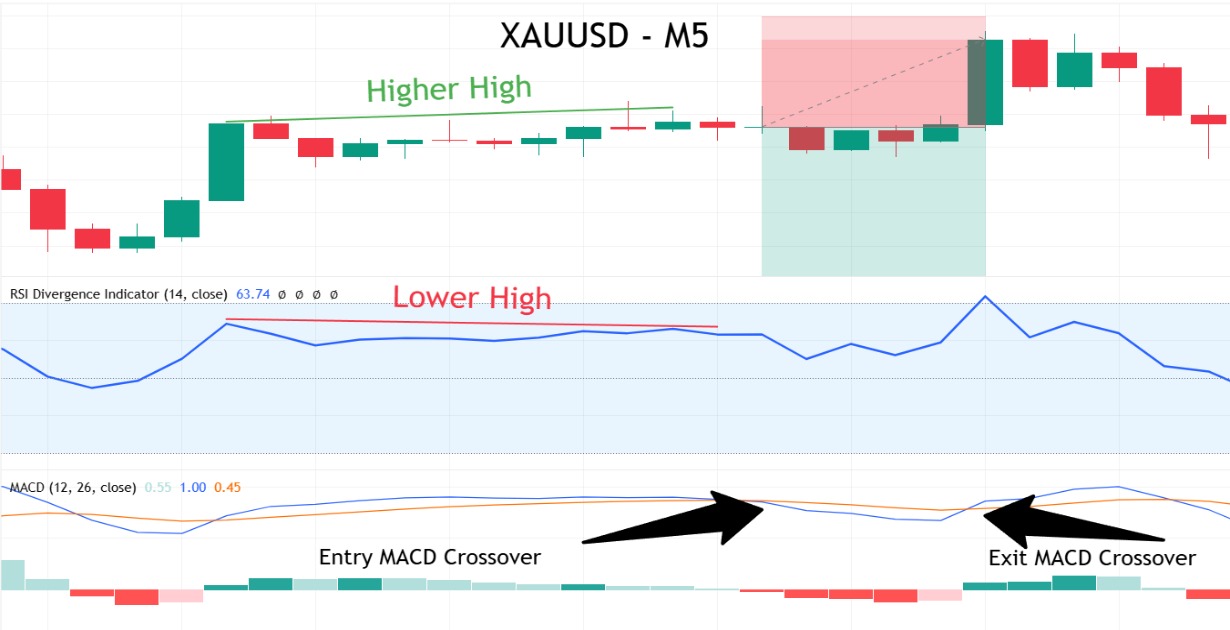
Note: In this example, we minimised losses by promptly closing the trade at the MACD exit crossover signal, rather than waiting for the stop-loss to be triggered.
These techniques can be used individually or in combination, depending on your risk tolerance and strategy. The key is to have a clear exit plan that aligns with your trade goals, helping you avoid emotional decisions or overtrading.
Additional Strategy Considerations
While the core of the strategy is robust, there are additional points to note for optimal implementation.
Best Trading Sessions
- Forex: The London–New York overlap offers high liquidity and frequent price movements, making it ideal for trend-based strategies.
- Gold: The New York session brings heightened volatility, creating favourable conditions for spotting divergence signals.
When NOT to Apply This Strategy
- Low Volatility Periods: The indicators may produce false signals in markets lacking sufficient momentum.
- Choppy, Range-bound Markets: In such scenarios, relying on historical price action may lead to misinterpreting divergence signals.
- Overreliance on Other Technical Indicators: While integrating other technical indicators can be beneficial, ensure they complement rather than conflict with MACD and RSI signals.
For traders using automated trading systems or advanced computer modelling techniques, these considerations ensure the strategy remains effective and adaptable.
Benefits of This Strategy
There are several key benefits to incorporating the MACD and RSI divergence strategy into your trading plan:
- High Probability Signals: Combining divergence from both MACD and RSI enhances the reliability of entry and exit signals.
- Multiple Setups: The strategy is well-suited for a variety of timeframes, allowing for multiple setups per week. This is particularly advantageous for those seeking to capitalise on price trends in volatile financial markets.
- Favourable Risk-to-Reward Ratios: With a targeted risk-to-reward ratio of at least 1:2, traders can maximise profits while keeping losses manageable.
- Versatility Across Instruments: Whether trading Forex pairs or Gold, this strategy has broad applicability.
- Support for Both Discretionary and Automated Trading: The clear rules allow for a fixed plan in discretionary trading while also lending themselves to coding in automated trading systems.
By adhering to a strict trading plan that incorporates these benefits, traders can experience steady revenue growth over time.
Common Mistakes to Avoid
While the strategy is powerful, some pitfalls can undermine its effectiveness:
- Not Considering Higher Timeframes: Always consider the long-term trend to avoid being misled by short-term fluctuations.
- Entering Trades Without Indicator Alignment: Ensure that both MACD and RSI agree. Failure to do so may result in taking trades based on misleading signals.
- Neglecting Stop-Loss Orders: A critical component of risk management is placing stop-loss orders to protect your account balance. This discipline prevents significant drawdowns.
- Misinterpreting Divergence: Not every divergence is a reversal. Confirm divergence with additional evidence, such as MACD crossovers or significant shifts in buying momentum.
Adhering to these guidelines will help you avoid common errors and maintain a consistent trading style that aligns with both your risk tolerance and your broker’s requirements.
Prop Trading Position Sizing & Risk Management
For prop traders, risk management is not just a guideline—it’s a necessity. The following guidelines are not just recommendations but are intended to serve as a framework when developing your trading plan.
Risk Per Trade
Aim to risk between 0.25% and 0.50% of your account balance on each trade. For example, if you are trading on a prop challenge with a maximum drawdown limit of 6%, you must calculate how many consecutive losses you can sustain before risking your account. This strategy emphasises managing risk meticulously, ensuring that even a series of losing trades will not compromise your overall trading capital.
Stop-Loss Placement
- Long Trades: Place your stop-loss just below the recent swing low.
- Short Trades: Set your stop-loss just above the recent swing high.
Take-Profit Targets
Aim for a minimum 1:2 risk-to-reward ratio. This ratio helps ensure that even if not all trades hit their targets, the profitable ones will provide a net gain.
Risk Management Table
| Account Size | XAU/USD Lot Size | USD/JPY Lot Size |
|---|---|---|
| 5,000 | 0.05 | 0.25 |
| 10,000 | 0.10 | 0.50 |
| 25,000 | 0.25 | 1.25 |
| 50,000 | 0.50 | 2.50 |
| 100,000 | 1.00 | 5.00 |
| 200,000 | 2.00 | 10.00 |
| 400,000 | 4.00 | 20.00 |
The table above illustrates approximate position sizes for XAU/USD and USD/JPY pairs based on a 0.5% risk per trade and a 50-pip stop loss. These figures provide a practical baseline for aligning trade size with account equity while staying within common prop firm risk parameters.
Summary
The MACD and RSI divergence strategy offers a robust approach to spotting market reversals and executing profitable trades. Here are the key takeaways:
- Risk Management is Paramount: Always adhere to a strict risk tolerance by risking only a small fraction of your account balance per trade. This is especially vital for prop traders where the rules are rigid and every trading decision counts.
- Adaptability: Whether you are involved in manual trading or prefer automated trading, this strategy is applicable for both approaches.
- Practice Makes Perfect: Before applying this strategy to a live account, it is essential to test it in a demo environment.
By following this structured approach, FXIFY traders and others in the financial markets can refine their entry and exit rules, leading to more precise and profitable trading decisions. The method’s simplicity combined with its powerful divergence signals makes it one of the most effective technical trading strategies available today.
In conclusion, while no trading strategy can guarantee success, the MACD and RSI divergence technique is a valuable addition to your arsenal. It encourages a disciplined trading plan to capture market reversals before they fully unfold. As always, remain aware of the inherent risks, continue to educate yourself on trading signals and price trends, and ensure that your trading decisions align with your overall financial goals and risk tolerance.
Remember, consistency and discipline are the hallmarks of successful trading. The best trading strategy is the one you understand easily, fit into your routine, and execute with great risk management.