


Morning Star Candlestick Strategies for Trading Forex Reversals
Master the Morning Star pattern for bullish reversals with strategic entries and exits. Boost your trading skills at FXIFY. Get funded now!
During a downtrend, the Morning Star candlestick pattern is a beacon of hope for traders which signals a potential bullish reversal. This guide explores how to identify and effectively trade this pattern, ensuring traders can capitalise on shifts in market momentum.
What is a Morning Star Pattern?
A Morning Star pattern is a three-candle formation that often signals a bullish reversal after a downtrend. This pattern starts with a long bearish candle, followed by a small-bodied candle that reflects market indecision, and concludes with a bullish candle that pushes higher, closing within the body of the first candle.
This transition from bearish to bullish sentiment indicates that buyers are beginning to regain control after a period of selling pressure, potentially leading to further upward movement.
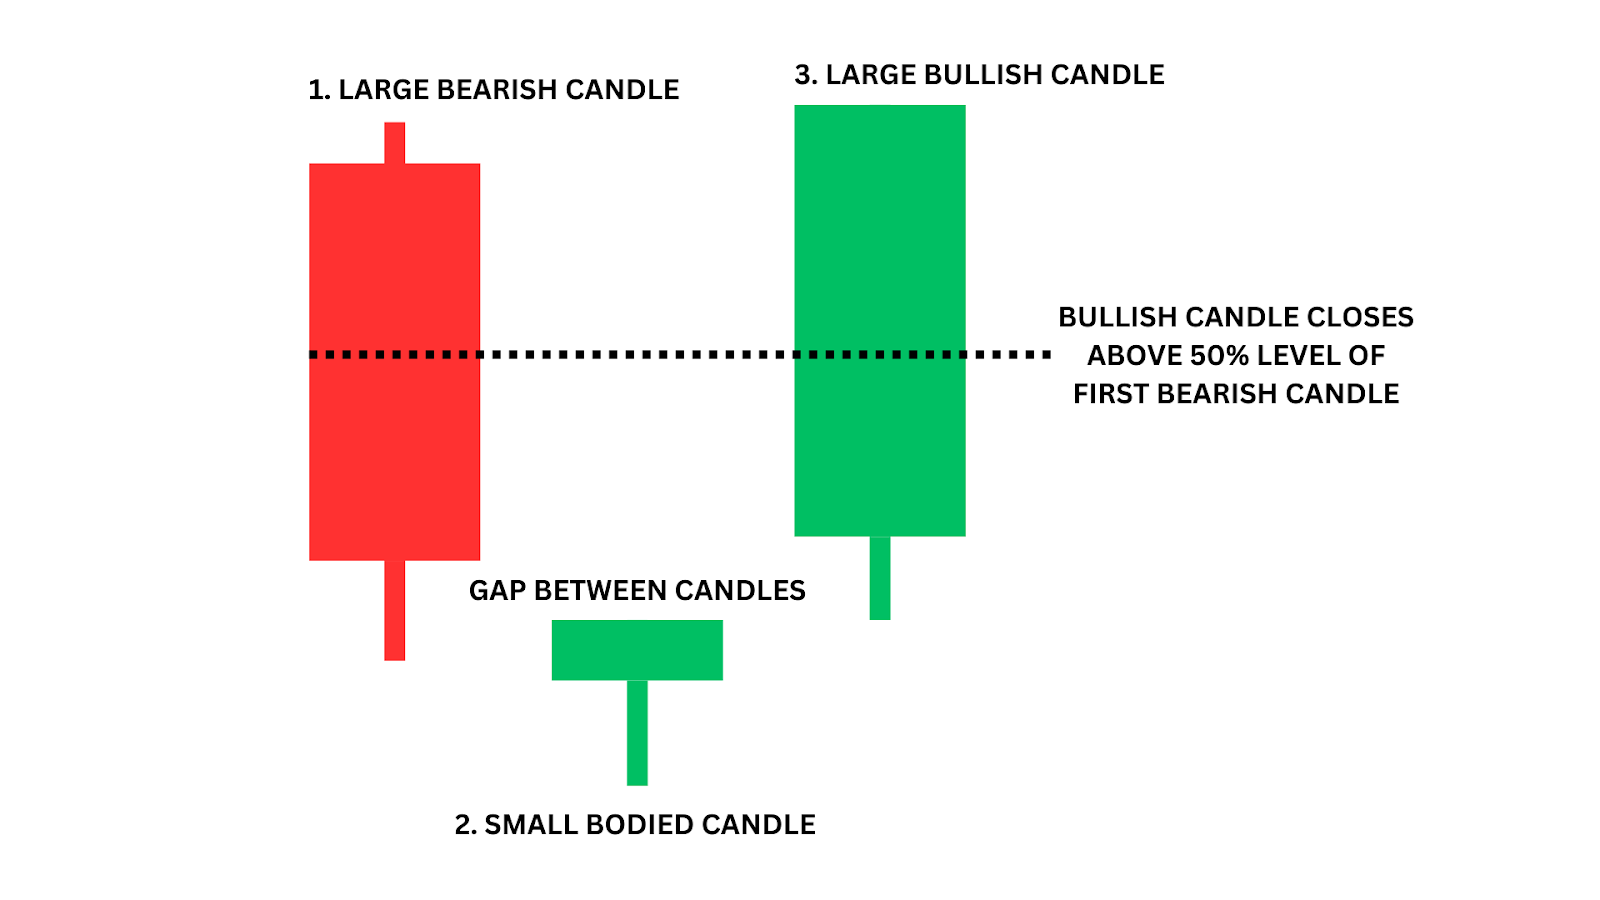
Price gaps can sometimes be observed in the Morning Star candlestick, highlighting shifts in market sentiment. The strength of the reversal often depends on the size and momentum of the third candle.
Big gap up on the third candle = Big buying volume! Easy to remember, but an important observation.
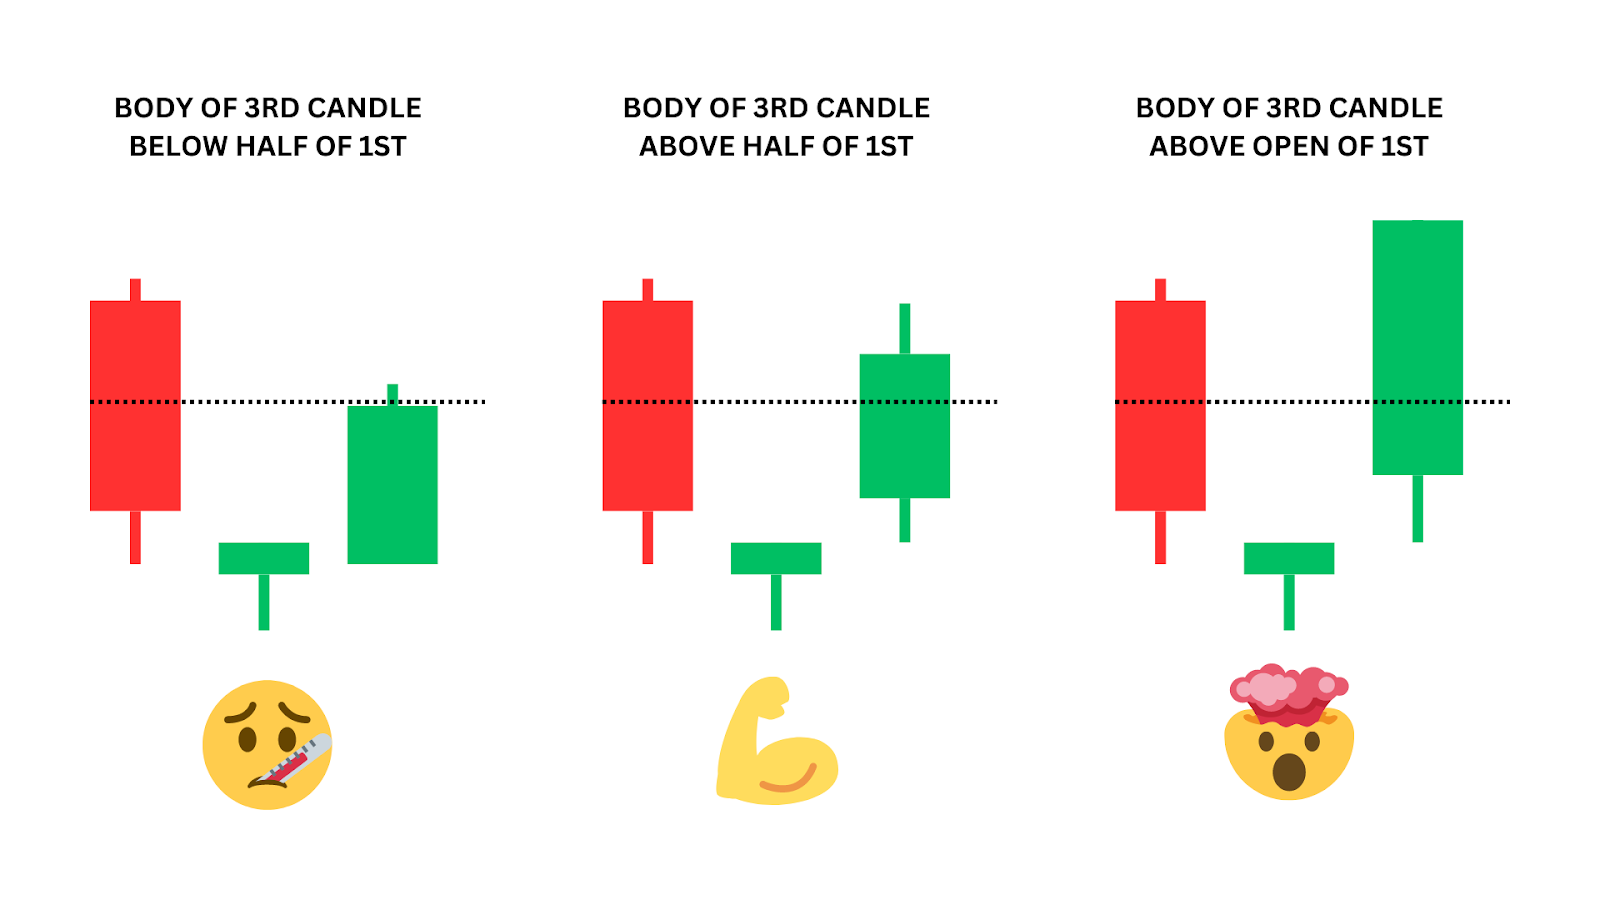
Here’s a good visual cue to help you lock it in your memory.
Characteristics of a Morning Star Pattern
Formation:
- Three-candle formation signalling a potential bullish reversal after a downtrend.
- Starts with a long bearish candle, followed by a small-bodied candle indicating indecision, and ends with a bullish candle closing within OR ABOVE the body of the first candle. The higher close, the stronger.
- Typically appears at the bottom of a downtrend, indicating a potential shift in market sentiment.
Psychology:
- First bearish candle reflects continued selling pressure, with sellers still in control.
- Second small-bodied candle suggests market indecision, with neither buyers nor sellers having a clear advantage.
- Strong bullish third candle shows buyers regaining control, signalling a shift in momentum from bearish to bullish.
Confirmation:
- Confirmation occurs when the price continues to rise after the third candle.
- Ideally, the next candle closes above the high of the third candle, confirming the bullish reversal.
- Traders may seek additional confirmation through other technical indicators, such as moving averages or volume, to validate the strength of the reversal.
Examples of Morning Star Patterns in the Charts
Analysing real-life chart examples can vastly improve your understanding and application of the Morning Star pattern. It’s important to remember that when you’re looking at real-life charts, you might not always be so lucky to see textbook morning stars.
Let’s have a look at these candlestick patterns appearing on different time frames, and in different markets.
For these examples, we’ll look at forex markets, cryptocurrency markets and commodities, to show you that this powerful three candle pattern really does appear everywhere if you know what you’re looking for!
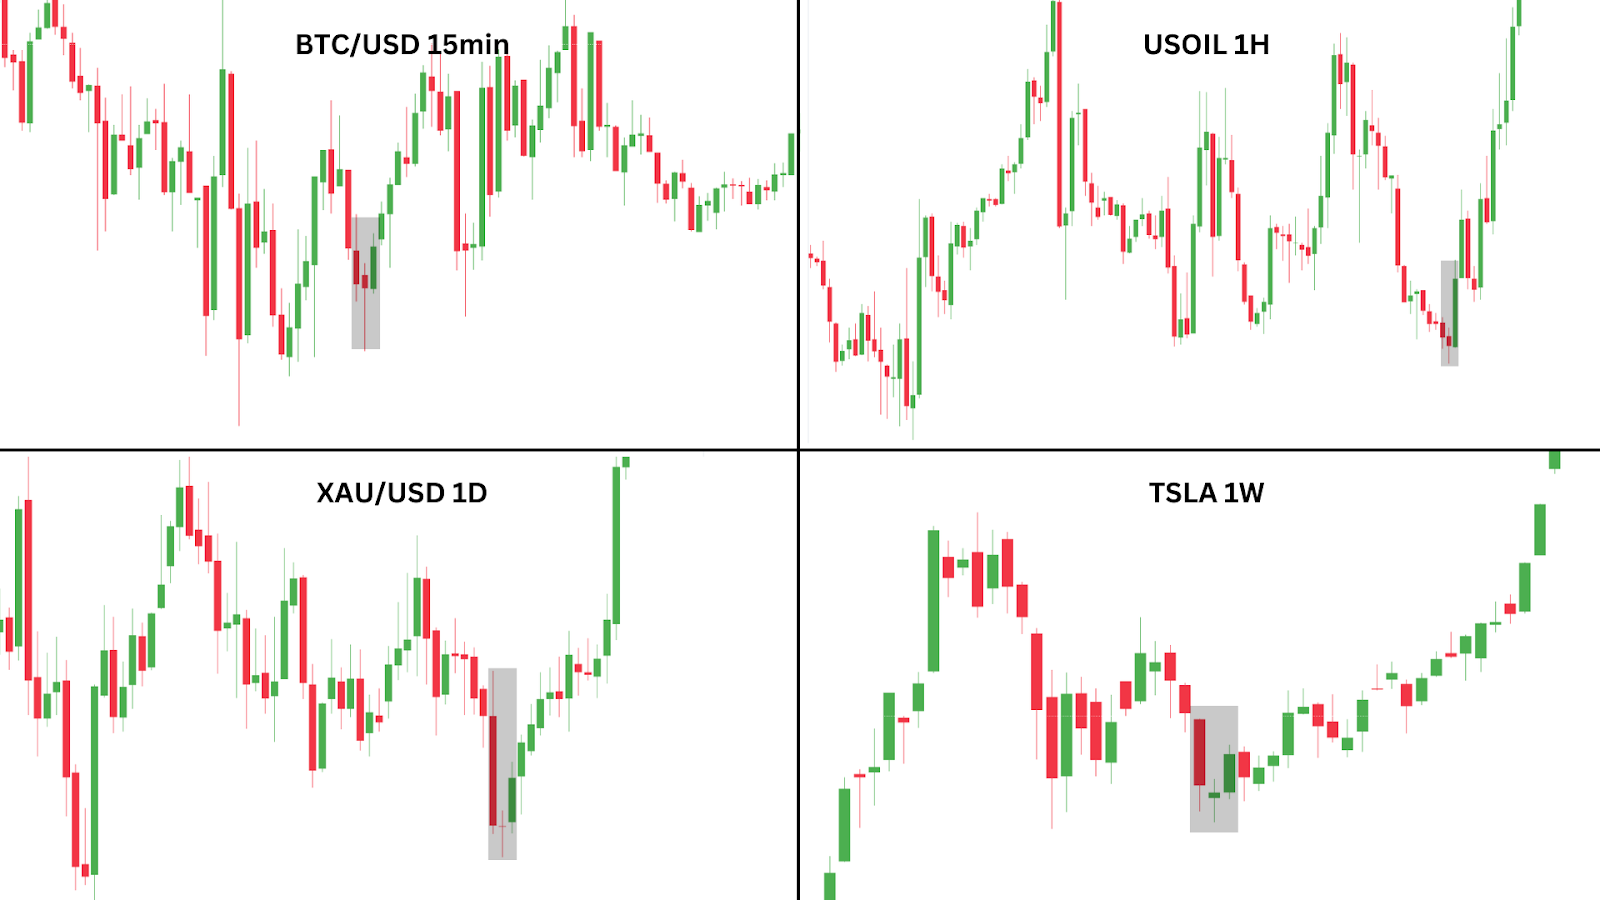
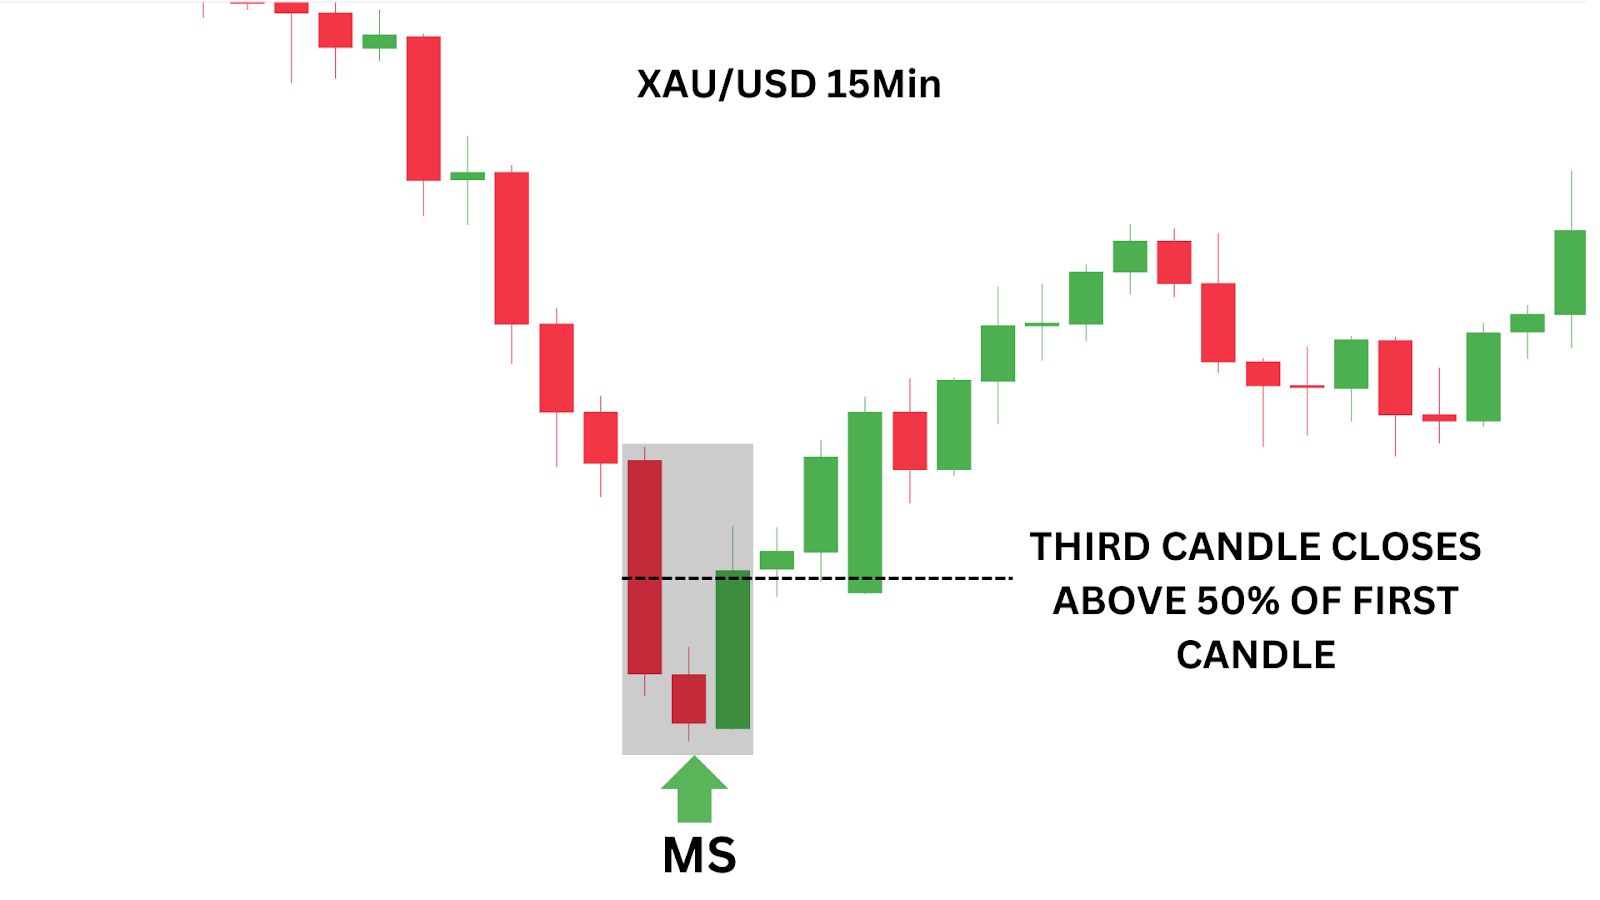
As mentioned before, each of these morning star patterns are quite different and of varying ‘strength’. From these examples, we could infer that USOIL is the strongest, followed by BTC/USD on the 15min.
This is because the third candlestick in the USOIL and BTC/USD charts is much stronger because of how it closed (at least above 50% of the first bearish candle).
Let’s go deeper into our technical analysis.
Case Study: Morning Star Seen on USOIL (Weekly)
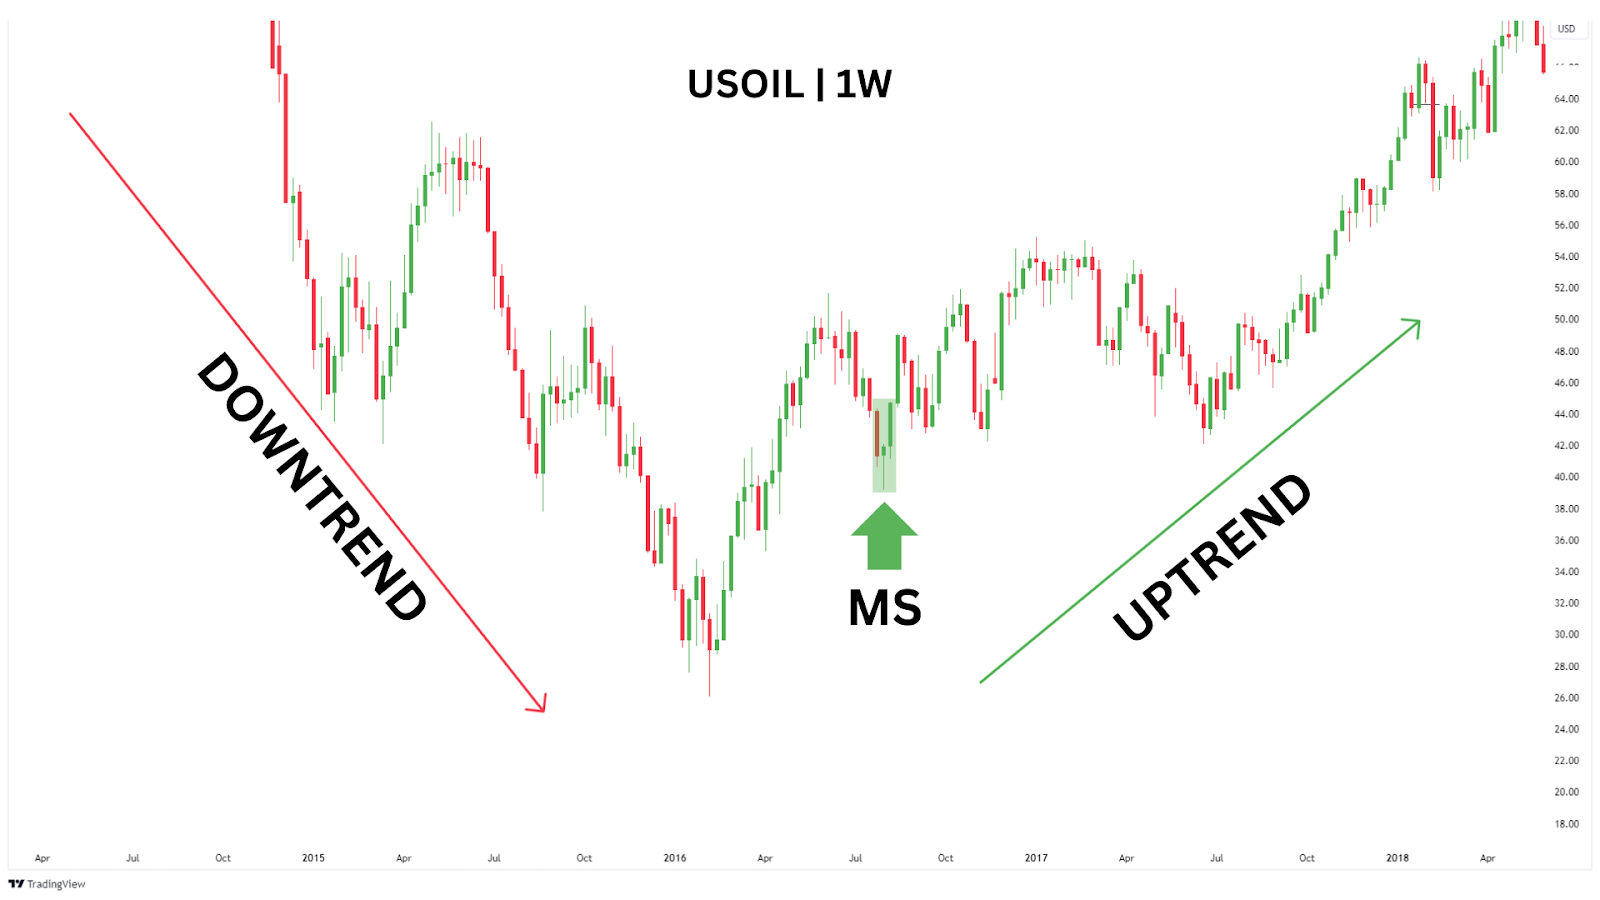
In August, 2016, the USOIL chart featured a textbook morning star pattern. It was after years of downward price action, where sellers had been in complete control.
After one failed morning star rally, and a brief consolidation at multi-year lows, USOIL began to break out. Consolidation is when price effectively moves sideways, or within a range.
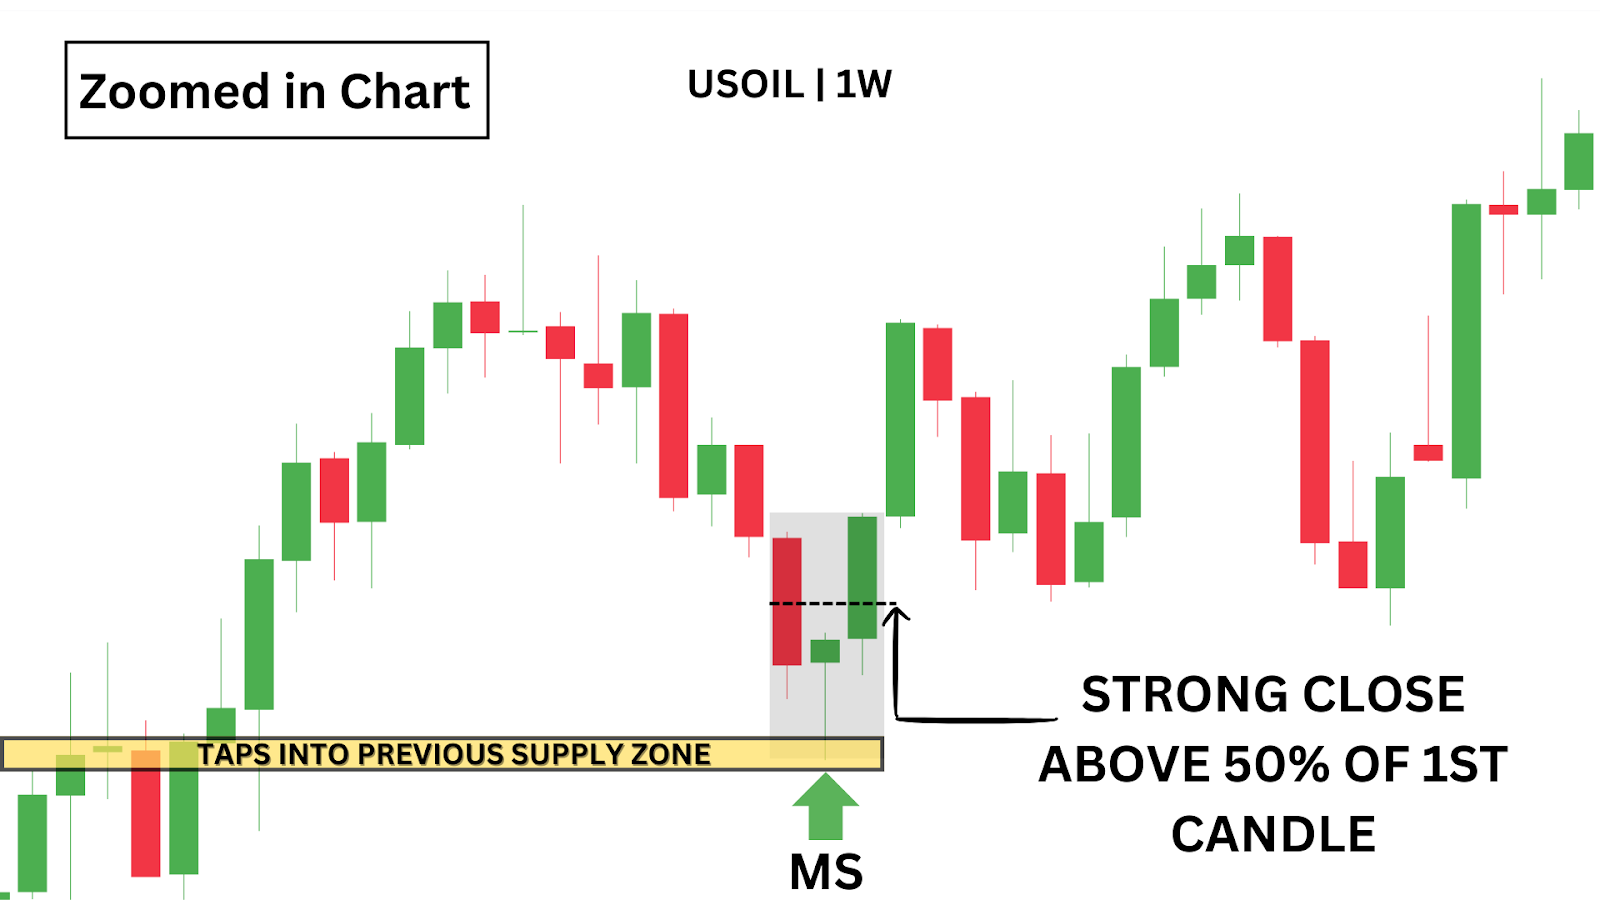
We can see in the image below, it pulls back slightly, before forming a strong morning star pattern. Our middle candlestick was a small-bodied candle with a long lower shadow, and our third was a long bullish candle that closed above the original bearish candle – showing that this new uptrend was here to stay.
Zooming in, we can see the wick from the morning star tap into a consolidation zone, where buyers and sellers had spent a few weeks in battle.
As we dive deeper into our trade methods, we will show you how there was another bullish indicator at this low point telling us to get into a long position.
How Can You Trade the Morning Star Pattern?
The morning star is a powerful and reliable reversal pattern which can be traded with a number of strategies.
At the core of it all, however, is trading the morning star pattern at key support levels, and also understanding how to pair the pattern with momentum indicators to get a better confirmation of a reversal.
Here are three strategies to consider the next time you want to trade the morning star.
Method One: Trade the Breakout Candle Midpoint
The Morning Star pattern offers traders two main entry strategies, each with its own advantages. The most straightforward approach is to enter a long position right at the close of the third bullish candle. This confirms the reversal and allows you to jump in as momentum shifts in your favour.
This is a reliable way to trade the Morning Star, especially for those looking to catch the move as early as possible.
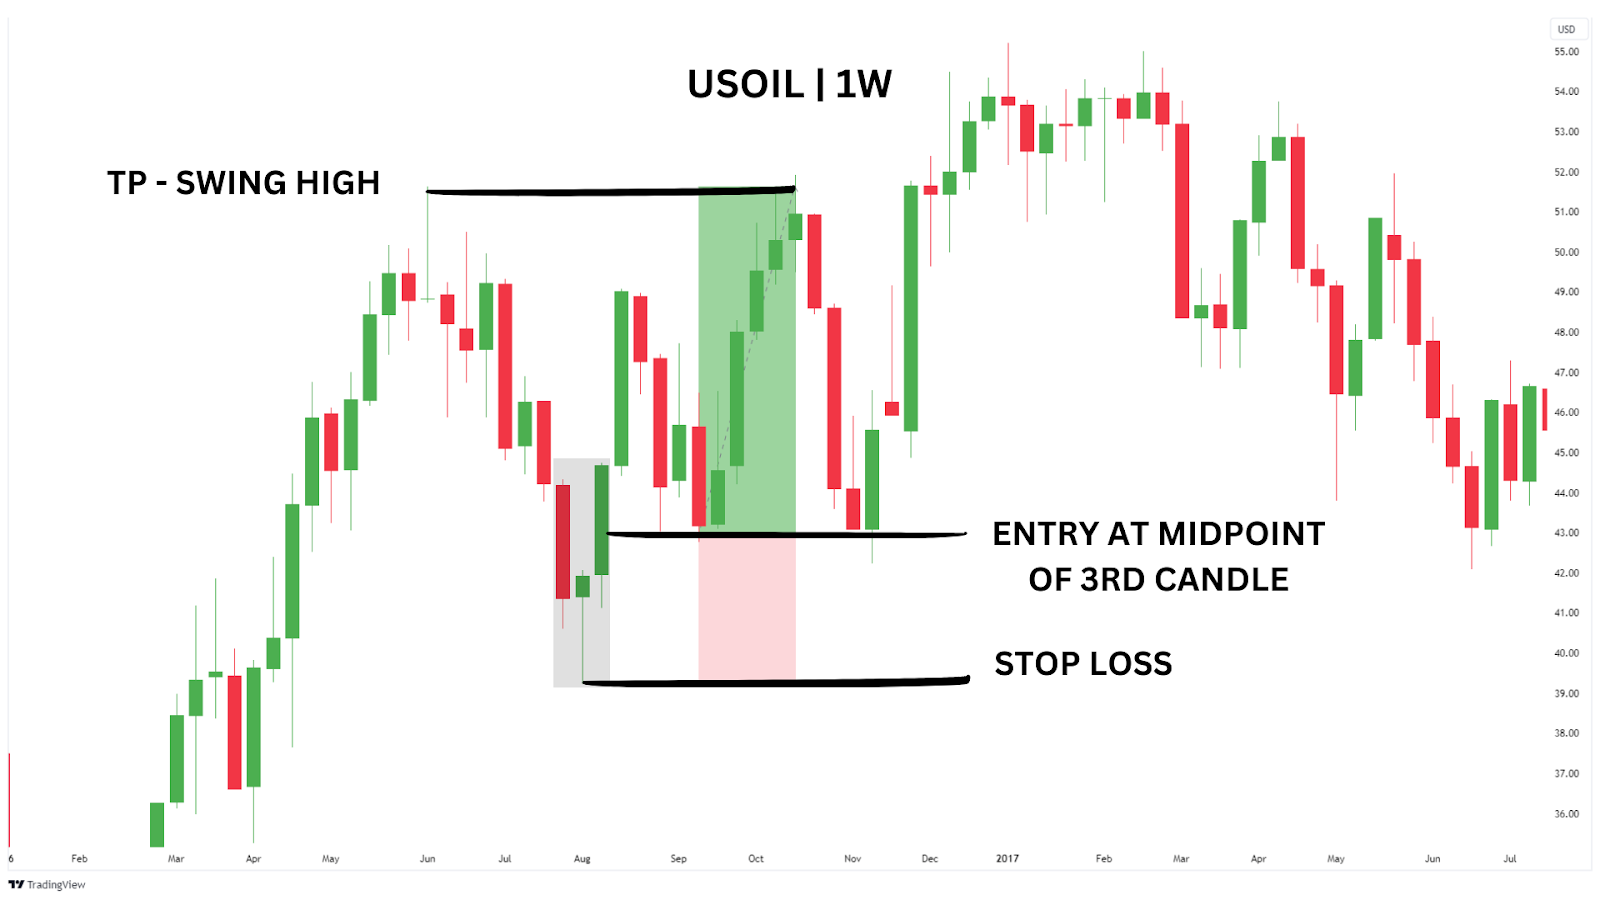
However, for those willing to exercise a bit more patience, there’s an alternative method that can improve your risk-to-reward ratio. Instead of entering at the close of the third candle, you can place your limit orders at the midpoint of the third bullish candle’s body.
This technique allows for a better entry price, reducing risk while still capitalising on the reversal. Your stop loss would be placed below the low of the Morning Star pattern, ensuring your risk is well-managed.
When the price of something (like a stock or currency) suddenly jumps up very quickly, it’s like the market made a big leap. But after such a big jump, there’s a good chance the price will take a step back before continuing to rise.
This step back creates an opportunity for us. We expect the price to return to the area where it recently jumped from, so we wait there with our buy orders ready, hoping to catch the price at a lower level before it goes up again.
Ideally, morning stars are strongest when the third candle body closes AT LEAST 50% above the midpoint of our first bearish candle.
For beginners, we recommend taking profit at 1:2 – but if you’re looking for a higher RR, simply place your take profits at the most recent swing high. If price is bullish, then we should be making new higher highs, and therefore hit our TPs.
If price DOES NOT RETURN to this area, DO NOT chase price action and enter late, learn to accept that the trade has gone without you, and wait for the next setup. There’s always another trade right around the corner.
As you can see, with this entry we were able to secure a 2.5RR trade. As this was on the weekly, it would require patience – but an important thing to remember is that this visual pattern occurs on all time frames if you prefer scalping and getting in and out of the market quickly.
Trading Strategy Summary:
- Entry Point:Place a limit order at the midpoint of the third bullish candle’s body for a more favourable entry point.
- Stop-Loss: Set your stop-loss just below the low of the Morning Star pattern to protect against potential reversals.
- Profit Target: Beginners should aim for a 1:2 risk-to-reward ratio, while more experienced traders can target the most recent swing high for larger gains.
| Advantages: Provides a clear and structured entry strategy with well-defined risk parameters.The midpoint entry increases the likelihood of securing a better risk-to-reward ratio, as it allows for a potential pullback before the continuation of the bullish move. |
| Disadvantages: Waiting for the price to return to the midpoint of the third candle may result in missed trades if the price continues to move upward without retracing. The pattern can sometimes fail in choppy markets or during periods of strong downward momentum, making confirmation and stop-loss placement crucial. |
Method Two: Fibonacci Projection Strategy
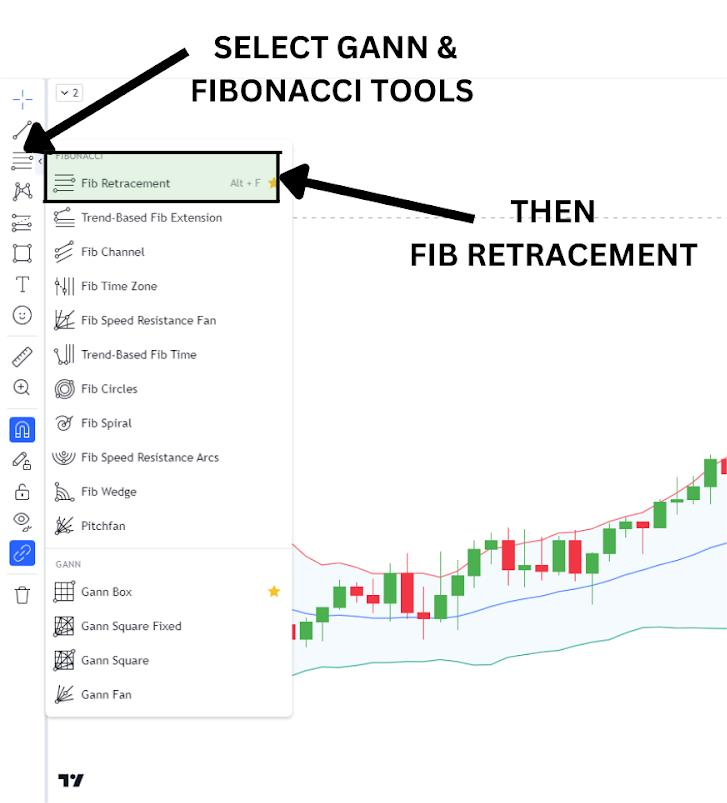
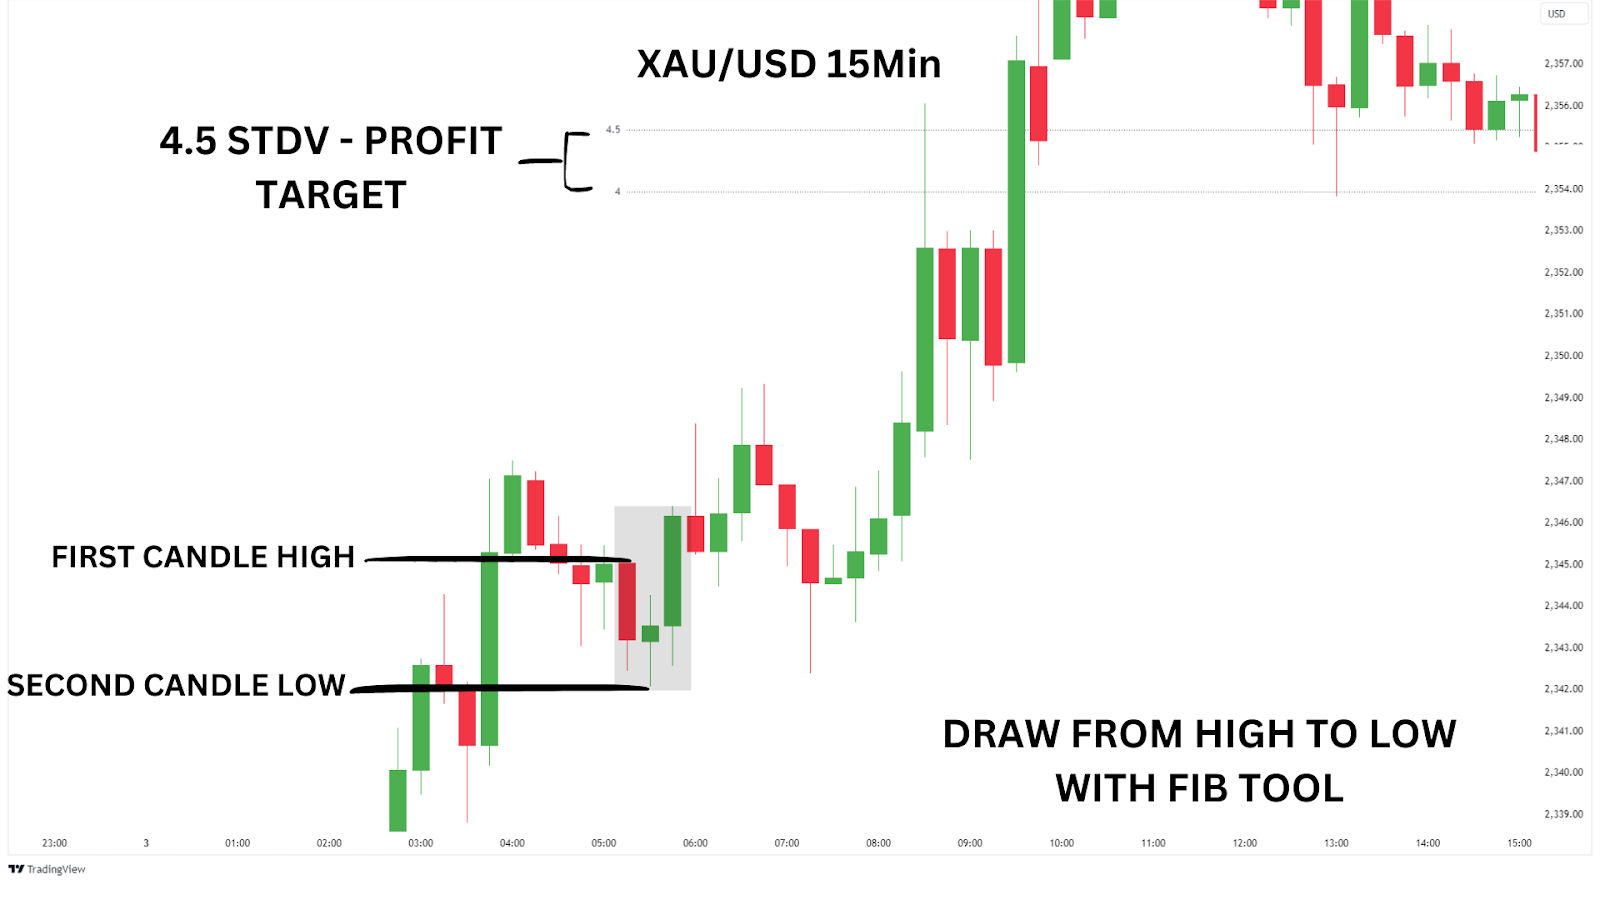
This strategy gets a little more complicated, but it’s easy once you understand how to use the fib retracement tool in TradingView. We are looking at Gold on the 15 minute time frame.
To find the fib retracement tool, click on the ‘Gann & Fibonacci Tools’ in TradingView’s menu. Then select the Fibonacci Retracement tool.
Next, set up the fib retracement tool to only show 4 and 4.5.
Now, drag the fib retracement from the top of the FIRST bearish candle of our three candle pattern, down to the low of our morning star. We will call these the first candle high and the second candle low.
The fib retracement tool will then plot 4-4.5 standard deviations of this move away from the morning star pattern – this is our take profit target!
Here’s where we can get creative with our entries. Set one limit entry at the midpoint of our third candle, as we did in method 1. Then, set another limit entry on the close of the third candle.
Both take profits should be at the 4-4.5 STDV and both stop losses should be on the low of our morning star pattern.
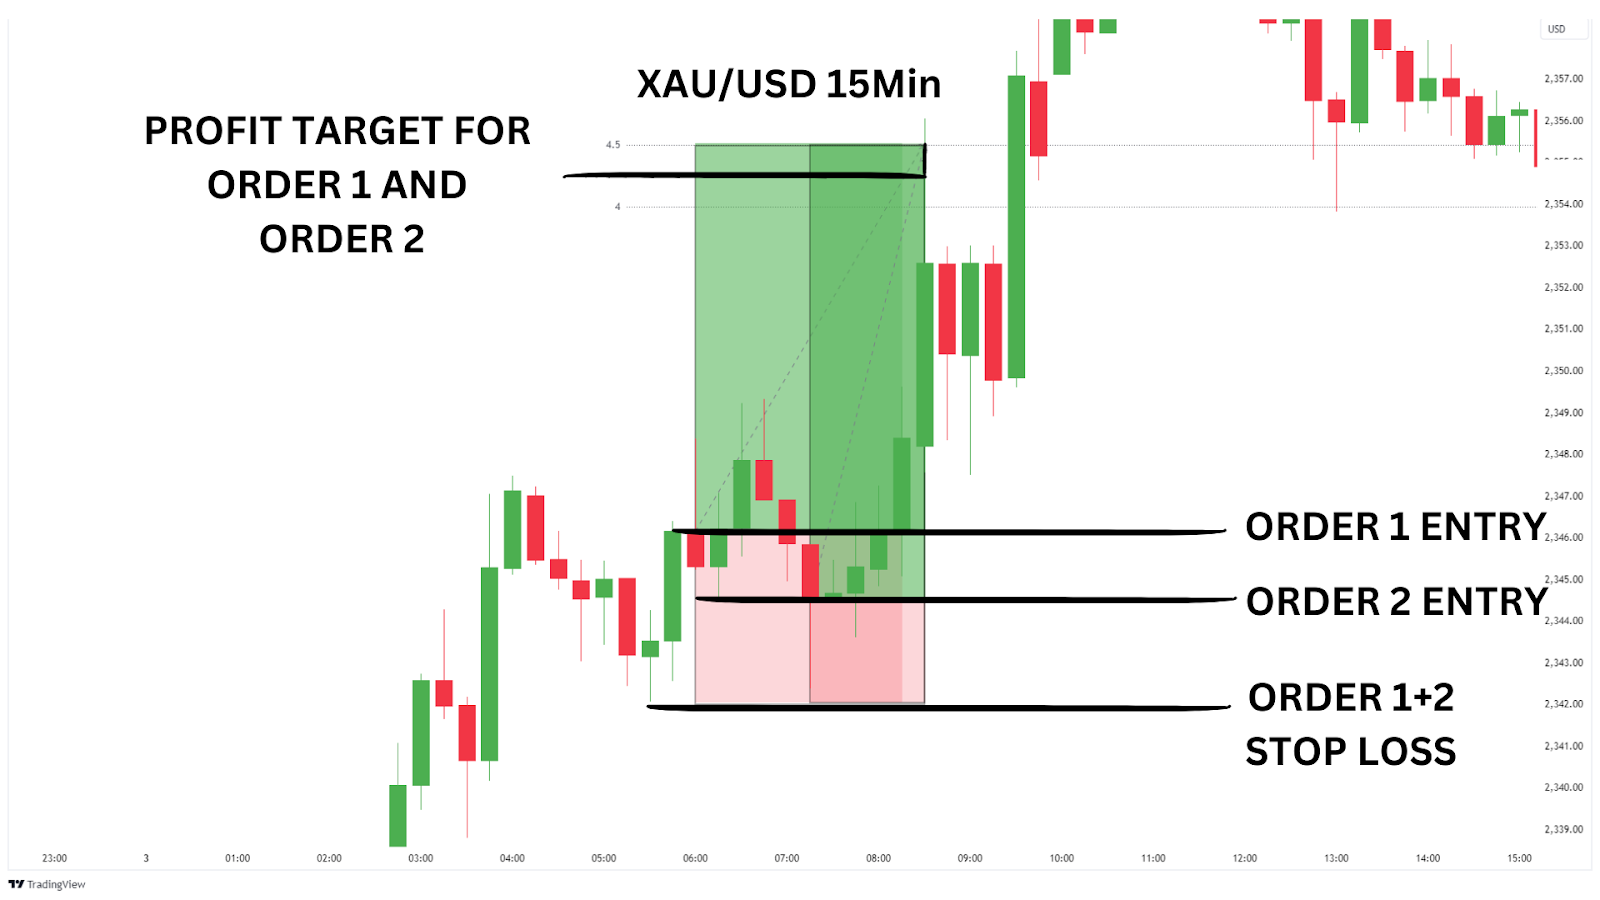
Having two orders may help relax the FOMO you may feel thinking price is going to leave without you. Remember, size accordingly if placing two orders, don’t overisk!
As we see in the image below, this results in two fantastic winning swing trades; one with a 2.2RR and one with a 4.7RR!
Trading Strategy Summary:
- Entry Point: Place one limit order at the midpoint of the third bullish candle and another at the close of the third candle for diversified entries.
- Stop-Loss: Set your stop-loss just below the low of the Morning Star pattern to protect both positions against reversals.
- Profit Target: Target the 4-4.5 standard deviations away from the Morning Star pattern using the Fibonacci retracement tool for optimal take profit levels.
| Advantages: Combining two entry points helps mitigate the fear of missing out (FOMO) while improving your chances of capturing the move. Targeting precise Fibonacci retracement levels provides a structured approach to locking in larger gains from the reversal. |
| Disadvantages: Using multiple entries and relying on precise Fibonacci targets can add complexity to the strategy and requires careful risk management. This method may not be as effective in choppy markets or on lower time frames where price movements can be more erratic. |
Method 3: RSI + Bollinger + Morning Star = The Ultimate Combo
This strategy leverages the power of the Morning Star pattern combined with RSI and Bollinger Bands® for precise entries in highly volatile markets.
For this strategy, choose the Bollinger Bands® indicator and a RSI indicator on TradingView.
On the 15 min time frame on Gold, we see this strong looking morning star. It’s closed just above the midline of our first bearish candle, indicating strong buying pressure.
When we add our extra indicators however (Bollinger + RSI), we can see something even more interesting. The pattern is taking place right on the support line of the bollinger band, and is also showing as massively oversold on the RSI.
When we get the added confluence of our strong third candle moving back away from the bottom line of the bollinger, we can begin to look for long entries.
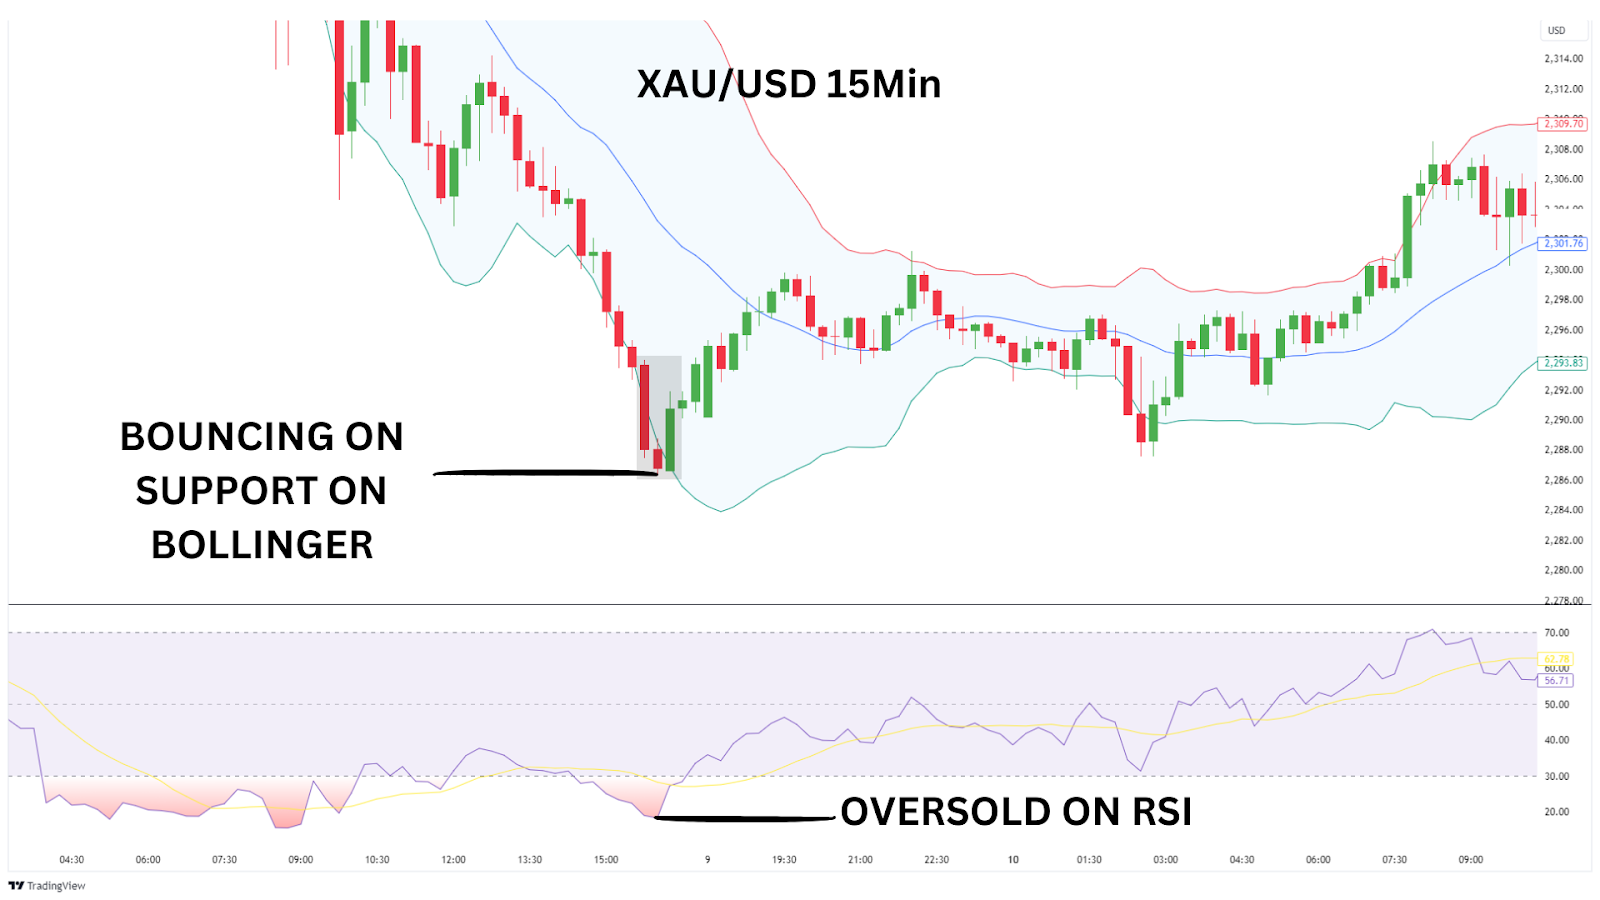
To keep this strategy simple and to ensure we secure profits as we are trading on lower time frames and on quite a volatile market, set your take profits at a 1:2RR.
As in methods 1 and 2, our stop loss should be on the low of the morning star pattern and our entry should be on the CLOSE of our second candle in the pattern.
See the image below for clarity.
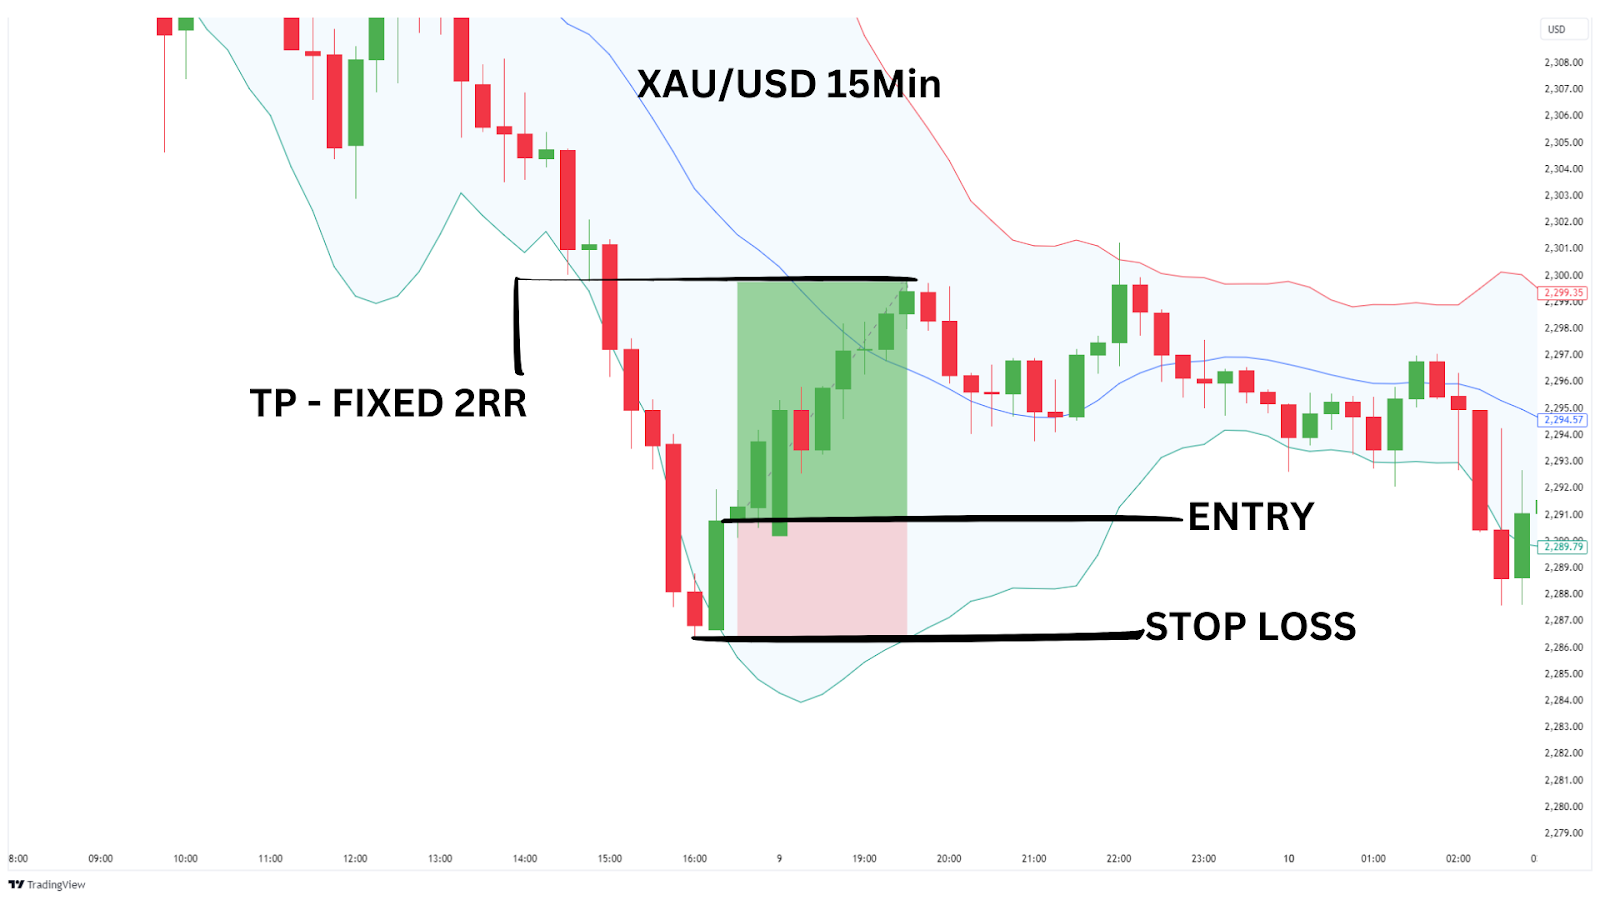
As we can see, we hit our take profits of 2RR in approximately 2 hours, an excellent scalp trade!
Trading Strategy Summary:
- Entry Point: Place limit order at the close of the third candle for safe entry.
- Stop-Loss: Set your stop-loss just below the low of the Morning Star pattern to protect your position against reversals.
- Profit Target: Target fixed 1:2RR.
| Advantages: Combining the Morning Star with RSI and Bollinger Bands® gives better confirmation and helps spot stronger reversals. Works well on short timeframes, allowing traders to act fast in volatile markets. |
| Disadvantages: Using multiple indicators can be hard for beginners and requires technical knowledge. Strict entry rules mean fewer trade opportunities, so some chances might be missed. |
Closing Thoughts on the Morning Star Candlestick Pattern
The Morning Star is a powerful bullish reversal pattern that can signal the end of a downtrend and the beginning of an upward move. While it requires patience and proper setup, this pattern has a high success rate when identified correctly, with research showing an accuracy of around 78% in predicting bullish reversals.
Although it can be rare and sometimes difficult to spot, adding the Morning Star to your trading arsenal can enhance your ability to capitalise on trend changes.
Here are some advantages and disadvantages to keep in mind when trading this pattern:
Advantages of Trading the Morning Star:
- Bullseye Reversals: High success rate in predicting bullish reversals.
- Sharp Shooter: Clear entry and exit points for structured trades.
- Time Frame Flex: Works effectively across various timeframes and markets.
Disadvantages of Trading the Morning Star:
- Patience Tester: Reversal may not happen right away, leading to potential drawdown before the move occurs.
- Rare Gem: The pattern can be rare and difficult to spot in real-time trading.
- Makes You Wait: Requires additional confirmation for higher reliability, which may delay entry.
FAQs
How is the Morning Star Pattern Formed?
The Morning Star pattern consists of three candles: a bearish candle, followed by a small-bodied candle that reflects market indecision, and finally, a bullish candle that closes above the midpoint of the first candle, signalling a potential trend reversal.
What is a Morning Star Pattern, and how does it compare to the Evening Star?
The Morning Star is a bullish reversal pattern that forms after a downtrend, signalling a potential shift to an uptrend. It contrasts with the Evening Star, a bearish reversal pattern forming after an uptrend. Both are three-candle formations indicating trend reversals in opposite directions, and their reliability is enhanced with confirmation from technical indicators like support/resistance levels.
What’s the difference if the second candle is a doji or has a small body?
Whether the second candle is a doji or has a small body, it serves the same purpose—signalling indecision in the market. The real focus should be on the third candle, which is the most important in the Morning Star pattern. This bullish candle confirms the reversal by closing above the midpoint of the first candle, indicating that buyers have taken control and a potential uptrend is beginning.
Does it matter if gaps are in the Morning Star Pattern?
Gaps are not necessary for the Morning Star pattern to be valid, but they can enhance its strength. A gap down between the first and second candles and a gap up between the second and third candles make the pattern more powerful, reinforcing the reversal signal. However, the pattern can still be effective even without gaps, as long as the overall structure and context support a potential reversal.
What is a Morning Star Doji candle and how does it signal a reversal?
The Doji Morning Star, or Morning Doji Star is a specific type of Morning Star pattern where the middle candle is a doji, indicating indecision in the market. This indecision adds weight to the potential bullish reversal, especially when the previous candle is a strong bearish move. The third candle, a bullish one, confirms the reversal. This pattern is highly regarded for signalling a shift from bearish to bullish sentiment, making it an essential tool for traders looking to capitalise on trend changes.