


Relative Strength Index (RSI): Why It Works, How to Use It?
Master the Relative Strength Index (RSI). Our complete guide covers RSI signals, divergence, and actionable trading strategies to help you analyse market momentum.
The Relative Strength Index (RSI) is a popular momentum oscillator used to measure the pace and direction of recent price changes. Traders rely on it to spot overbought or oversold conditions in forex, stocks, and crypto — helping identify when momentum may be shifting.
For the disciplined trader, the RSI is a powerful tool for gauging market sentiment with greater precision and confidence. This guide provides a comprehensive look at the Relative Strength Index. By understanding how the RSI works, you can better integrate this tool into your analysis for more informed trading decisions.
What is the Relative Strength Index (RSI)?
The Relative Strength Index (RSI) is a momentum oscillator used in technical analysis to evaluate an asset’s recent performance. Its function is to measure the speed of price movements, helping traders identify overbought or oversold conditions where a reversal might occur. It’s a key component in many Forex Trading Strategies, Techniques and Examples.
On a chart, the RSI indicator appears in a separate window below the main price action. It is displayed as a single line that oscillates between two extremes, 0 and 100. This bounded nature makes it straightforward to read and interpret the relative strength of market momentum at a glance. The chart below provides a clear example of how the RSI is displayed.
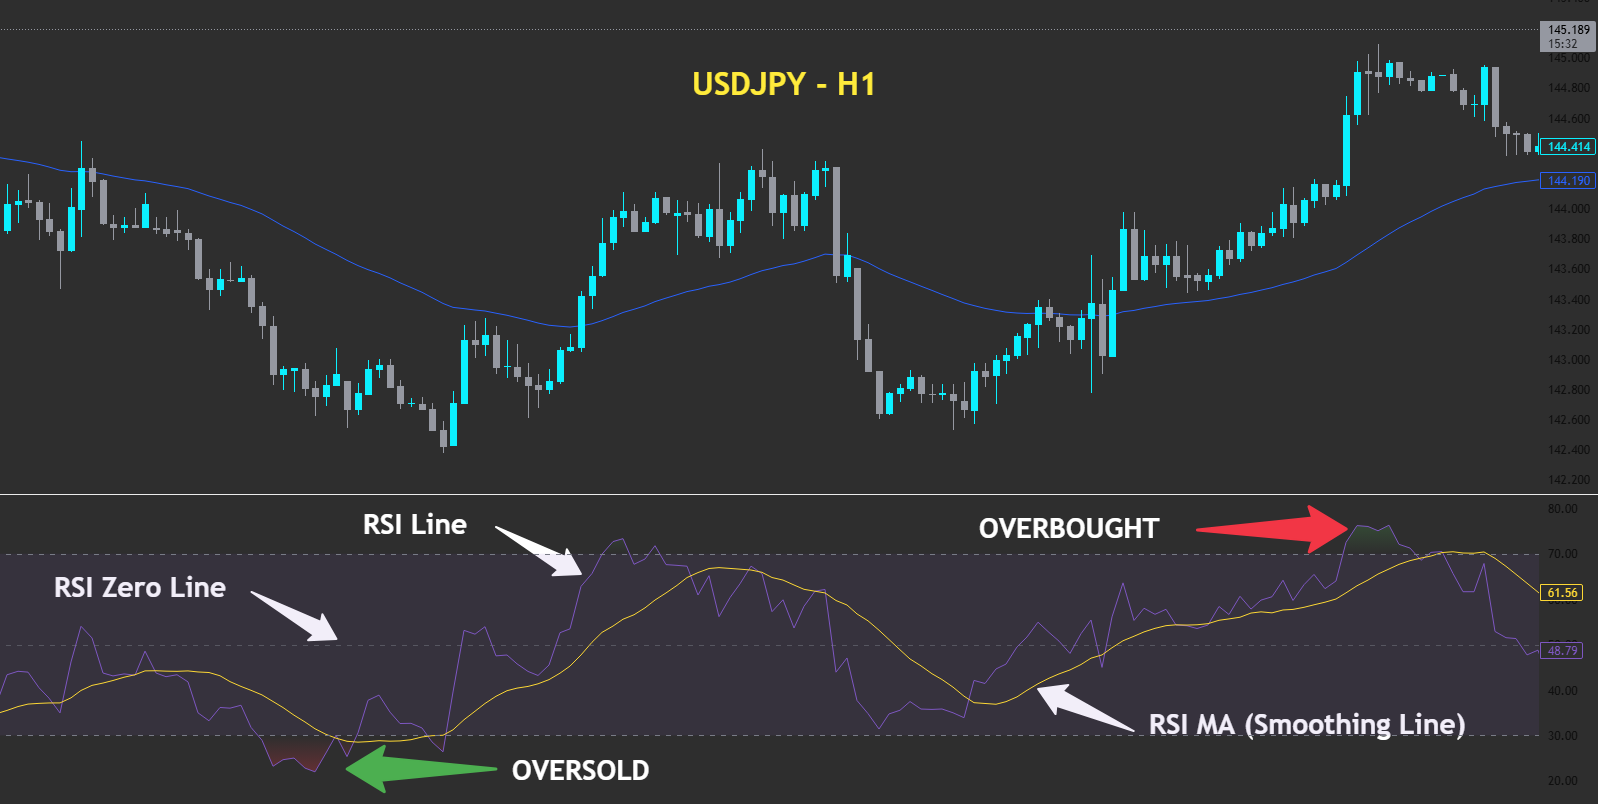
As illustrated above, the indicator visually maps out the asset’s momentum. Key components include the RSI line itself, a smoothing line (or RSI MA) that helps clarify the trend, and the critical overbought and oversold zones. These elements work together to provide a comprehensive picture of market dynamics.
This influential tool was developed by J. Welles Wilder Jr. and introduced in his foundational 1978 book, New Concepts in Technical Trading Systems. His work provided a more sophisticated way for traders to analyse market behaviour, and the RSI remains one of his most enduring contributions.
The core logic of the RSI is rooted in identifying momentum exhaustion. When an asset’s price moves up or down very rapidly, it eventually reaches a point where the trend may be losing strength. The RSI quantifies this momentum to help traders anticipate these potential turning points.
How the RSI Works: Formula and Interpretation
The RSI’s calculation quantifies an asset’s internal strength by comparing the average size of its upward price movements to its downward price movements. The standard lookback period is 14 periods. Understanding this simple comparison is key to interpreting the RSI’s behaviour and its signals.
The formula normalises this comparison into an oscillator that is easy to read. While the RSI calculation is automated on any modern price chart, its two-step process is straightforward. First, Relative Strength (RS) is determined, which is then converted into the final RSI value.
The formula is as follows:
| Step 1: Relative Strength (RS) = Average Gain / Average Loss | |
| Step 2: Relative Strength Index (RSI) = 100 – (100 / (1 + RS)) |
This formula normalises the comparison into the consistent 0-100 scale you saw in the chart example earlier. The key levels for interpretation—the 70 and 30 lines that define the overbought and oversold zones—were established by Wilder. He designed them not as absolute buy or sell signals, but as indicators of potential market momentum extremes that demand further analysis.
An RSI reading above 70 suggests an asset may be overbought. This indicates that rapid price appreciation could be reaching a point of exhaustion, making a corrective pullback more probable.
Conversely, an RSI reading below 30 suggests an asset is potentially oversold. This is caused by a sharp price decline that may be losing steam. Traders watch this zone for signs that selling pressure is weakening, which could precede a bullish rebound or relief rally.
The 50 level is the centerline and acts as a crucial momentum pivot. When the RSI is above 50, it indicates that average gains are greater than average losses, confirming bullish market momentum. An RSI value below 50 signals that bearish momentum is currently in control.
Types of RSI Trading Signals
The Relative Strength Index offers a variety of signals, from basic to advanced. It is crucial to remember that these are indicators of shifting market conditions, not direct commands to enter a trade. Each signal should be validated with other methods of analysis for confirmation.
1. Overbought & Oversold Signals
The classic interpretation is to consider selling when the RSI moves above 70 and buying when it falls below 30. This approach is most reliable in range-bound markets. In strong trends, however, an overbought reading can be a sign of persistent strength, not a reversal.
A more refined technique is to wait for the RSI to exit the extreme zone. For example, a more dependable sell signal occurs not when the RSI enters the overbought zone, but when it crosses back down below 70. This confirms that upward momentum is likely waning.
2. RSI Divergence
RSI divergence is a powerful leading signal that warns of a potential trend change. An RSI divergence occurs when there’s a mismatch between the direction of price and the RSI — indicating that momentum may be fading even if price continues in the same direction.
Divergence comes in two types: regular (reversal) and hidden (continuation). Both are critical tools for traders seeking to anticipate shifts in momentum.
Regular Divergence (Reversal)
- Regular Bullish Divergence: Price forms a lower low, but RSI forms a higher low.
Signal: Potential bullish reversal (momentum is weakening on the downside).
- Regular Bearish Divergence: Price forms a higher high, but RSI forms a lower high.
Signal: Potential bearish reversal (momentum is weakening on the upside).
These setups often precede sharp trend changes — especially when confirmed with candlestick patterns or support/resistance zones.
Hidden Divergence (Trend Continuation)
Hidden divergence signals that a pullback is likely to end and the trend may resume — making it useful in trending conditions.
- Hidden Bullish Divergence: RSI forms a lower low, but price forms a higher low.
Signal: Bullish trend continuation after a weak pullback.
- Hidden Bearish Divergence: RSI forms a higher high, but price forms a lower high.
Signal: Bearish trend continuation after a weak bounce.
Hidden divergences are often used by prop traders to time re-entries during pullbacks, especially in combination with range shifts or EMA zones.
RSI Divergence Cheat Sheet
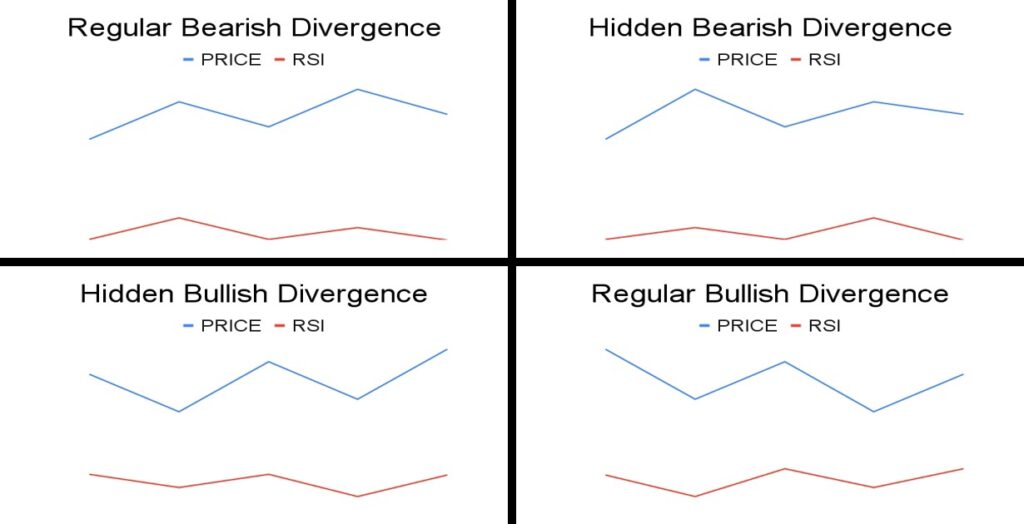
The diagram summarises both regular and hidden divergence types. Use it to quickly recognise patterns as they form on your charts.
3. Failure Swings
A failure swing is a strong RSI-only reversal pattern: momentum turns before price does.
It forms when the RSI:
- Fails to beat a previous extreme (high or low), and then
- Breaks the most recent swing point on its own indicator chart.
This sequence reveals that the dominant side (buyers in an up-move or sellers in a down-move) has run out of steam, tipping the odds toward a reversal.
| Pattern | Description | Trading Bias |
|---|---|---|
| Bullish failure swing | RSI bounces from oversold (< 30), does not make a lower low, then surges above its prior bounce high. | Long (momentum shifting upward) |
| Bearish failure swing | RSI retreats from overbought (> 70), does not make a higher high, then drops below its prior pullback low. | Short (momentum shifting downward) |
Below are cheat-sheet charts for quick reference:
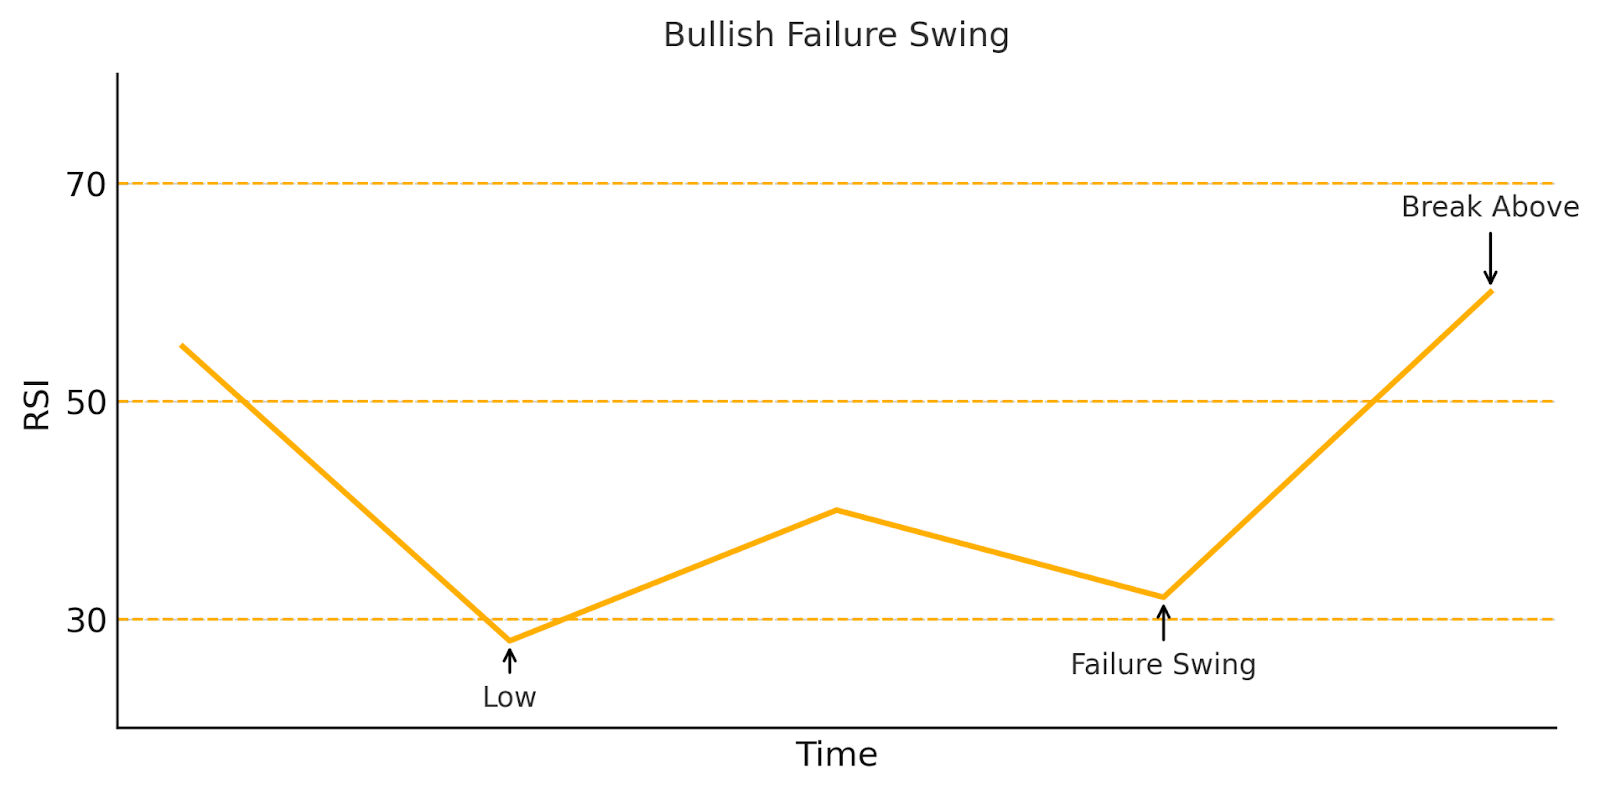
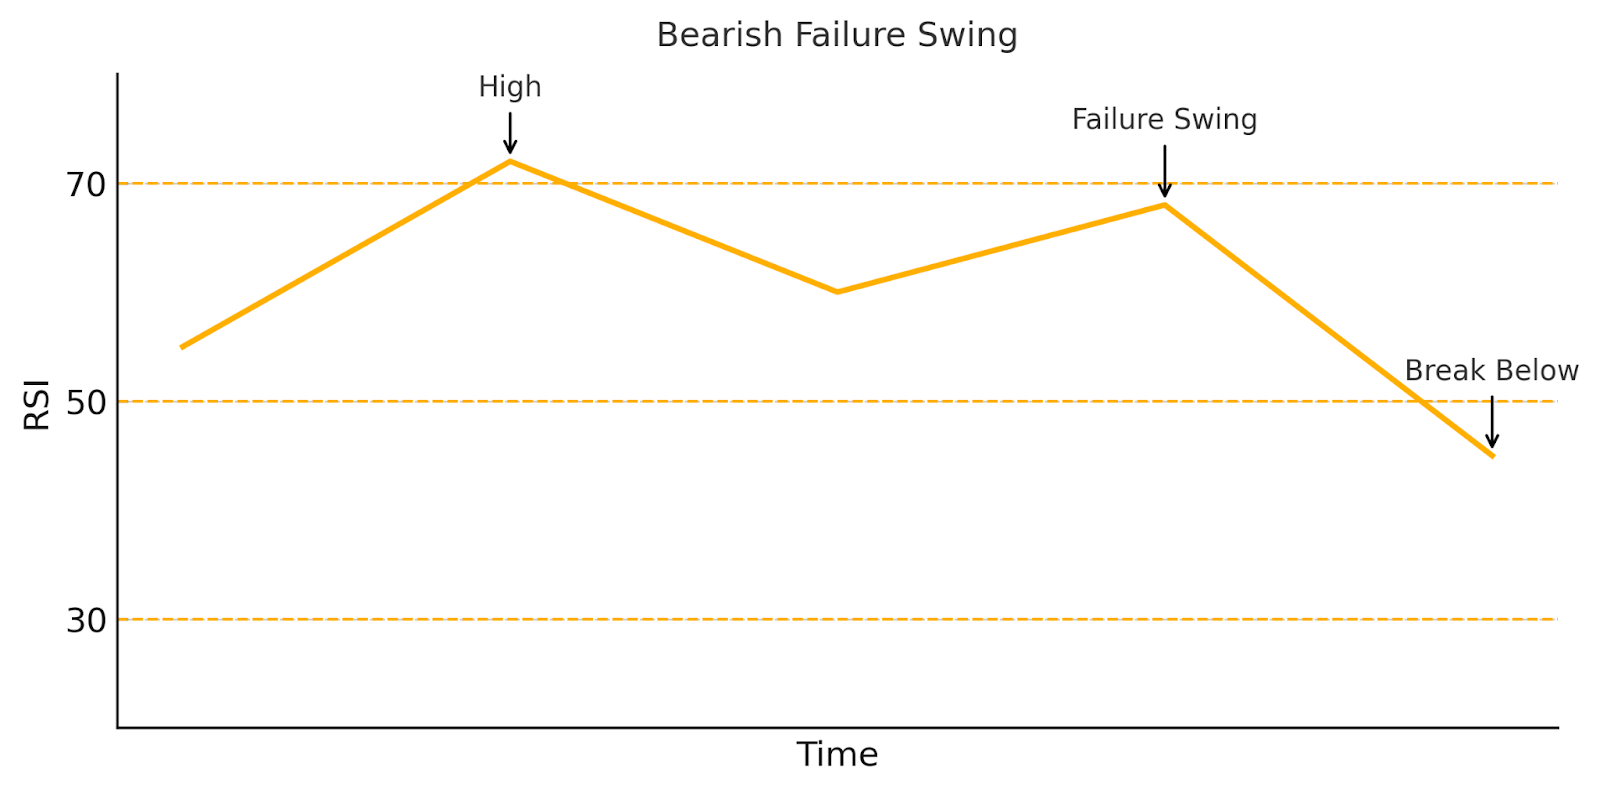
How to use them:
In live markets, wait for the break of the RSI swing point (arrowed “Break Below/Above” in the charts).
Combine the signal with price-action confirmation or a confluence level to reduce false triggers.
Best Practices and Real-World Use Cases
Mastering RSI signals is only the first step. True success lies in applying them within a professional framework built on sound principles. These best practices are designed to filter out low-quality signals, improve timing, and integrate the RSI into a disciplined, risk-managed trading approach.
The Golden Rule: Never Use RSI in Isolation
The most critical principle is that the Relative Strength Index should not be used as a standalone tool. Its signals are probabilistic and can generate many false signals if not confirmed by other forms of analysis. Relying solely on an RSI reading is a high-risk approach.
The Power of Confluence
The key to unlocking the RSI’s potential is confluence, seeking confirmation from multiple, non-correlated sources. A setup is strongest when several factors align. For instance, a bullish divergence becomes a high-probability trade when it also forms at a major support level and is confirmed by bullish price action.
Context is Everything: Trending vs. Ranging Markets
The interpretation of an RSI signal is entirely dependent on the broader market conditions. In ranging markets, where price oscillates between support and resistance, classic overbought and oversold signals are highly effective for identifying potential turning points near the range boundaries.
In trending markets, the RSI’s role changes. It should be used as a trend-confirmation and pullback-entry tool. Overbought or oversold readings are often signs of trend strength, not imminent reversals. Here, advanced techniques like range shifts are far more effective for timing entries.
Three Actionable RSI Trading Strategies
This section translates theory into practice with three distinct RSI trading strategies. Each incorporates confirmation from other technical indicators and includes objective, rule-based criteria for entries, stop-losses (SL), and take-profit (TP) targets to suit a trader’s specific risk tolerance.
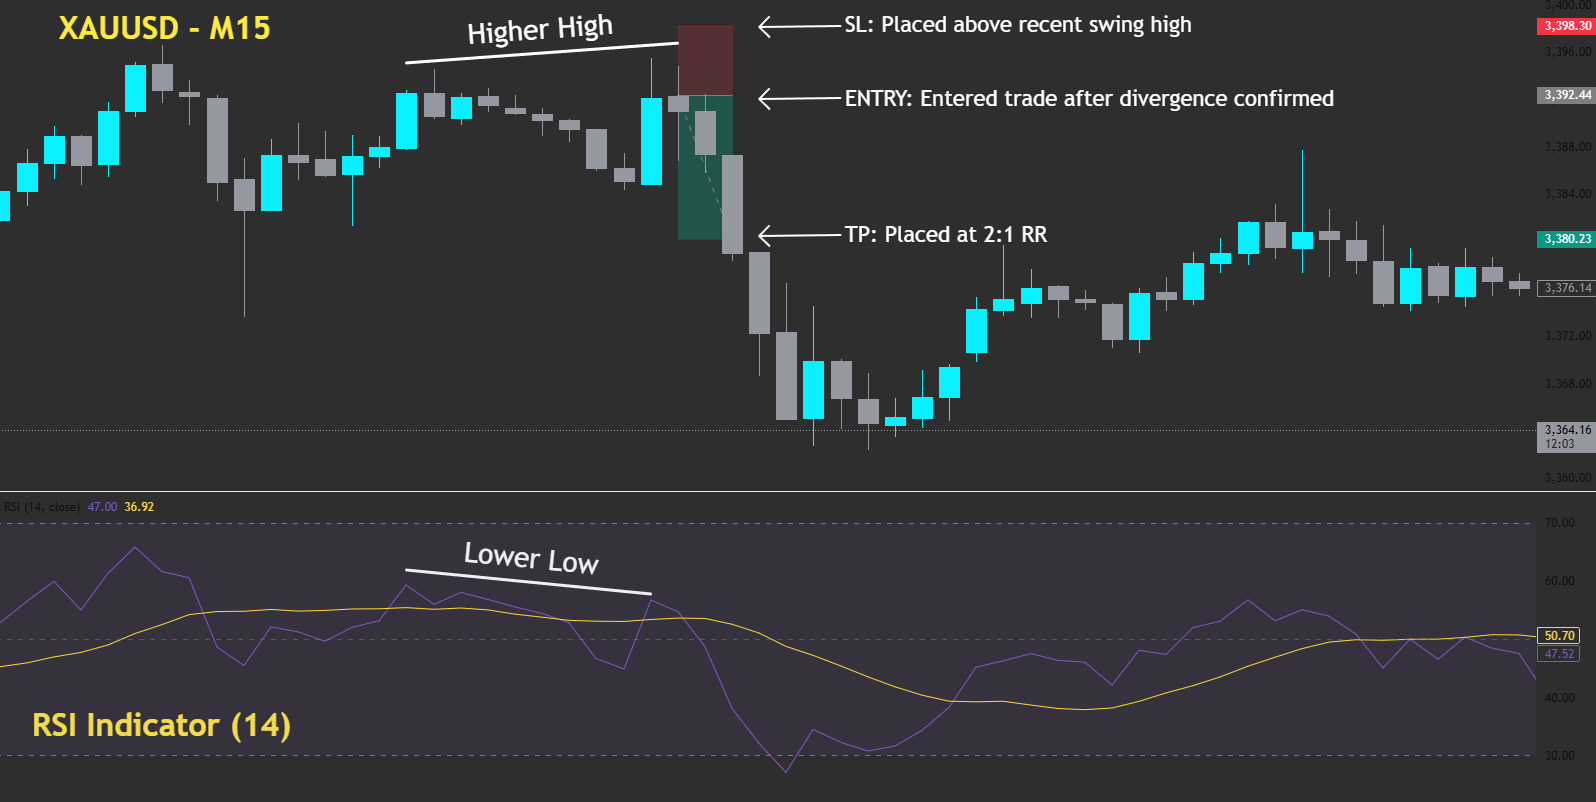
Strategy 1: RSI Bearish Divergence on XAU/USD (Reversal)
This reversal setup showcases a textbook bearish divergence between price action and the RSI, offering a high-probability short entry after momentum fails to support new highs.
Asset & Timeframe: XAU/USD, 15-Minute Chart
Methodology: Price forms a higher high, but the RSI prints a lower low, signalling a bearish divergence, a sign of waning bullish momentum. Once the divergence is confirmed, a short position is entered.
- Entry: After confirmation of RSI divergence.
- Stop-Loss (SL): Placed just above the recent swing high.
- Take-Profit (TP): Placed at a 2:1 reward-to-risk (RR) ratio from the entry point.
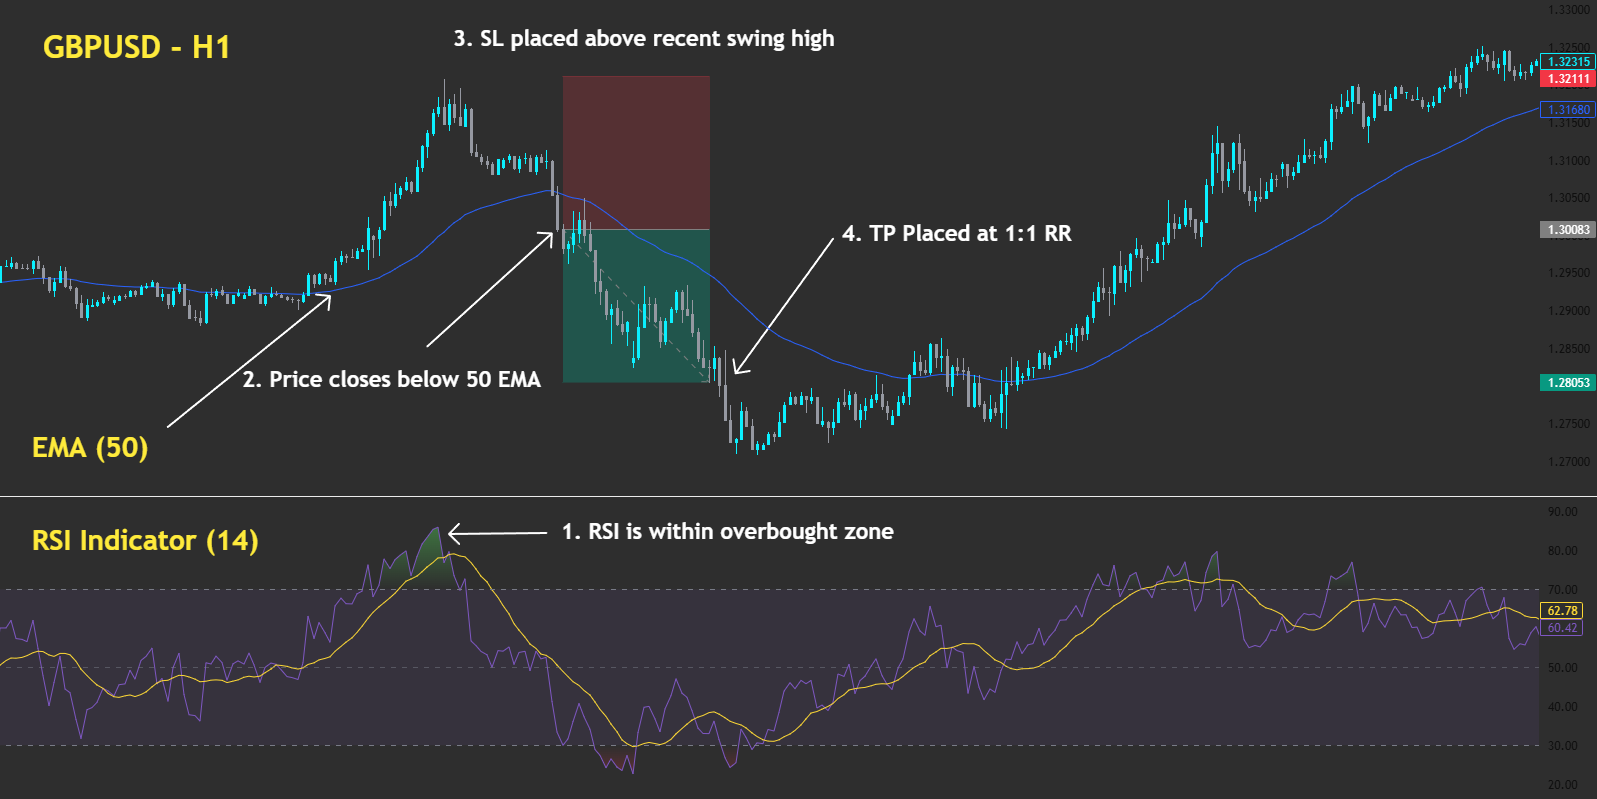
Strategy 2: EMA Break and RSI Rejection (Pro-Trend Short)
This strategy identifies a potential trend reversal or early pro-trend entry using two conditions: an overbought RSI followed by a price breakdown through the 50-period EMA.
Asset & Timeframe: GBP/USD, 1-Hour Chart
Methodology: The RSI enters the overbought zone (above 70), indicating potential bullish exhaustion. Shortly after, price closes below the 50 EMA, signalling a possible shift in momentum. This confluence sets up a potential short entry.
- Entry: On the candle that closes below the 50 EMA.
- Stop-Loss (SL): Placed above the recent swing high.
- Take-Profit (TP): Placed at a 1:1 reward-to-risk (RR) ratio or at a nearby support level.
This setup is ideal for traders looking to time early trend shifts while maintaining a rule-based approach to risk management.
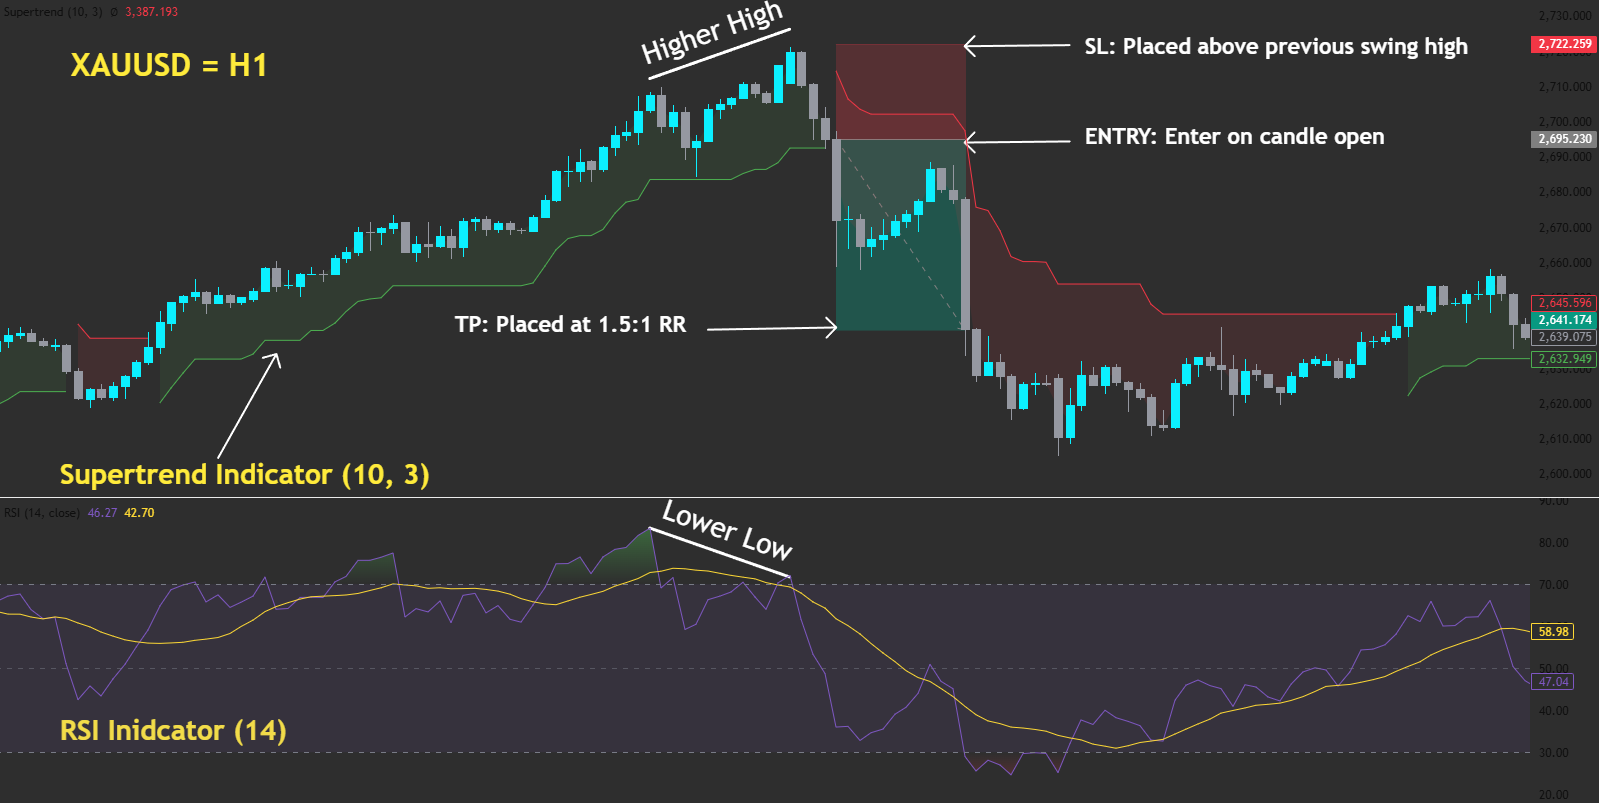
Strategy 3: RSI Divergence with Supertrend Confirmation
This strategy blends a momentum-based signal with a volatility-filtered trend confirmation. First, the RSI signals weakening bullish momentum via a bearish divergence. Then, the Supertrend indicator confirms the trend reversal, enabling a well-timed short entry with reduced risk.
Asset & Timeframe: XAU/USD (Gold), 1-Hour Chart
Methodology: Start by identifying a bearish RSI divergence — price makes a higher high while the RSI prints a lower low, indicating momentum loss. As the divergence is confirmed, wait for the price to begin trading below the Supertrend line, which flips from green to red.
- Entry: On the candle that confirms both RSI divergence and Supertrend trend flip.
- Stop-Loss (SL): Placed just above the previous swing high.
- Take-Profit (TP): Set at a 1.5:1 reward-to-risk (RR) ratio, aiming for a logical support level below.
Closing Thoughts on the Relative Strength Index (RSI)
The Relative Strength Index has remained a premier technical indicator for decades for one simple reason: it is both robust and remarkably adaptable. Its evolution from a basic reversal tool into a sophisticated instrument for analysing trend strength and market momentum is a testament to its depth.
Its true power is unlocked when traders move beyond simple signals and master its nuanced applications like divergence and range shifts. For traders managing risk on a funded account, using confirmed, high-probability RSI setups is a hallmark of the discipline required to perform professionally.
Ultimately, the RSI is not a standalone system. Its value is realised when it is used as a critical piece of evidence within a broader trading plan built on the principle of confluence. When an RSI signal aligns with key price action, the probability of a successful outcome increases dramatically.
We encourage traders to apply these concepts with discipline. Practice identifying these signals and testing these trading strategies in a risk-free environment. To further develop a professional approach, explore FXIFY’s educational resources and learn more about our funded challenges, which provide the ideal platform to apply such strategies.
Advantages of Trading with the RSI Indicator
Understanding an indicator’s strengths is key to knowing when to apply it. The RSI is popular for several reasons, primarily its adaptability and the clarity of its signals. The following table summarises its main advantages for a trader.
| Advantages (Strengths) | Description |
|---|---|
| Versatility | The RSI can be used to identify potential reversals, confirm ongoing trends via range shifts, and gauge momentum, making it highly adaptable to various market conditions and trading styles. |
| Early Warning System | Advanced signals like RSI divergence and momentum trendline breaks can provide leading indications of a potential trend change, often before the shift is obvious on the price chart itself. |
| Clear Overbought/Oversold Levels | In range-bound markets, the 70 and 30 levels provide clear, quantifiable thresholds for identifying potential market extremes where price may be statistically likely to revert to its mean. |
| Objective, Rule-Based Signals | The RSI provides a specific value from 0 to 100. This helps traders create objective, rule-based systems, which is essential for removing emotion from trading decisions and managing risk effectively. |
| Wide Availability & Popularity | As a standard indicator on virtually every trading platform, the RSI is easily accessible. Its popularity also means its key levels are watched by many market participants simultaneously. |
Disadvantages of Trading with the RSI Indicator
No indicator is perfect. For a trader focused on capital preservation, understanding an indicator’s limitations is just as important as knowing its strengths. This balanced view is essential for effective risk management and building realistic expectations.
| Disadvantages (Weaknesses) | Description |
|---|---|
| Context-Dependent Interpretation | The meaning of an RSI signal changes drastically between trending and ranging markets. An overbought signal that is useful in a sideways market can be a trap in a strong uptrend. |
| Prone to False Signals | In choppy markets, the RSI can whipsaw frequently, generating misleading signals. In strong trends, classic overbought/oversold readings are notoriously unreliable for signalling reversals. |
| Can Remain at Extremes | During powerful, sustained trends, the RSI can stay in overbought or oversold territory for extended periods. Trading against the trend based on these readings can lead to significant losses. |
| Lagging Component | Because the RSI calculation uses a moving average for smoothing, it has an inherent lag. It may not react instantly to sharp, sudden price movements, which can sometimes lead to delayed signals. |
| Requires Confirmation | RSI signals are significantly less reliable when used in isolation. They must be confirmed with other tools like price action, chart patterns, or other indicators to be considered high-probability setups. |
FAQs
What are other technical indicators similar to the Relative Strength Index?
Other popular momentum oscillators similar to the RSI include the Stochastic Oscillator, the Williams %R, and the Moving Average Convergence Divergence (MACD), each of which measures market momentum in a unique way.
How reliable are overbought and oversold signals?
The reliability of these signals is highly dependent on market conditions. They are most effective for identifying turning points in ranging markets and are generally unreliable for signalling reversals in strong, sustained trends.
How reliable are RSI divergences?
RSI divergences are considered powerful leading signals that indicate weakening momentum. To be reliable, however, they must be confirmed by other technical factors, such as a corresponding price action pattern or a break of a key trendline.
What timeframe should I apply the RSI indicator on?
The best timeframe depends entirely on your trading style, with lower timeframes suiting day traders and higher timeframes preferred by swing traders. A widely used best practice is to perform multi-timeframe analysis to align your entries with the primary trend.