Shooting Star Candlestick Strategies for Trading Bearish Reversals
Master the Shooting Star candlestick pattern and enhance your technical analysis with actionable tips on how to trade this bearish reversal pattern!
Learn all about the powerful Shooting Star candlestick pattern, a key signal for predicting potential bearish reversals in the forex markets. This guide covers everything from pattern identification to practical trading strategies.
What are Shooting Star Candlestick Patterns?
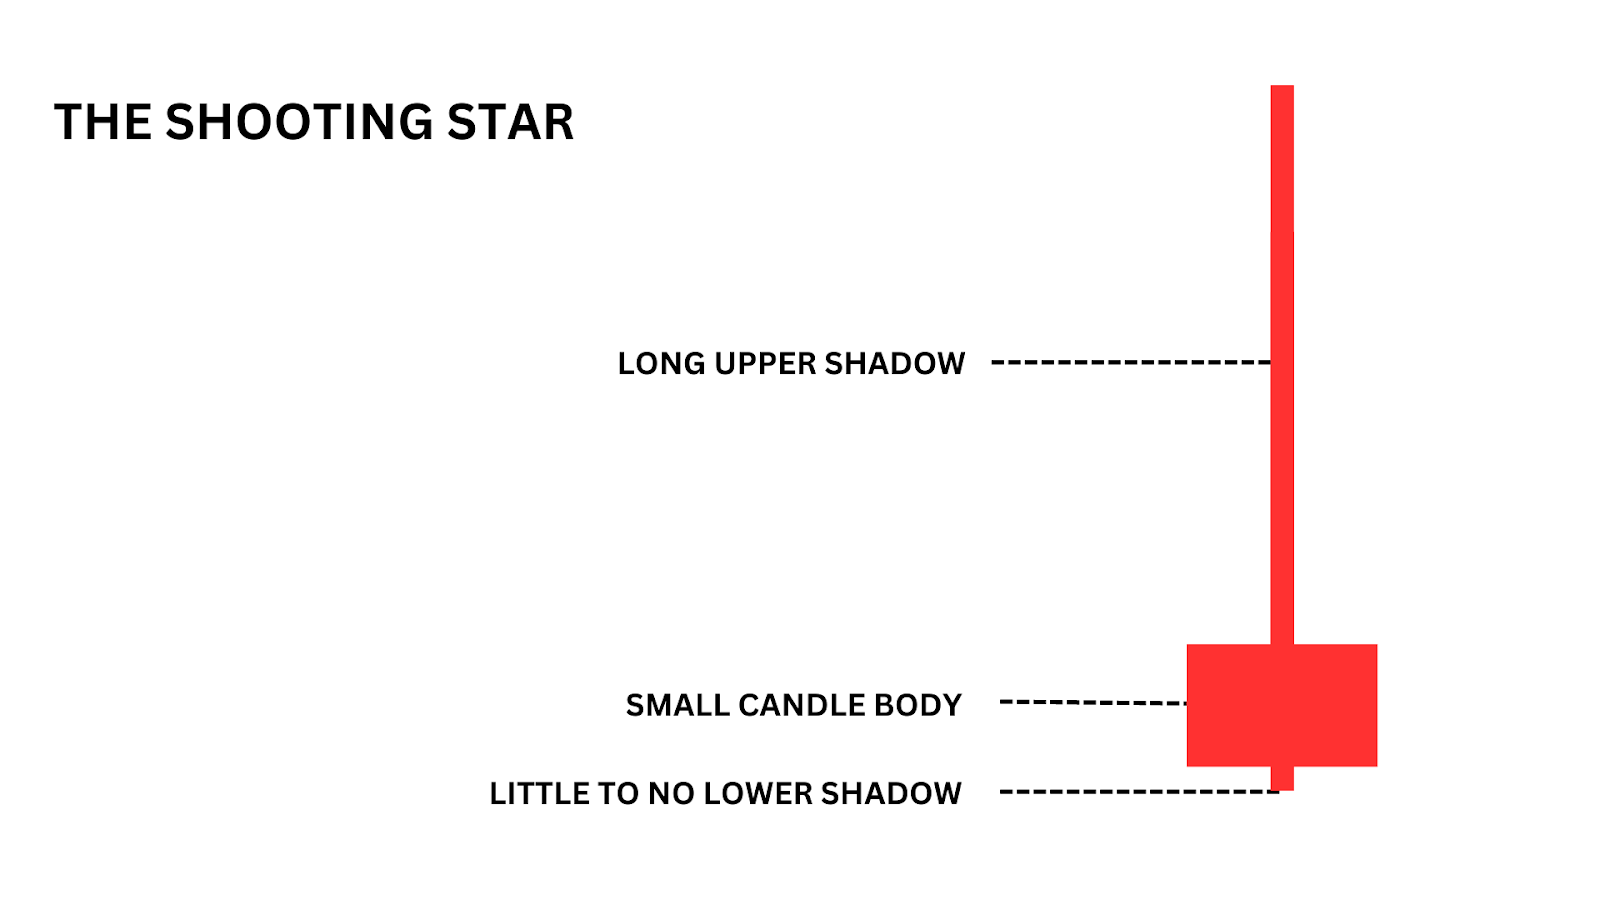
The Shooting Star candle is a bearish reversal candlestick pattern, and is recognised by its small lower body and a long upper shadow which is usually at least twice the length of its body. It will appear during an uptrend as a warning of a potential trend reversal.
The presence of a shooting star shows that buyers are losing strength, and that sellers might take control, leading to a price decline.
Examples of Shooting Star Candlesticks
The Shooting star is a versatile and powerful indicator that forms on all time frames and across every market: the key to spotting it is to look for it in uptrends!
Here are some practical examples from real charts on different timeframes.
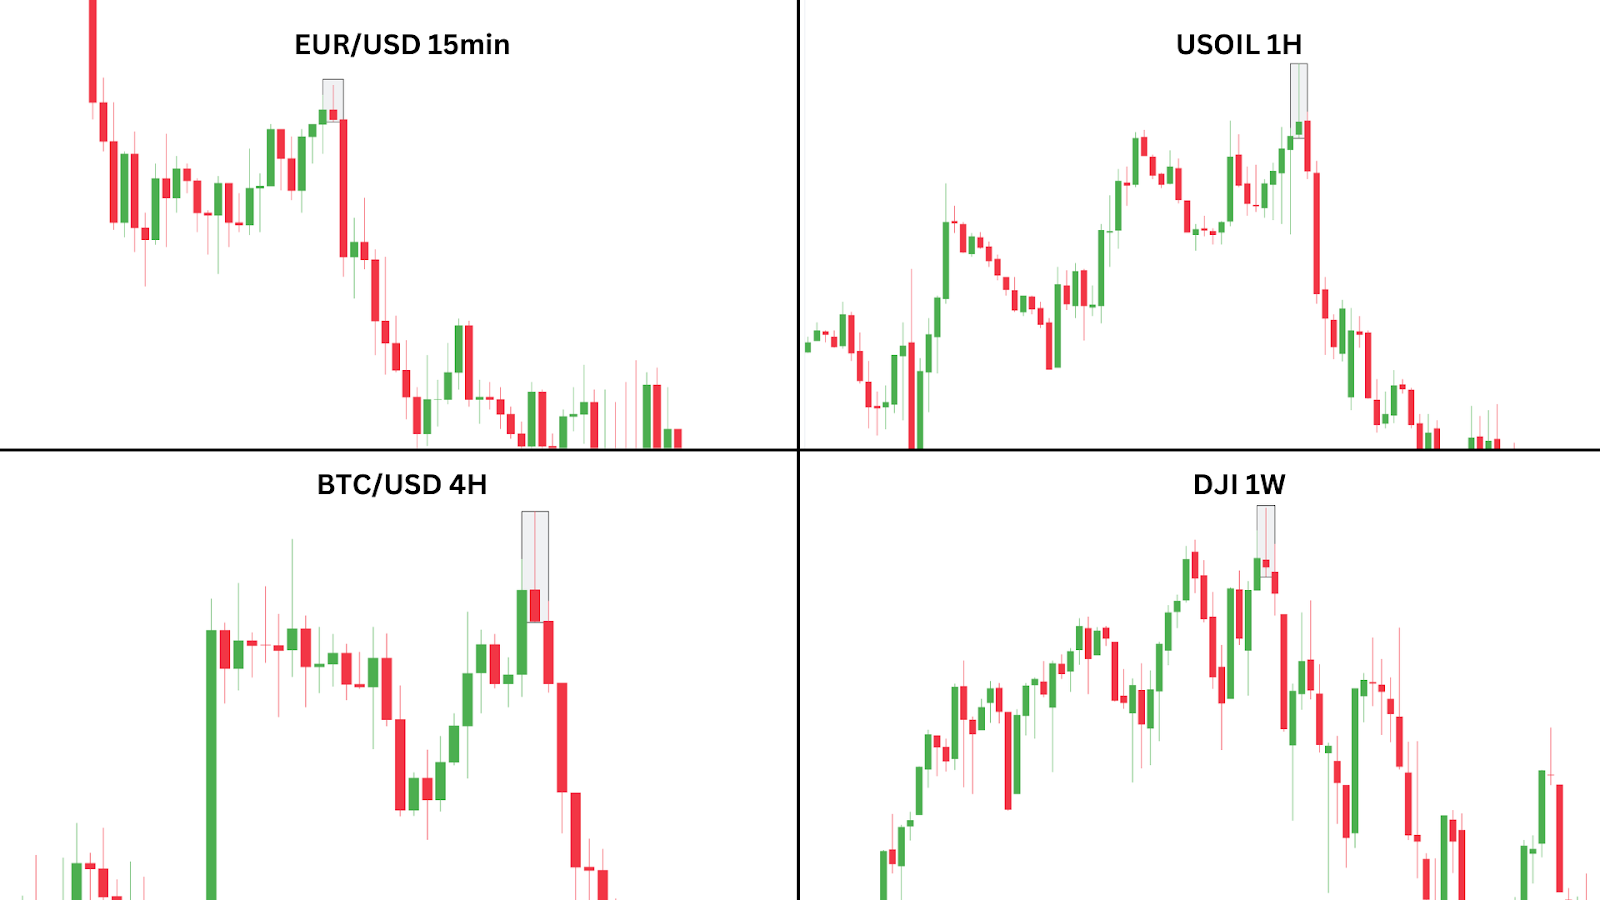
Like with any technical pattern, the shooting star doesn’t always look exactly as it does in the textbooks.
The shooting star occurs in uptrends, or at the highs of a price chart as a reversal signal.
Take the EUR/USD 15 min example above – the shooting star here is acting as a reversal pattern, ending a short-term uptrend during an extended downtrend, but on the Dow Jones Weekly, it simply acts as a strong reversal after sweeping a previous swing high.
Let’s look at this Dow Jones Weekly candle closer.
Case Study: Shooting Star on DJI Weekly (US30)
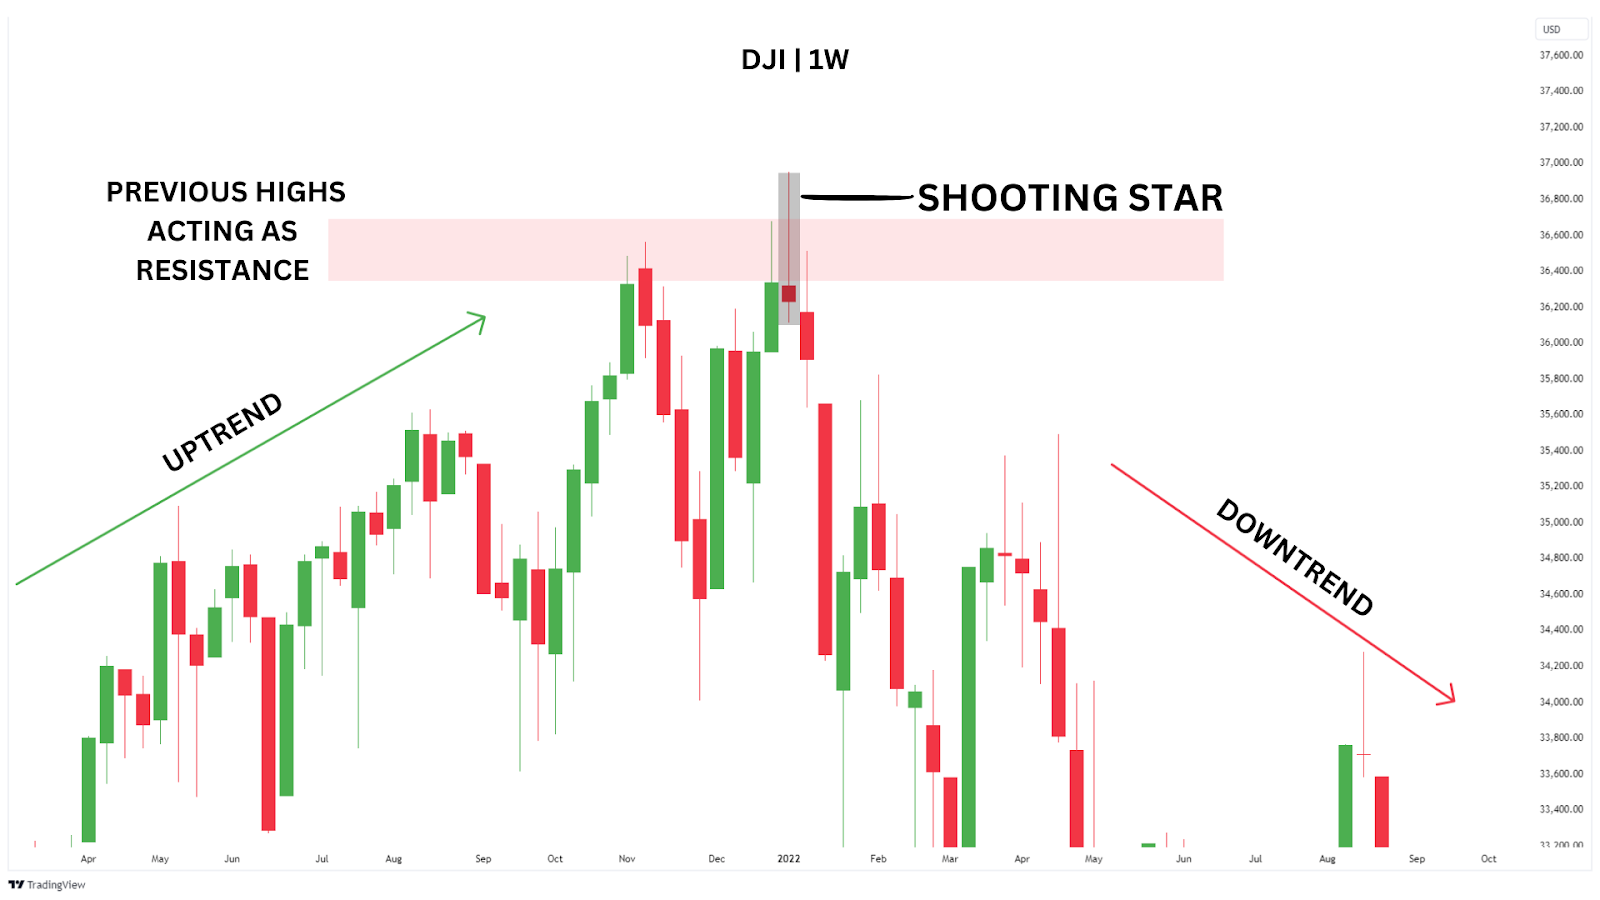
This weekly candle has all the characteristics of a shooting star. Long upper shadow, small body, and little, to no lower shadow.
It’s also at a key resistance level, and has created a new swing high with its wick. A key resistance level is simply a point where the market struggles to move higher, often leading to a reversal or pause in the uptrend.
If price has been rejected several times from the same area, this is a key resistance level.
Now that it has bounced off the key resistance level and closed back within the range of the previous weekly candle, selling pressure is confirmed by the next weekly candle closing bearishly.
As this is on a higher time frame, the significance of this shooting star is higher than if we were to see this on the 15 minute chart.
Now let’s jump into the fun part – trading shooting star candlesticks!
How Can You Trade Shooting Star Candlesticks?
Trading shooting star candlesticks involves recognising the pattern at the end of an uptrend and taking appropriate actions based on its bearish reversal signal.
There’s no single correct way to trade this chart pattern, but generally, it is more effective to trade the Shooting Star in combination with other bearish indications.
Like with anything in trading, the Shooting Star isn’t 100% accurate in providing a reversal signal, but we can show you a few effective strategies which improves the reliability of the Shooting Star.
Method One: Trading the Shooting Star with a Pullback Rally
In this method, we will be utilising the power of shooting stars within downtrends to signal when to enter/re-enter short positions.
As we have seen in the Dow Jones example, shooting stars can mark tops and indicate reversals, but more often than not in sustained uptrends and on lower time frames, they offer false signals.
Let’s take a look at BTC/USD on the 5 minute chart to see how shooting stars are especially effective in downtrends.
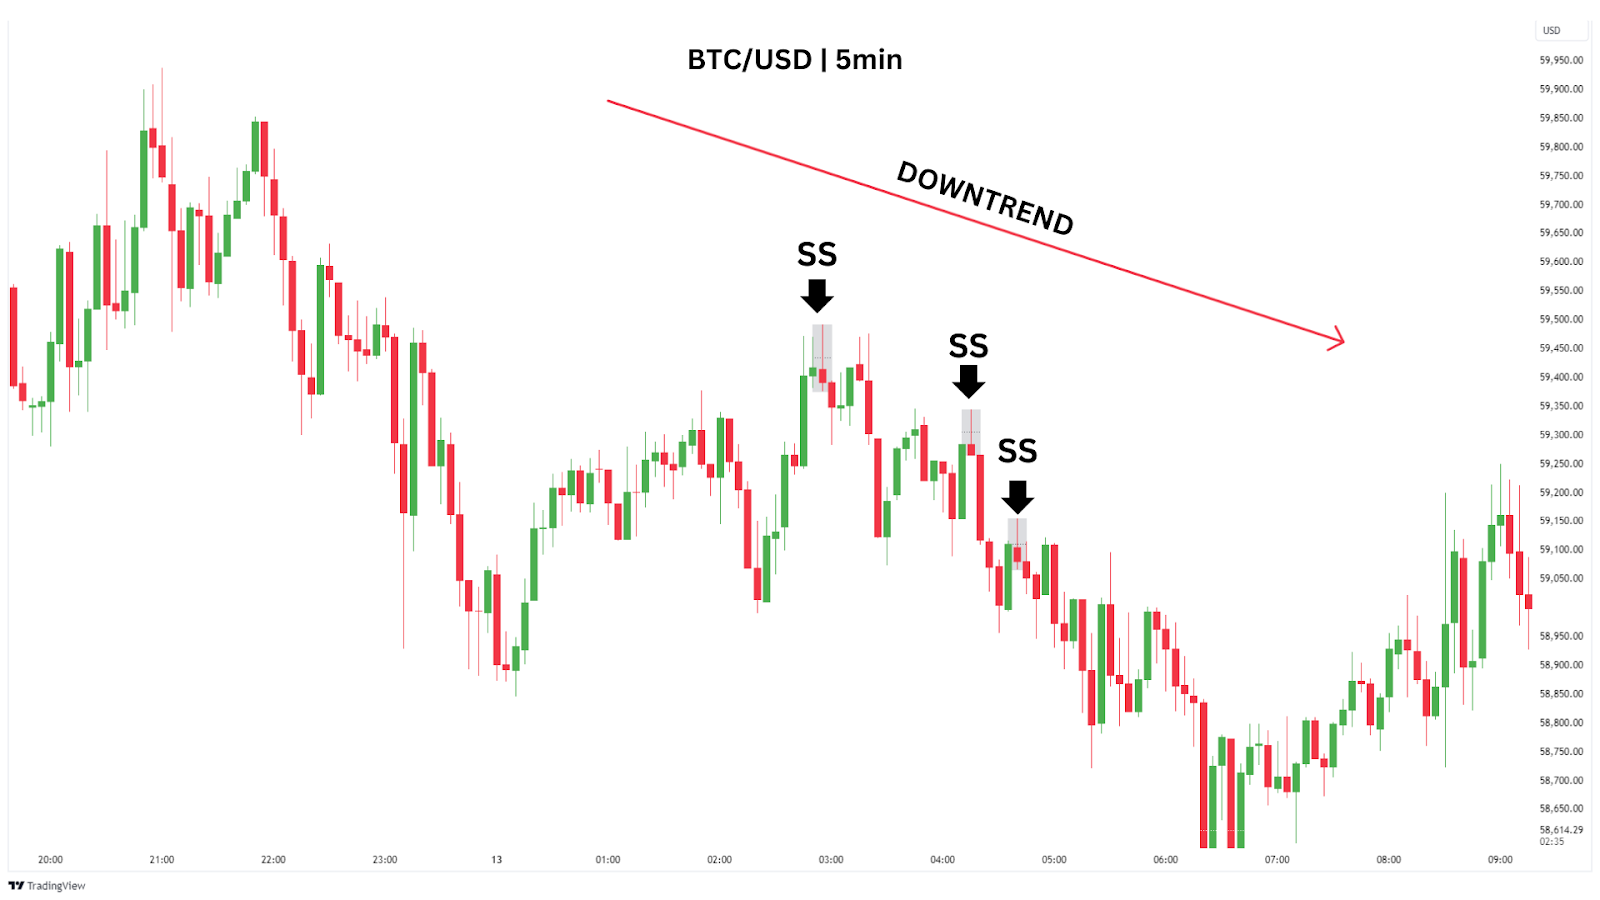
Each of these shooting stars marked the tops of their respective pullbacks/rallies within the sustained downtrend – giving traders the opportunity to enter successful short positions.
All three of these shooting stars are suitable for this strategy, but so our chart’s are clear and easily readable, we have just traded the first and third shooting star.
Notice the rallies before the shooting stars we are trading, these will be important points for our take profit areas.
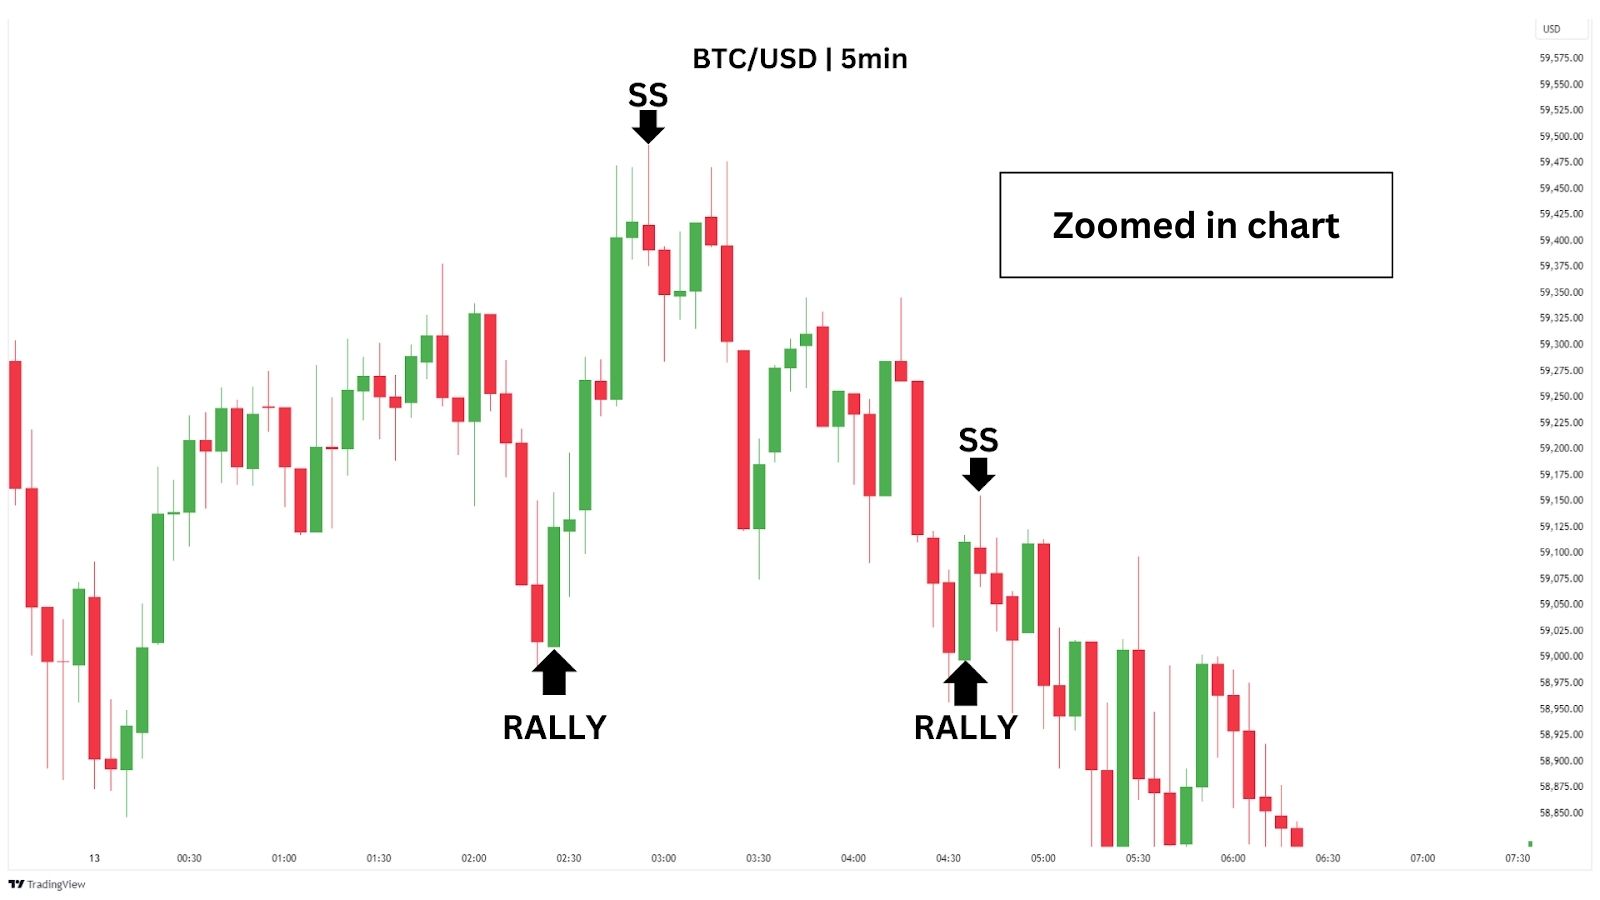
To trade these shooting stars, place your limit entries on the BODY CLOSE of the shooting star, with the stop loss at the high of the shooting star. Our take profits will be the most recent pivot swing low that has yet to be taken out by price action.
A pivot swing low is simply the lowest point reached during a price move before the market starts to rise again (in this case, where our rallies commenced!)
For clarity, see the image below.
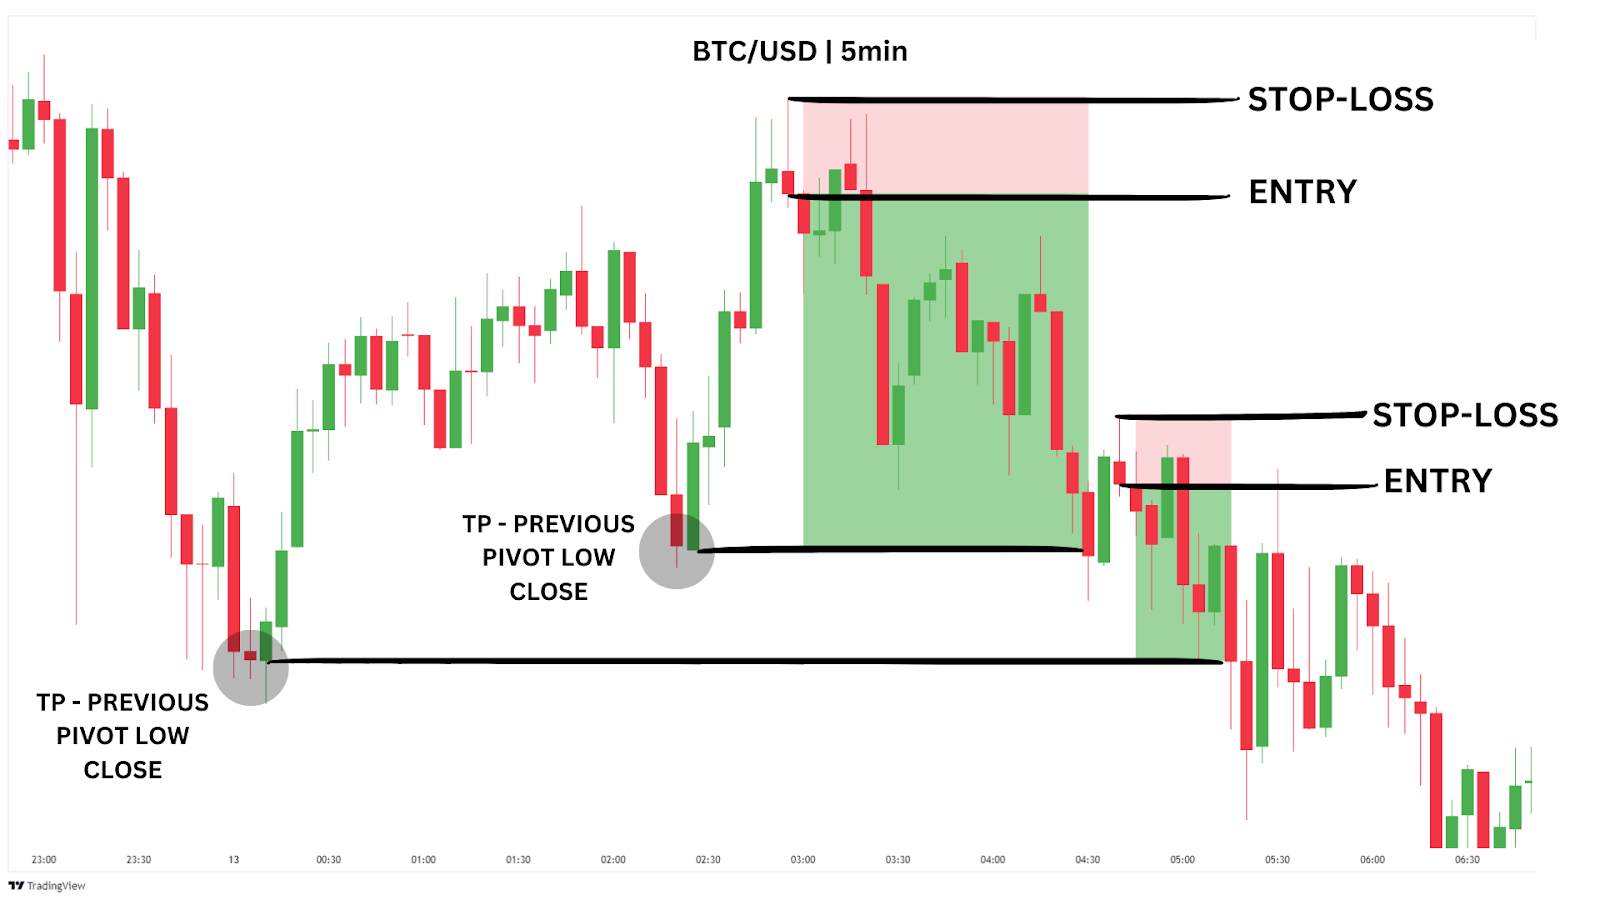
Both these trades would have hit our take profits at the pivot lows, which provided 3.79 and 2.54 risk-to-reward (RR) – all in less than a few hours! This just shows how strong this trading method can be when utilised IN A BROADER DOWNTREND.
Let’s take a look at how it may perform in a broader uptrend on the same time frame.
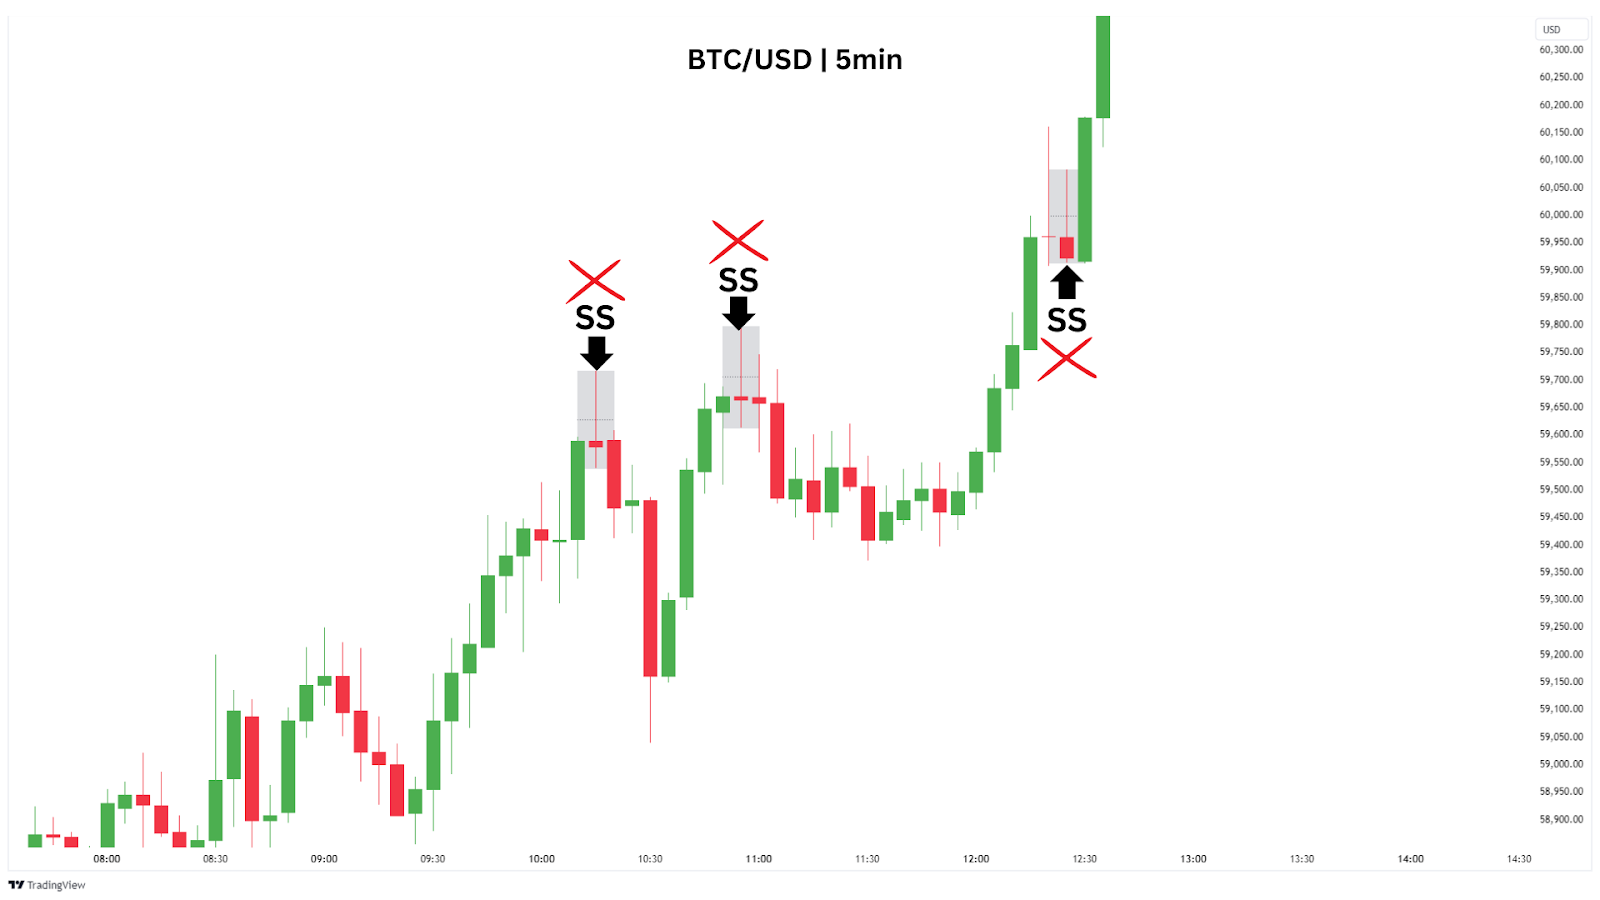
Although all of these shooting star candles were valid, none of the recent pivot lows would have been hit in our take profits before price took out the shooting stars high – resulting in three losses in a row.
When combined with an understanding of the asset’s key levels and general market trends, this strategy can be powerful for scalping.
Trading Strategy Summary:
- Entry Point: Enter a short position by placing a sell order at the close of the Shooting Star’s body, specifically in a broader downtrend. This ensures you are aligning with the overall market momentum.
- Stop-Loss: Place your stop-loss just above the high of the Shooting Star’s wick to manage your risk effectively and protect your capital from false signals.
- Profit Target: Aim for the nearest untested swing low as your profit target. This level often serves as a strong support area where price may reverse, allowing you to maximise your trade’s potential reward.
| Advantages: Provides a clear bearish reversal signal, making it easy to spot potential trend changes, works effectively within downtrends, increasing the likelihood of profitable trades. |
| Disadvantages: May produce false signals in strong uptrends, leading to potential losses, less reliable in sideways or choppy markets, where clear trends are absent. |
Method Two: Trade Shooting Stars with Exponential Moving Average
This method combines the power of the Shooting Star pattern with Exponential Moving Averages (EMAs) to improve your trading accuracy.
EMAs (Exponential Moving Averages) calculate the average price of an asset over a set number of days, but they focus more on recent prices to react faster to changes. The longer the time period of the EMA, like the 200-day EMA, the more stable and reliable it becomes.
Since the 200-day EMA averages a large amount of data, it often acts as a strong support or resistance level because many traders use it as a key reference point. When the price reaches this level, it’s more likely to react, either bouncing off it or reversing direction.
By using multiple EMAs, you can confirm whether the Shooting Star is forming in a suitable market environment and increase the probability of a successful trade.
This is where the EMAs come in, their positions in relation to each other will help us determine if the overall trend is bearish or bullish. We will only look to trade when EMAs are signalling a bearish condition.
The four EMAs we will use are 20/50/100/200, which will be coloured red, orange, light blue, and purple on our chart. A clear signal for a downtrend is when the 200 EMA is positioned above the 20 EMA, opening up trade opportunities with the Shooting Star pattern.
When a rejection occurs at an EMA and forms a Shooting Star, we’ll have our short trade entry.
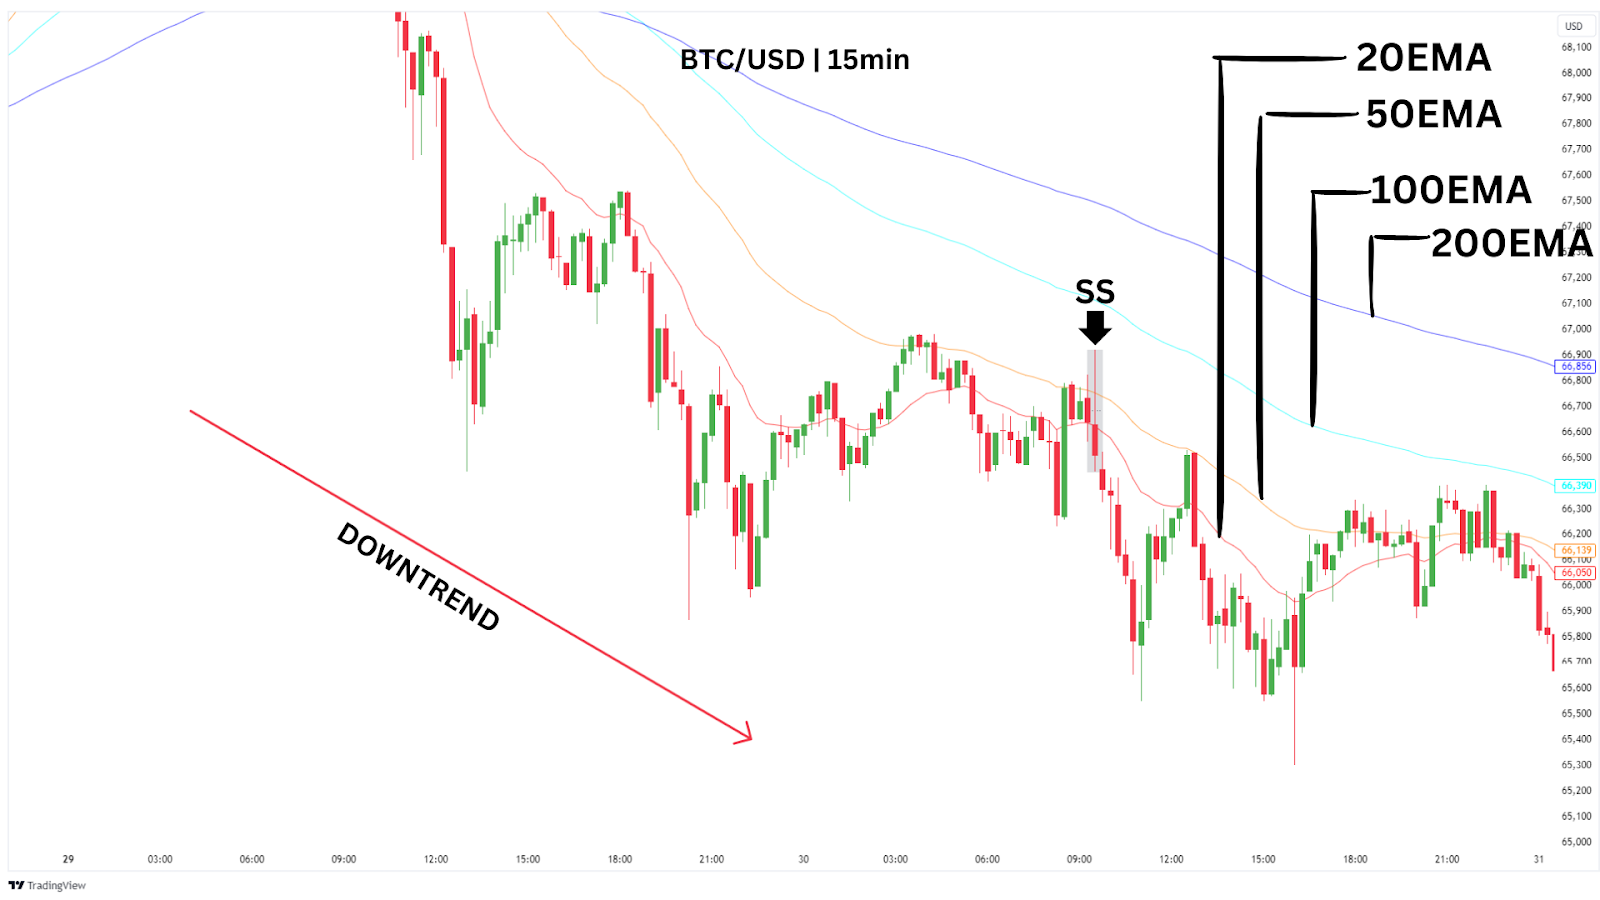
Let’s take a look at this bearish trend on Bitcoin with a Shooting Star pattern that forms at the key EMAs (particularly the 20 or 50 EMA). As you can see, the 200 EMA is above the 20 EMA and the shooting star is rejected from the lower key EMAs.
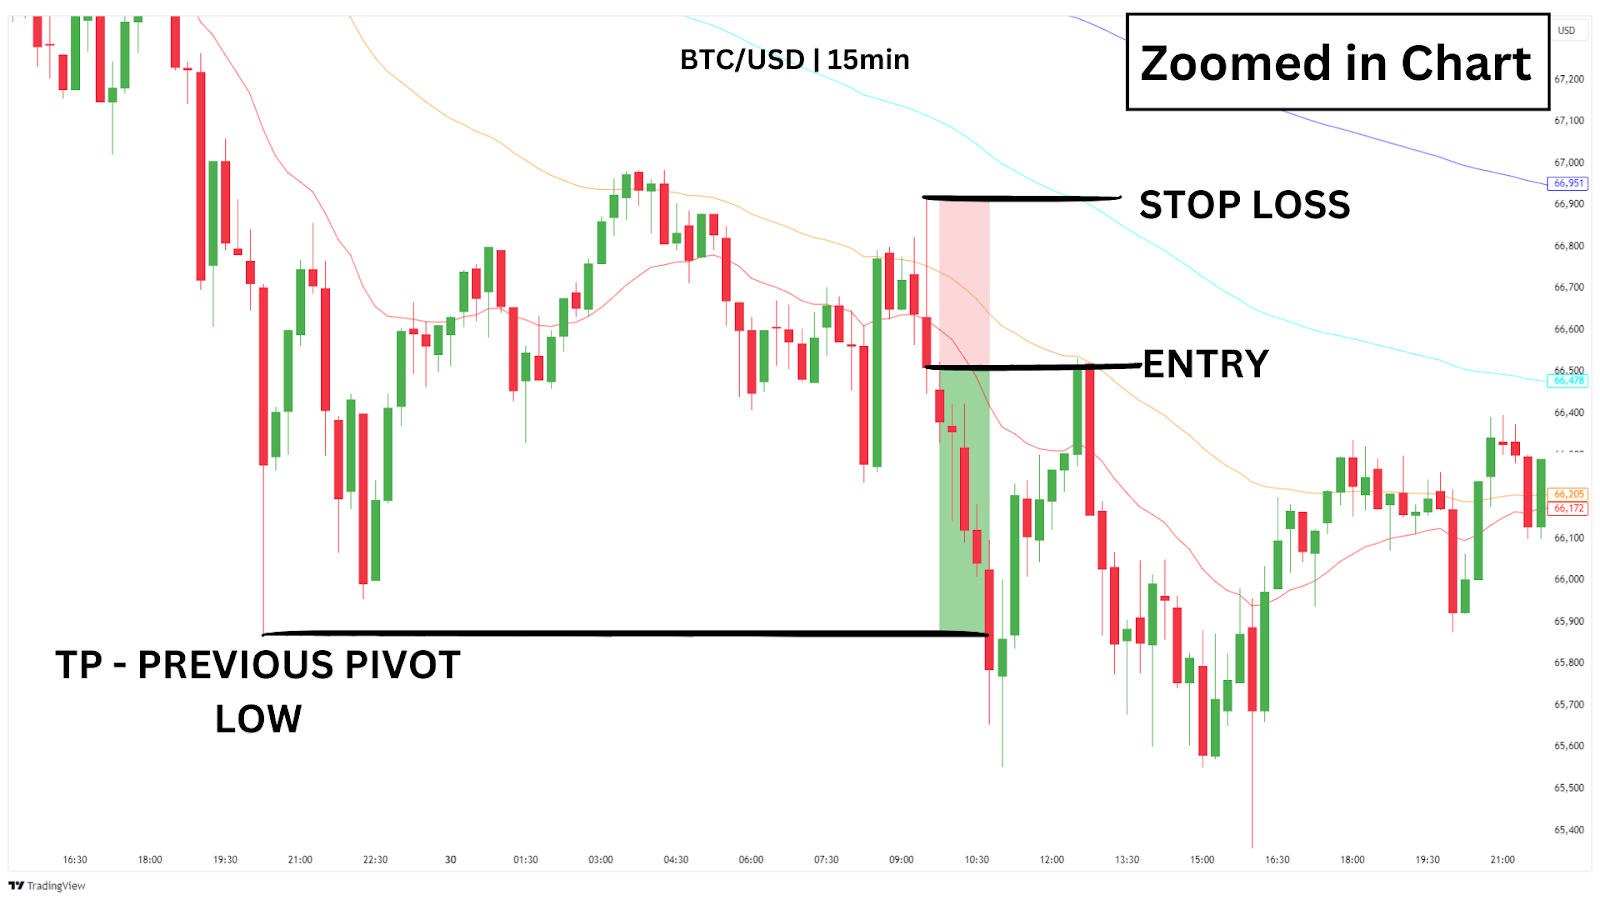
After identifying the Shooting Star near the EMAs, let’s look to enter our short trade on a clear rejection!
Our short trade will be similar to method one, where we enter a short position at the close of the bearish confirmation candle. The stop-loss should be set just above the high of the Shooting Star’s wick to protect against false breakouts and our take profit is the next significant support level, which in this case, is a recent swing pivot low.
As we can see, we made a profit of 1.5RR in just over 1 hour.
Alternatively, if the next significant support level seems too far away, it’s a smart idea to settle for a risk-to-reward setup of 1:2. This approach ensures you’re locking in profits while maintaining good risk management.
It’s important to remember that this strategy should be used in DOWNTRENDS, where a consistent lower high and lower low is being formed. Let’s look at what happens when we try to trade shooting star patterns in uptrends where the 200 EMA is not above the 20 EMA.
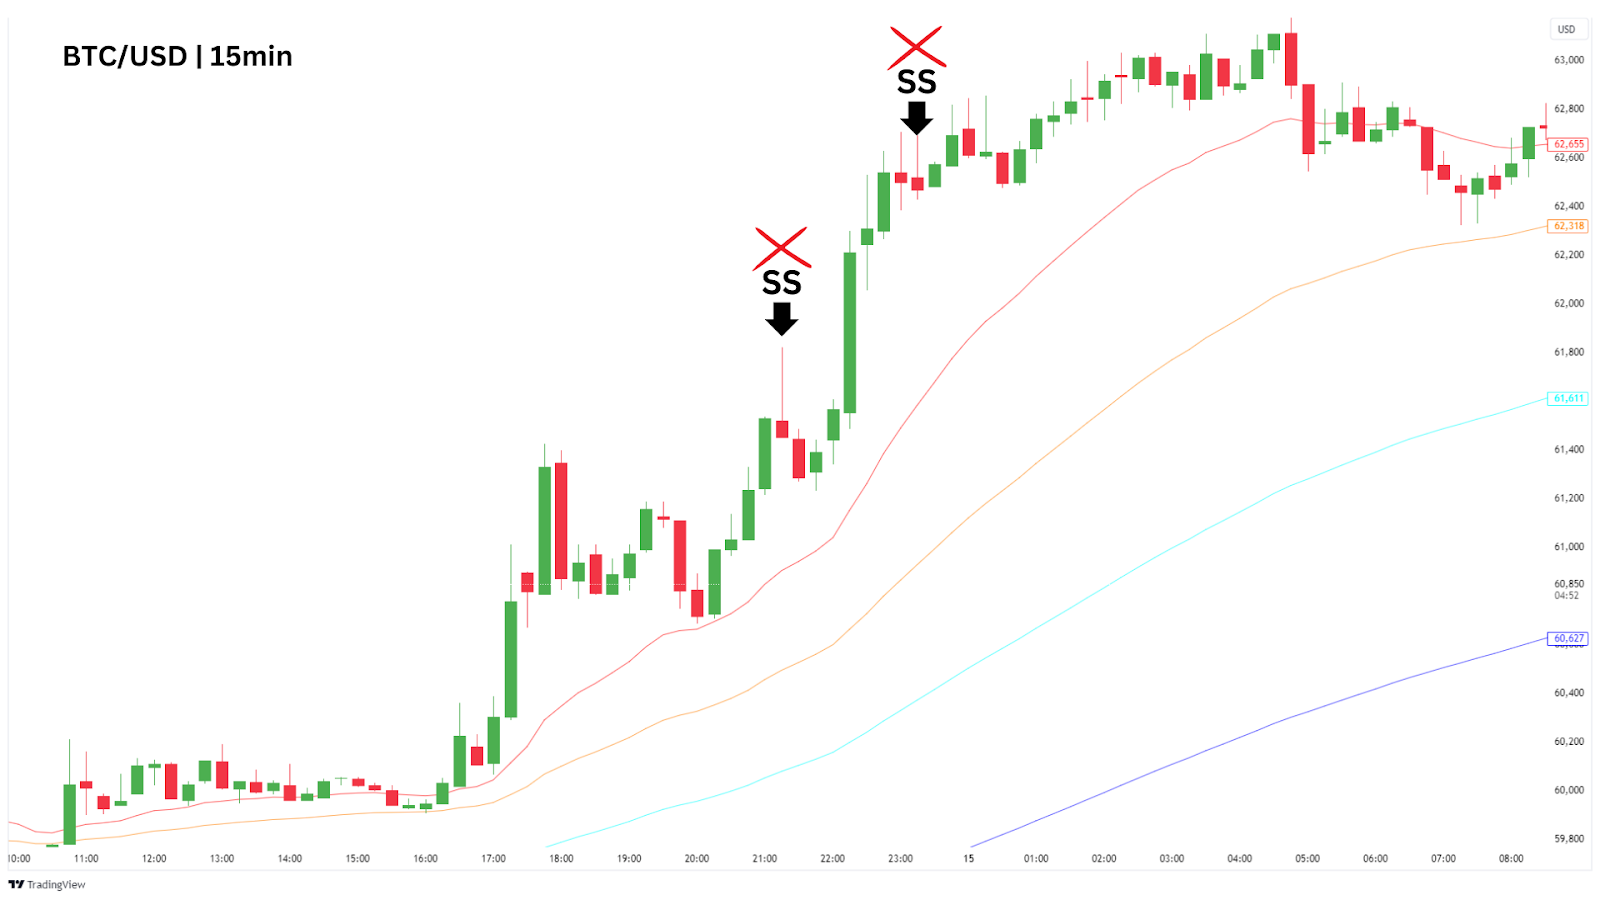
As we can see, both of these shooting star patterns would not have provided profitable trades by taking out nearby levels. Remember to follow the plan!
Trading Strategy Summary:
- Entry Point: Enter a short position at the close of the Shooting Star if it forms near key EMAs in a downtrend.
- Stop-Loss: Place your stop-loss just above the high of the Shooting Star’s wick to protect against potential reversals.
- Profit Target: Target the nearest support level or aim for a 2:1 risk-reward ratio, depending on the market conditions.
| Advantages: The combination of Shooting Stars and EMAs provides stronger trade signals by adding trend confirmation and dynamic resistance levels, effective for identifying high-probability setups in downtrends, increasing the success rate of trades. |
| Disadvantages: Requires multiple confirmations, adding complexity to the strategy, and may result in fewer trade opportunities, less effective in choppy or range-bound markets where clear trends are absent. |
Method Three: Take Profit at the 4th Standard Deviation of the Fibonacci Retracement
This strategy leverages the Fibonacci retracement tool for precise targeting, focusing exclusively on market retracements into key resistance zones during DOWNTRENDS.
You will find the fibonacci retracement tool here:

To start, configure your fibonacci tool to show only 4 and 4.5 standard deviations.
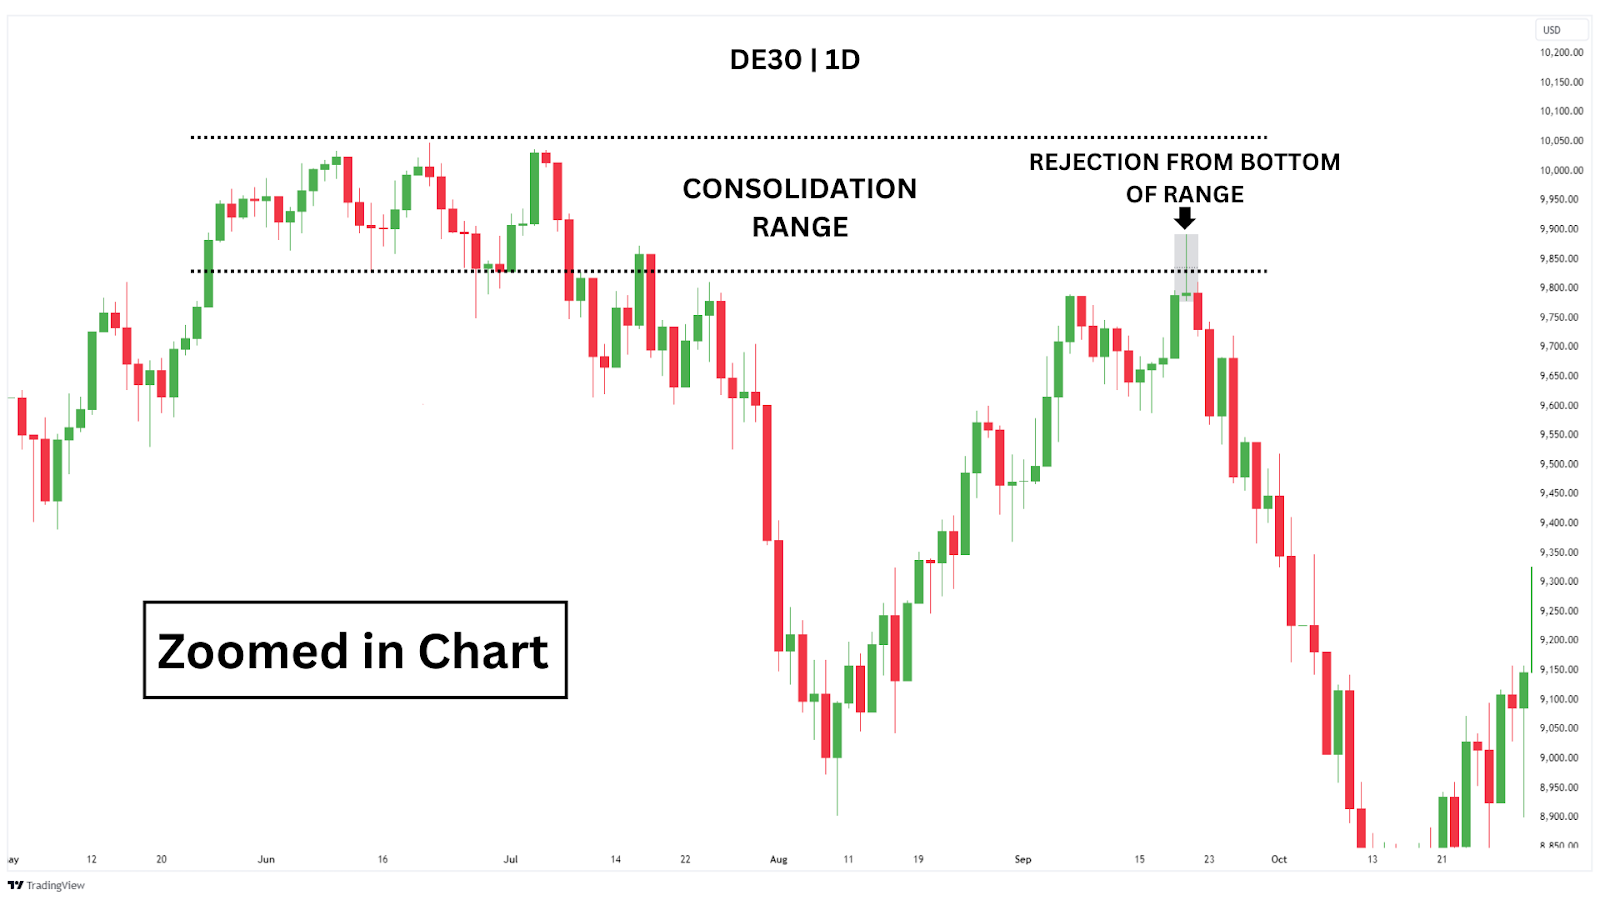
Now we are ready to find a market to trade. Let’s jump into the German DAX Index (DE30) on the daily time frame.
As we are looking for shooting stars occuring within a downtrend after a rally, this example is perfect.
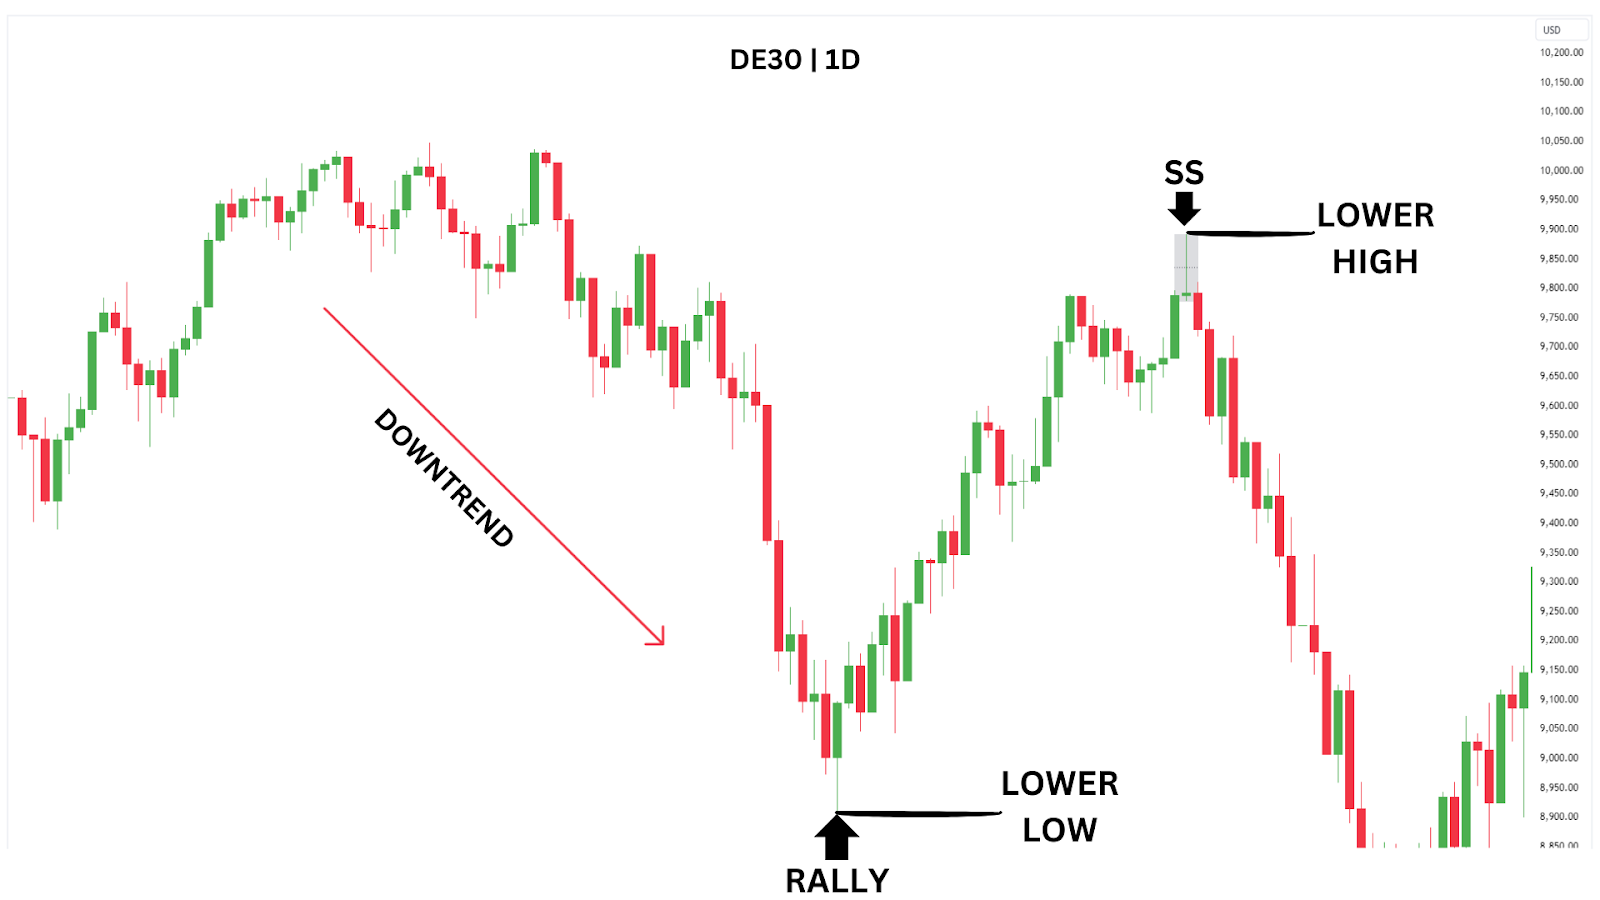
If we look left, we notice there is also a resistance zone, formed by a previous consolidation range. This area marks a price zone where traders have battled out for days with both buying and selling pressure, with the sellers eventually taking control.
When the sellers win and price moves to the downside, we are given our trend direction – bearish.
When our shooting star pattern shows ‘respect’ to this zone – with its shadow being rejected, we see that sellers are still lurking in this area to defend it.
Here’s how we can trade this zone using our fib tool that’s been updated to have 4 and 4.5 STDV. Once we get the confirmation of the shooting star, we can drag our fib from the swing low to the swing high created by the shooting star, and the tool will give us our 4-4.5 STDV targets!
Here’s where this method differs slightly from method one and two. We want to set limit orders at the close of the NEXT bearish candle, so we have confirmation that selling pressure has resumed.
The stop loss remains the same, at the shooting star’s high, and the take profits are at the 4.5STDV.
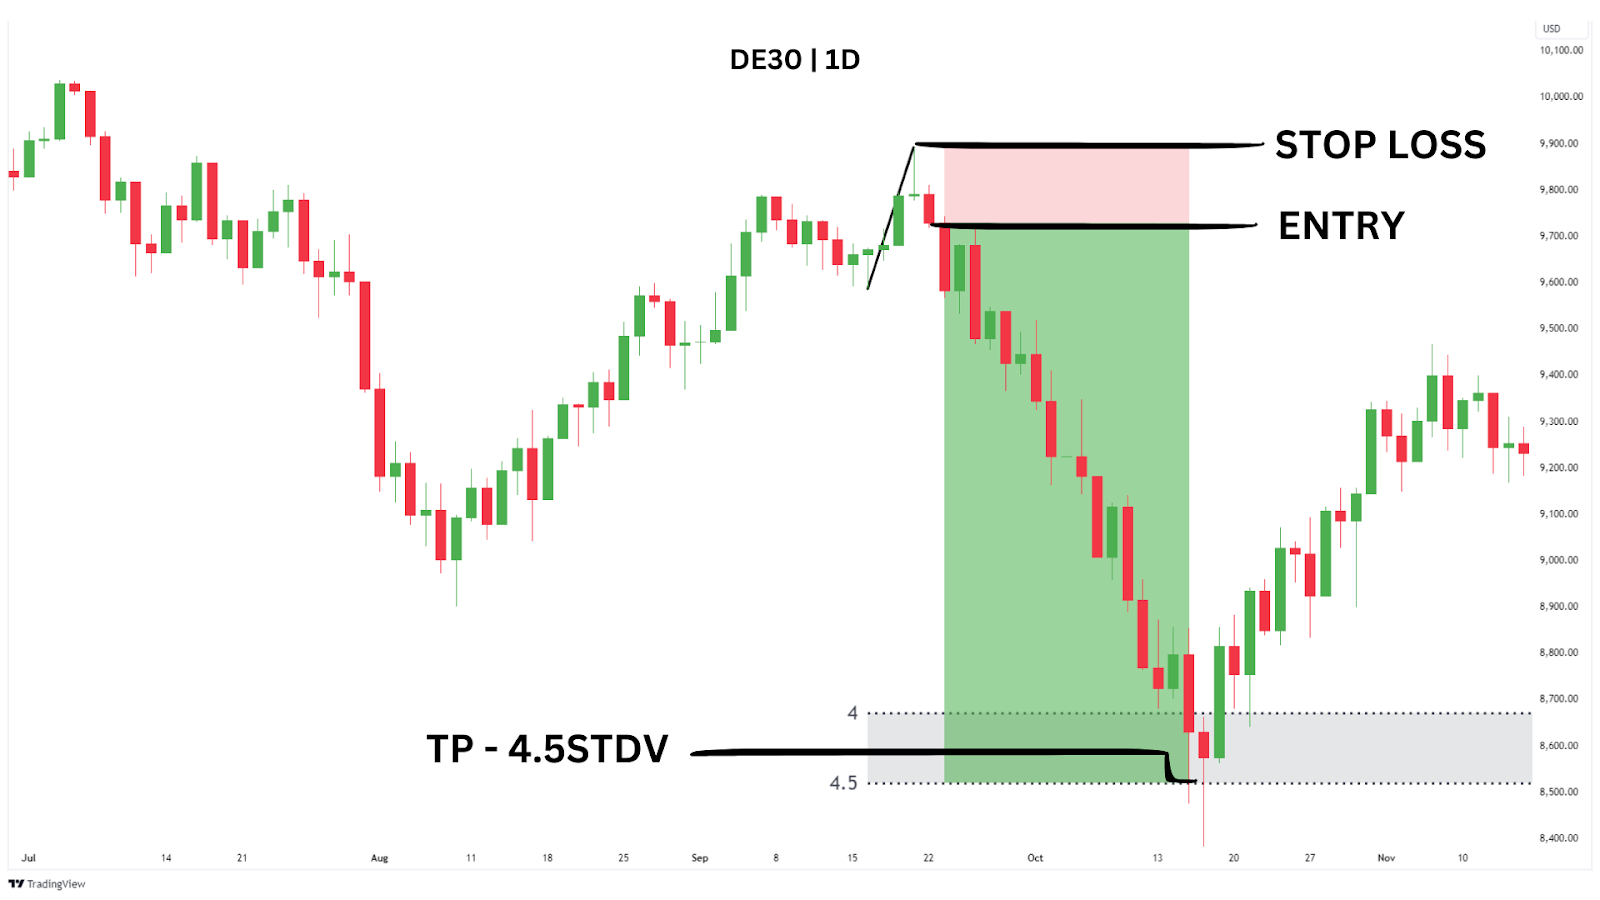
As you can see, this trade hits our take profit perfectly and provides a 7.5RR return!
Trading Strategy Summary:
- Entry Point: Enter a short position at the close of the next bearish candle following the Shooting Star confirmation. This ensures that selling pressure has resumed before you commit to the trade.
- Stop-Loss: Place your stop-loss just above the high of the Shooting Star’s wick to protect against potential reversals.
- Profit Target: Target the 4.5 standard deviation level generated by the Fibonacci retracement tool, offering a precise take-profit area for maximising returns.
| Advantages: Provides precise take-profit targets using the Fibonacci retracement tool, helping traders capture large moves, works effectively in downtrends, especially when combined with key resistance zones, enhancing trade accuracy. |
| Disadvantages: Requires additional confirmation and proper setup with the Fibonacci tool, adding complexity to the strategy, less effective in choppy or volatile markets where price movements are unpredictable. |
Closing Thoughts on the Shooting Star Candlestick Pattern
The Shooting Star candlestick pattern is a reliable bearish reversal signal when used in the right context. Its distinct structure, with a long upper shadow and small body, makes it easy to identify, and when combined with other technical tools like EMAs or Fibonacci retracement levels, it can significantly enhance your trading accuracy.
However, as with any strategy, proper risk management and patience are key to successfully trading this pattern. Here are some advantages and disadvantages when trading this pattern:
Advantages of Trading the Shooting Star
- Easily Recognisable Shape: The small body with a long upper shadow is a clear visual cue for potential reversals.
- Can Signal Major Trend Reversals: When found at key resistance levels, it can effectively signal a trend shift from bullish to bearish.
- Reliable with the Right Context: This pattern is most effective in broader downtrends, especially when testing significant resistance levels while forming lower highs and lower lows.
Disadvantages of Trading the Double Top
- Unreliable without Other Bearish Indications: The pattern may not always result in a reversal without confirmation from additional bearish signals or indicators.
- Stop Loss Can Be Large: Due to the long upper shadow, stop-loss placement may require a larger buffer, making risk management and position sizing crucial.
- May Only Provide Small Reversals: In some cases, the Shooting Star might only lead to minor pullbacks rather than a complete trend reversal.
FAQs
What is a Shooting Star Pattern, and how does it signal a trend reversal?
A Shooting Star is a bearish candlestick pattern that often indicates a potential reversal in an uptrend. This pattern forms when the price opens, pushes higher during the session, but closes near or below the opening price. The long upper shadow suggests that buyers initially pushed the price higher, but sellers regained control, signalling a possible shift from bullish to bearish momentum. It can appear on any time frame, and in any market, from forex trading pairs to cryptocurrencies, metals to commodities.
How is the Shooting Star Pattern formed?
The Shooting Star pattern appears during an uptrend when the price surges significantly higher after the market opens, creating a long upper shadow. However, the buying momentum fades, and the price closes near the opening level, forming a small real body. This price action suggests that sellers have overpowered buyers, hinting at a potential downward move if confirmed by further bearish price action.
What are the key differences between a Shooting Star formation and an Inverted Hammer?
Though the Shooting Star and Inverted Hammer patterns look similar due to how their opening and closing prices give them a small body and long upper shadow, their context differs. The Shooting Star appears after an uptrend and indicates a potential bearish reversal, whereas the Inverted Hammer forms after a downtrend, signalling a possible bullish reversal. The market trend leading up to these patterns is critical to understanding their implications.