


How to Use the Volume Indicator to Improve Trade Decisions
Learn how to use the Volume Indicator to confirm trends, validate breakouts, and catch reversals using real volume-backed trading setups.
Want to know if a breakout is real or a fakeout? Volume can tell you. This guide breaks down how to use volume to confirm trades, spot momentum, and time better entries.
What Are Volume Indicators?
Volume is one of the most overlooked yet powerful metrics in trading. While price tells you what the market is doing, volume shows you where the market is trading. Volume indicators track the number of transactions or traded contracts during a given time period — helping traders confirm trends, validate breakouts, and anticipate reversals.
There are many volume-based tools out there: On-Balance Volume (OBV), VWAP, Volume Profile, and Cumulative Volume Delta (CVD), to name a few — but in this article, we’ll focus on the most accessible and widely used: the default volume indicator found on nearly all trading platforms. If you’ve ever looked at a chart and seen vertical bars under each candle, you’ve seen this tool in action.
How does the Volume Indicator work?
The volume indicator shows how much of an asset was traded during each candle. Each vertical bar in the volume histogram corresponds to the total volume traded in that period.
- High volume bars indicate strong participation — either big institutional players entering the market or retail traders reacting to news or key levels.
- Low volume bars suggest a lack of interest or indecision — often seen during consolidations or late sessions.
This simple visual cue adds an extra layer of confirmation to your technical analysis. When paired with support and resistance, trend lines, or candlestick/chart patterns, volume can help validate whether a move is likely to continue or reverse.
Why Volume Matters in Trading
Volume is more than just a number — it tells the story behind price. It shows how active the market is, how serious participants are, and whether a move has real strength or is just noise. Before applying volume in your trading strategy, it’s important to understand what it actually reveals about market behavior.
- Trend Confirmation
A trend supported by rising volume is more likely to continue. When prices rise and volume increases, it shows commitment. When prices rise but volume falls, it could be a sign of weakness.
- Reversal Clues
Spikes in volume at major support or resistance zones can signal exhaustion or a reversal. For instance, a doji or engulfing candle printed on abnormally high volume might be the market flipping direction.
- Liquidity Insight
Higher volume means more market participants. This typically leads to better order execution, less slippage, and tighter spreads — especially important for large or high-frequency traders.
- Breakout Validation
Volume often precedes or confirms a breakout. A resistance break without volume? Likely a fakeout. But a clean breakout with a strong surge in volume? That’s often a real move backed by serious players.
High Volume Trading Strategies
Now that we’ve covered how volume works and why it matters, let’s look at how you can apply it to real-world trades. Below are three practical strategies that incorporate volume at key moments, helping you confirm trends, validate entries, and avoid getting trapped in weak setups.
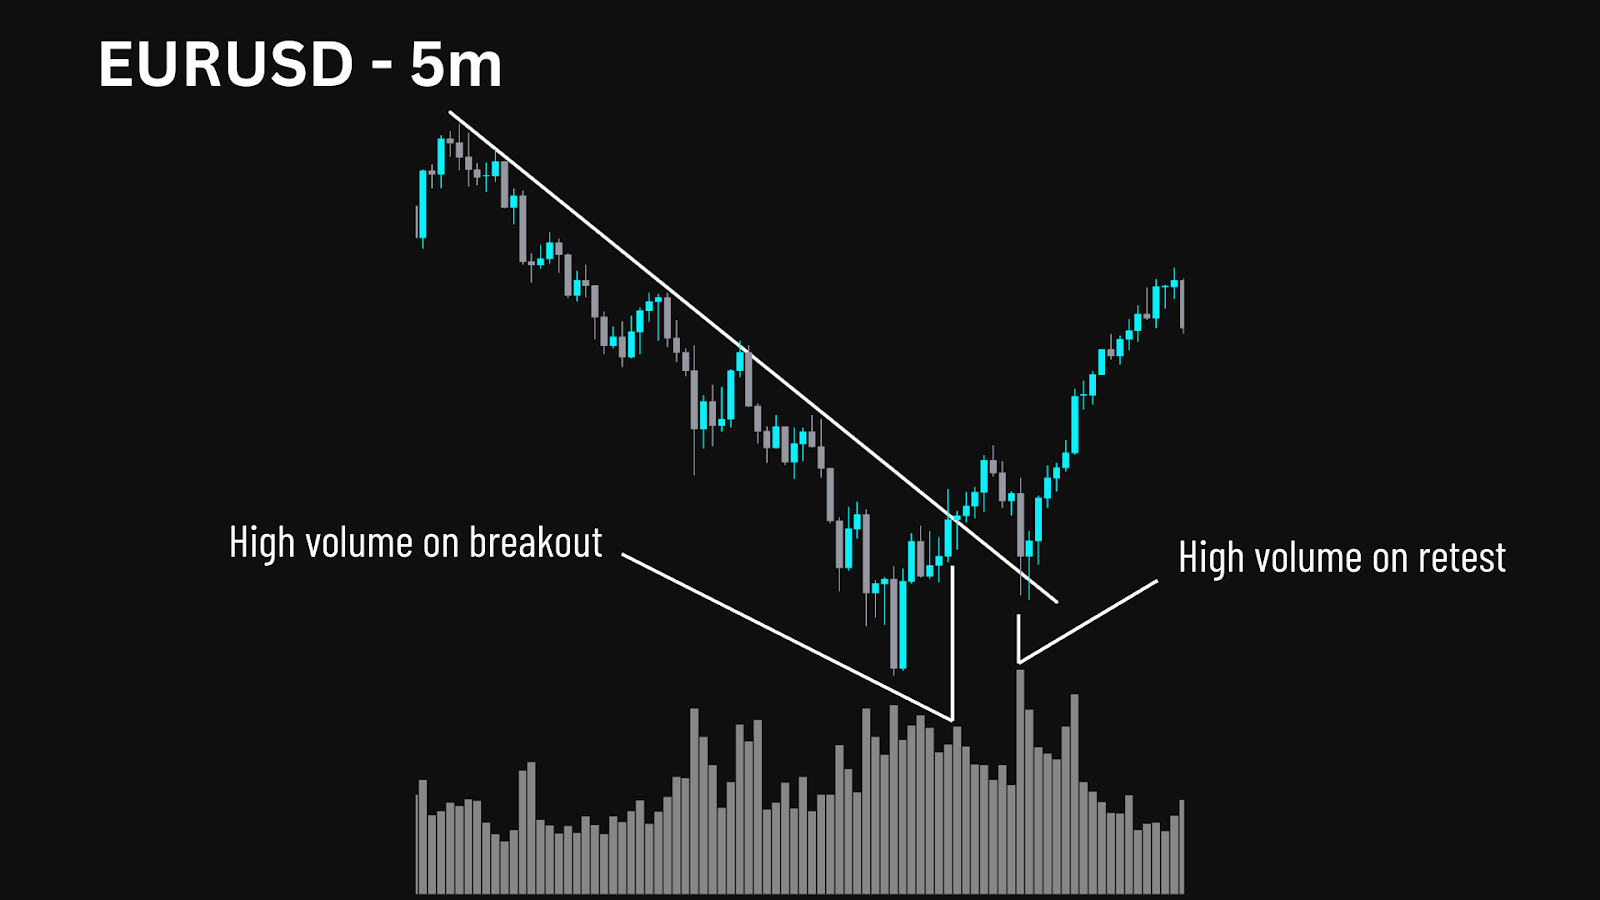
Method One: Breakout Trades
The most straightforward way to apply volume analysis is during breakouts. Many traders jump in the moment price clears a key level — but the real confirmation comes when that move is backed by rising volume.
This strategy uses volume as your filter for clean, high-probability breakouts.
Instead of guessing whether the breakout will hold, you wait for price to break a resistance level AND for volume to spike. That volume confirms active participation — a sign that the move is more likely to sustain.
Setup:
- Formation: Price forms a resistance level after a period of consolidation or range-bound movement.
- Breakout: Price breaks above the resistance line.
- Volume Confirmation: A clear increase in volume on the breakout candle confirms real participation.
- Entry: Enter on the candle close that breaks the level with strong volume, or on the retest of the resistance.
- Stop Loss: Below the low of the breakout candle or beneath the consolidation range.
- TP: At a predefined risk-to-reward target (e.g. 1:2 RR).
Why This Works:
- Filters fakeouts by requiring volume confirmation
- Helps avoid early entries based on weak or thin breakouts
- Provides cleaner trade structure with confirmation and defined invalidation
Drawback:
- The breakout candle may be large, reducing the risk-reward ratio if volume appears late
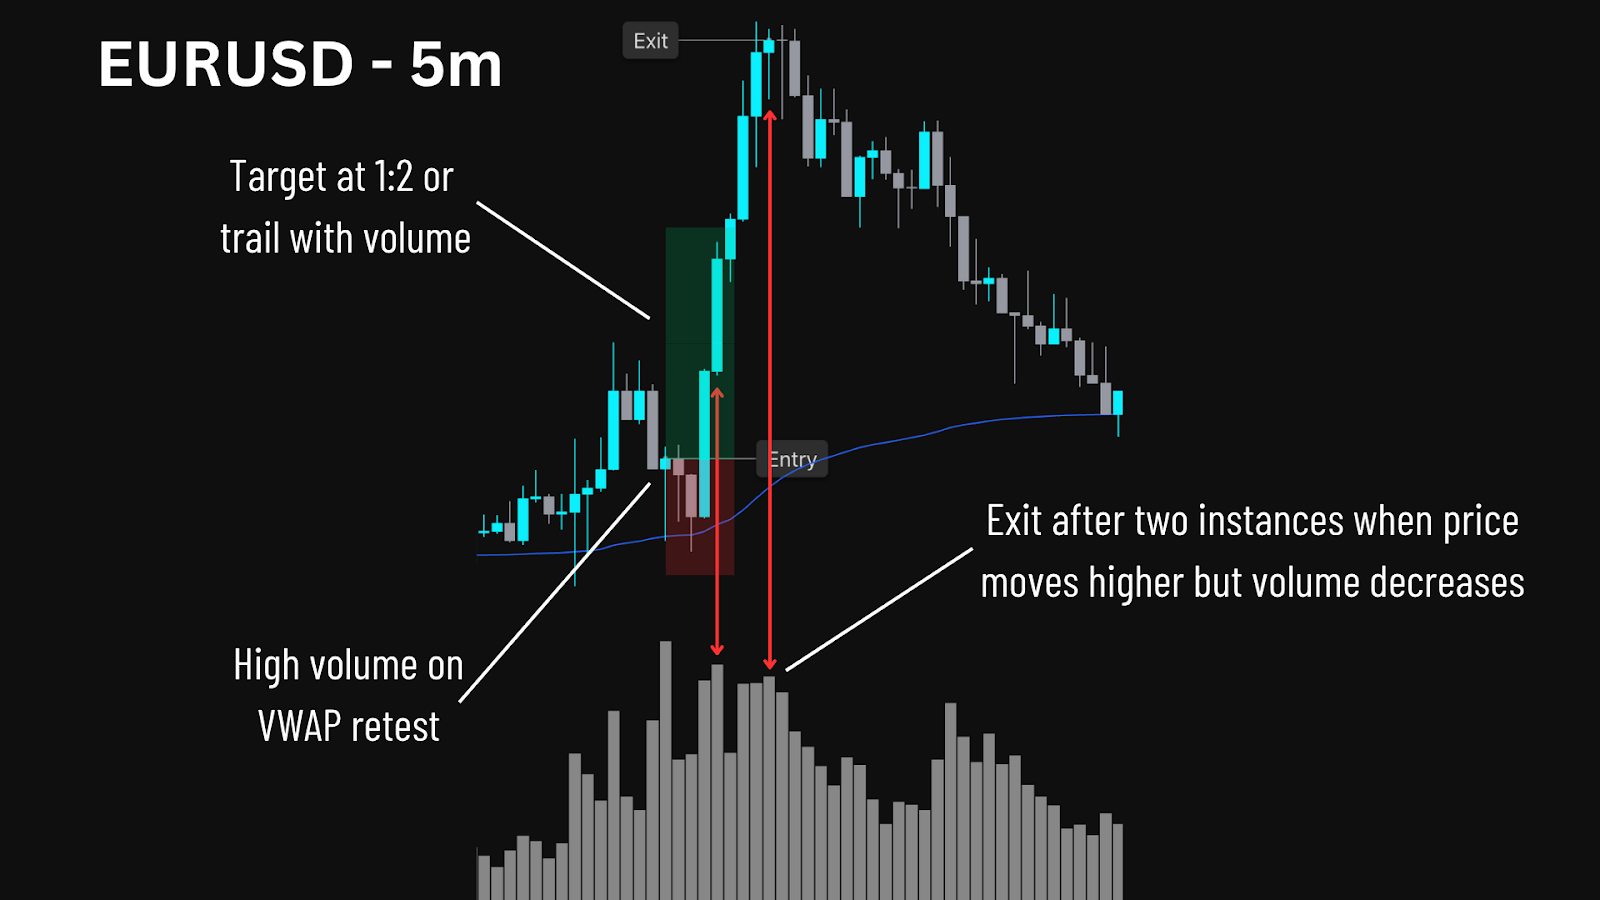
Method Two: VWAP Pullbacks
The VWAP (Volume Weighted Average Price) is one of the most powerful intraday tools available to traders. It represents the average price an asset has traded at throughout the day, weighted by volume, making it more informative than a simple moving average. VWAP is commonly used by institutional traders to gauge fair value, which is why price often reacts to it so consistently.
This strategy focuses on price retesting VWAP during a pullback. When price revisits VWAP after a drop — and volume surges at that retest — it signals a potential reversal or continuation of the trend. The volume spike confirms that market participants are stepping in at this ‘fair value’ zone.
Setup:
- Formation: Price drops into VWAP after a sharp move.
- Volume Retest: High volume prints as price retests VWAP.
- Entry: Enter after a strong reaction from VWAP with volume confirmation.
- Minimum Target: Hold for at least a 1:2 risk-to-reward target before managing the position.
- Exit: After reaching 1:2 RR, monitor for a higher price move with decreasing volume. If volume fades, that can signal exhaustion and justify taking profits.
- Stop Loss: Placed below VWAP or the recent swing low.
Why This Works:
- Uses VWAP as a mean reversion + confirmation level
- Entry is based on real-time volume agreement, not just price action
- Helps catch early trend continuations or intraday reversals
Drawback:
- May lead to false entries in ranging or thinly traded markets
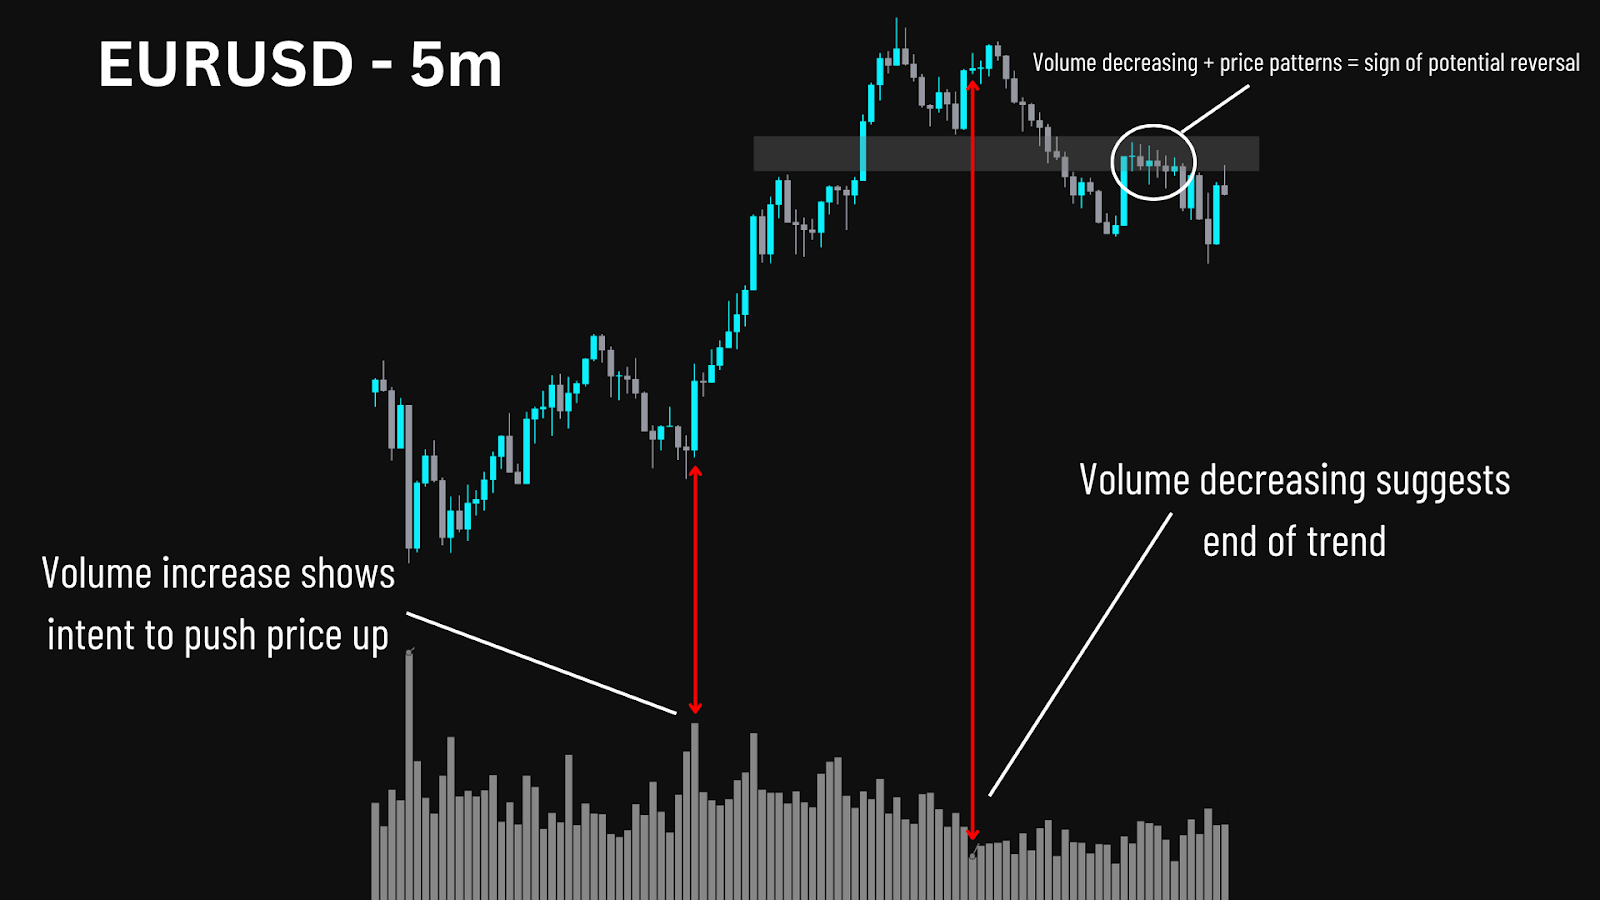
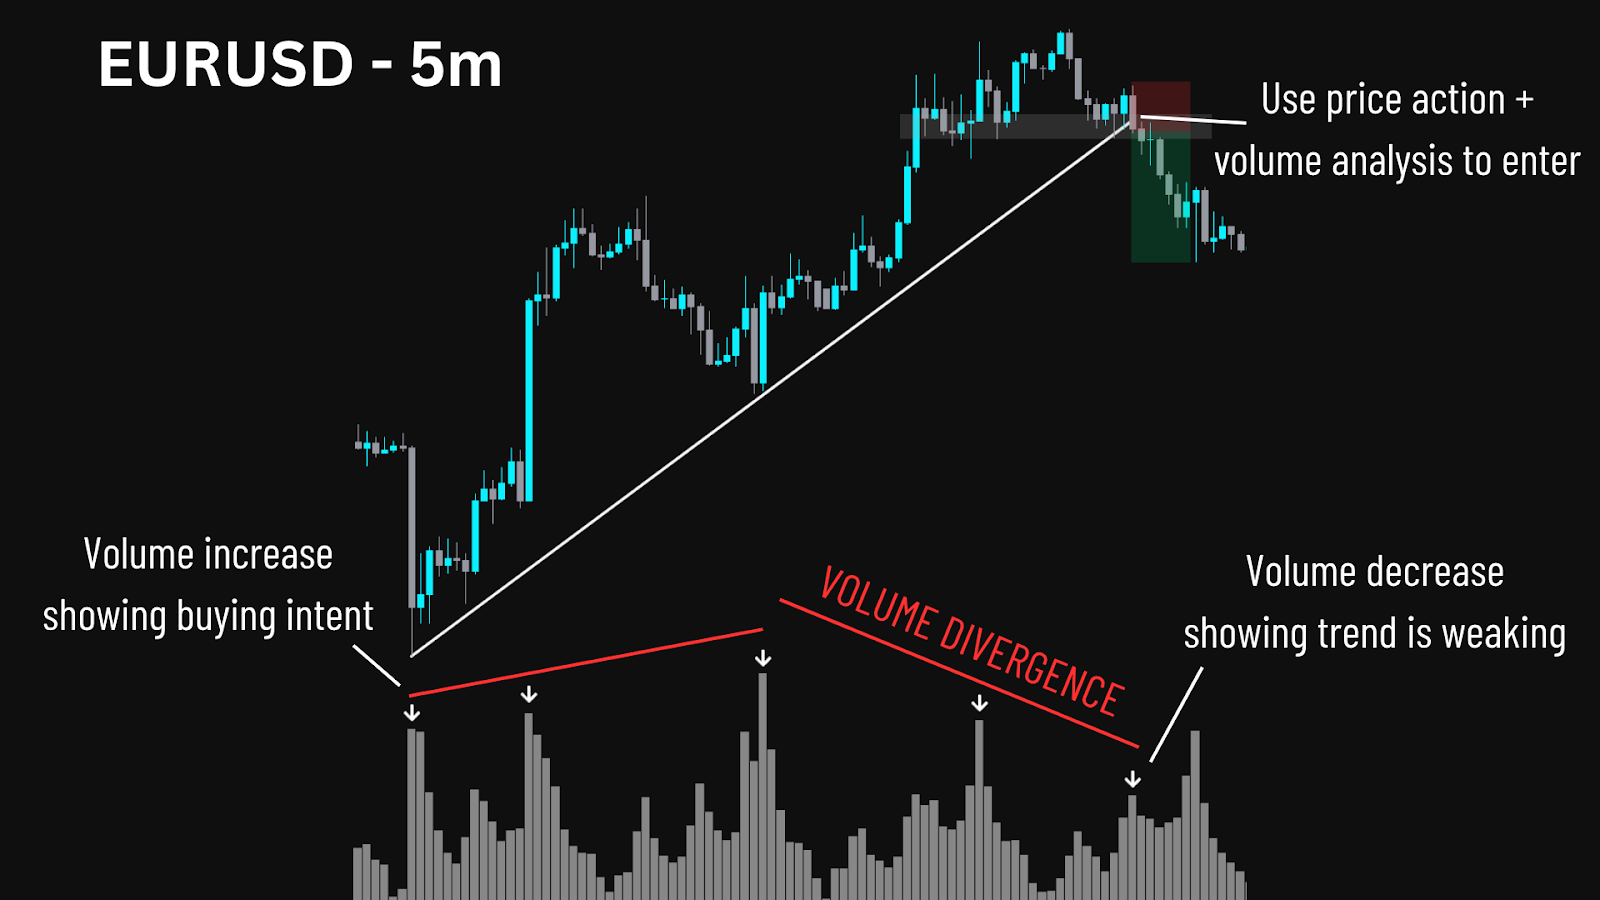
Method Three: Volume Divergence
Volume divergence occurs when price continues to make new highs or lows, but volume no longer supports the move. This disconnect between price and participation signals potential weakness or exhaustion in the trend.
In a downtrend, if price forms lower lows while volume decreases, the move is losing support from sell-side pressure. In an uptrend, if higher highs form with weaker volume, it suggests buyers are no longer stepping in strongly — and the move may soon reverse.
Setup:
- Formation: Price forms consecutive higher highs (HHs) or lower lows (LLs).
- Volume Divergence: Volume decreases as price extends.
- Entry: Enter when price makes a new high or low with lower volume than the previous swing, then shows a shift in structure or a reversal candle at a key level.
- Exit (if already in a trade): Take profits when you see divergence and slowing momentum.
- Stop Loss: Just beyond the most recent high or low.
- TP: Use structure targets or predefined RR (e.g. 1:2), especially when divergence confirms that the move is losing support from volume.
Why This Works:
- Reveals fading strength even if price appears strong
- Warns of potential reversals before they happen
- Useful for both exit management and countertrend setups
Drawback:
- Not all divergence signals lead to reversals — wait for price action confirmation
Hidden Trick: Using the Volume Indicator on Futures
Volume on spot forex charts can be misleading because it’s broker-dependent. Futures charts, on the other hand, aggregate real traded volume across centralised exchanges.
If your asset doesn’t show proper volume — especially in forex — check the futures contract version of that pair.
- Set it to Electronic Trading Hours (ETH) to filter out low-volume noise.
- Futures volume often mirrors major movements in the underlying market and can act as a proxy even for CFD traders.
This trick helps traders assess real participation, particularly around news events, session opens, or key levels.
Is the Volume Indicator Better in Stocks, Forex, Commodities, or Crypto?
The effectiveness of the volume indicator varies across markets due to how volume is reported and structured:
| Market | Explanation |
| Forex (Spot) | Least reliable. Spot forex is decentralised, and volume shown on charting platforms is broker-specific or based on tick volume. You’ll get better insight using futures volume as a proxy. |
| Stocks | Most reliable. Volume is recorded through centralised exchanges, giving you highly accurate, real-time data. |
| Futures & Commodities | Very accurate, thanks to centralised markets like CME. Great for measuring institutional participation. |
| Crypto | Moderately reliable. Volume is exchange-specific, so unless you’re looking at aggregated volume, it may not show the full picture. |
If accuracy is critical, stock and futures markets offer the cleanest volume signals. For forex or crypto traders, volume can still add value. Use it with awareness of its limitations.
Common Mistakes to Avoid
Even though volume is a powerful tool, it’s easy to misuse if you’re not aware of a few key pitfalls. These are some of the most common errors traders make when interpreting volume — and how you can avoid them.
- Using volume in isolation — Always combine volume with price action, key levels, or patterns.
- Assuming all spikes matter — Not all high volume is significant. Look for volume relative to context.
- Ignoring divergence clues — Volume divergence is one of the most overlooked reversal signals.
Final Thoughts on the Volume Indicator
Volume is like the heartbeat of the market. It shows when the crowd is excited, hesitant, or panicking. Used correctly, it can validate breakouts, confirm trends, and warn you before traps. It’s not a silver bullet — but when combined with a strong system, it becomes a powerful edge.
Advantages of Volume Indicator
The volume indicator offers several clear benefits, especially when used alongside other tools and techniques. It brings an extra layer of confidence to setups and gives traders insight into how committed the market really is behind each move. Below are some key advantages:
| Confirms trend strength |
| Identifies fake breakouts and traps |
| Reveals hidden market participation |
Disadvantages of Volume Indicator
While volume indicators can be powerful, they aren’t without limitations. Traders need to be aware of their constraints to avoid misinterpretation or overreliance. Here’s what to watch out for:
| Not reliable for all asset types (especially forex CFDs) |
| Can mislead if used without context or pattern recognition |
| Doesn’t predict direction on its own |
Like any tool, the volume indicator is only as useful as the trader wielding it. Understanding how to interpret shifts in volume can separate good trades from great ones. Combine it with sound price action, structure, and market context — and you’ll have a sharper edge in nearly any market condition.
FAQ
What are the other volume indicators?
Some popular ones include On-Balance Volume (OBV), VWAP, Volume Profile, and Cumulative Volume Delta (CVD).
What is the most accurate volume indicator?
No single indicator is “most accurate.” VWAP and Volume Profile offer more contextual insights, but each suits different trading styles.
Which offers more reliable or useful volume data — CFDs or Futures?
Futures data is more reliable due to centralized reporting. CFD volume depends on your broker.
Can I use the volume indicator for forex trading?
Yes, but it’s best used with caution. Futures volume or tick volume may offer better insight.
Do volume indicators work on crypto and stocks?
Yes — they’re highly effective, especially in crypto and stock markets with centralized data.
What’s the best timeframe to use volume indicators?
Volume indicators work well across timeframes, but lower timeframes can offer better scalping opportunities to take full advantage of volume analysis.
Should I use volume indicators alone?
No. Volume should be used as a supporting tool alongside price action, key levels, and other confirmations.