Page background

Double Bottom Chart Pattern: Entry and Target Strategies

The Double Bottom pattern is one of the most powerful and reliable signals for spotting major bullish reversals. In this guide, we’ll break down exactly how to identify a double bottom, how to trade it step-by-step, and how to integrate it into your trading strategy with confidence.

What is a Double Bottom Chart Pattern? 

A Double Bottom is a bullish reversal pattern that forms after a sustained downtrend. It looks like the letter “W” on a chart.

This pattern signals that price has tested a key support level twice, failed to break below it both times, and is now showing signs that selling momentum is exhausted.

Here’s the basic sequence:

  • Sellers attempt to push prices lower but fail at a key support.
  • Price bounces up, then returns to retest the same support zone.
  • When sellers fail again, buyers take control – leading to a bullish reversal.

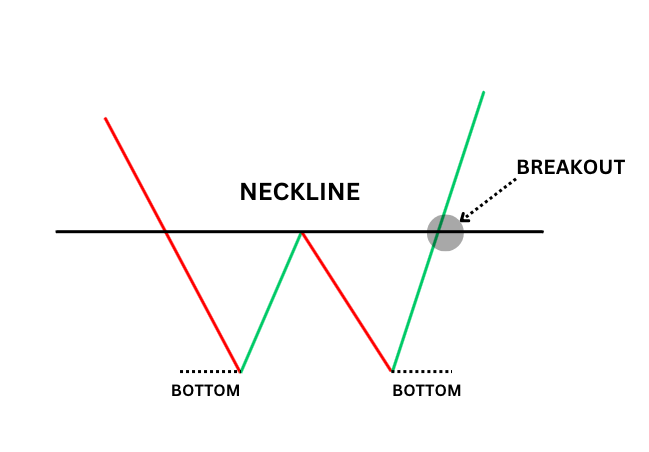
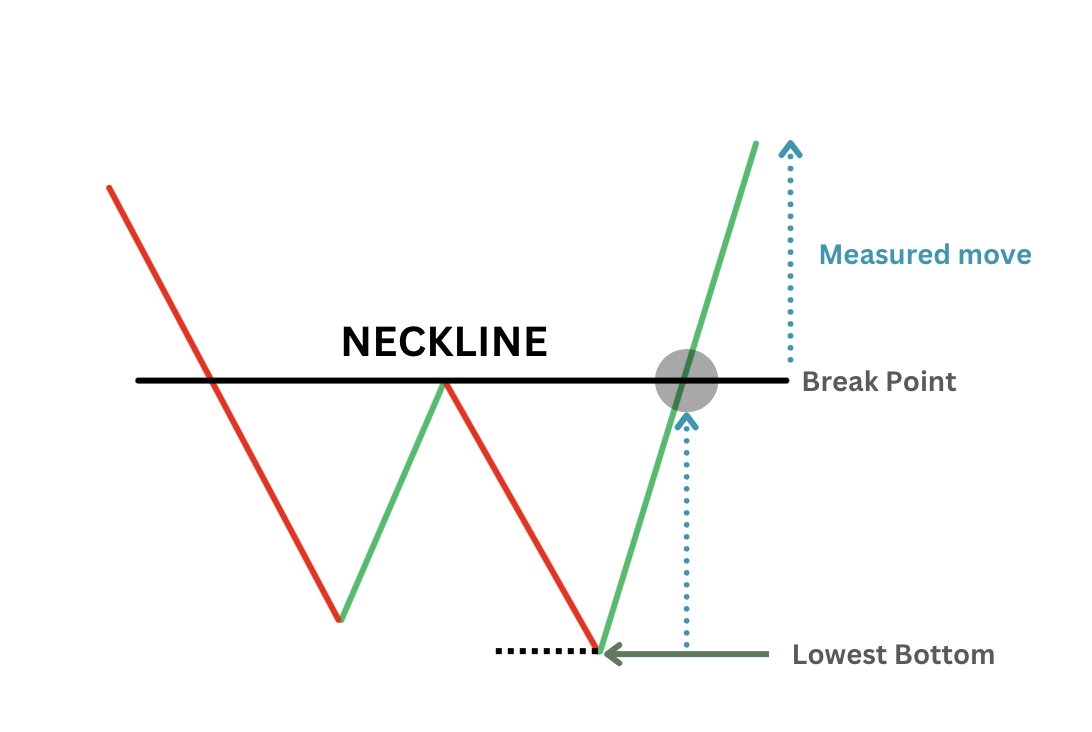
The pattern is confirmed once price breaks and closes above the resistance between the two lows, known as the neckline.
After a confirmed breakout, the neckline often acts as new support, offering potential continuation to the upside.

(Illustration of a classic double bottom pattern, showing confirmation via neckline breakout.)

Key Characteristics of the Double Bottom

  • Formation: Two clear swing lows form near the same horizontal support level, separated by a peak (the neckline).
  • Psychology: Sellers attempt to break support twice but fail, revealing exhaustion and allowing buyers to gain control.
  • Confirmation: A confirmed double bottom requires a break and close above the neckline, validating the reversal.

Note:
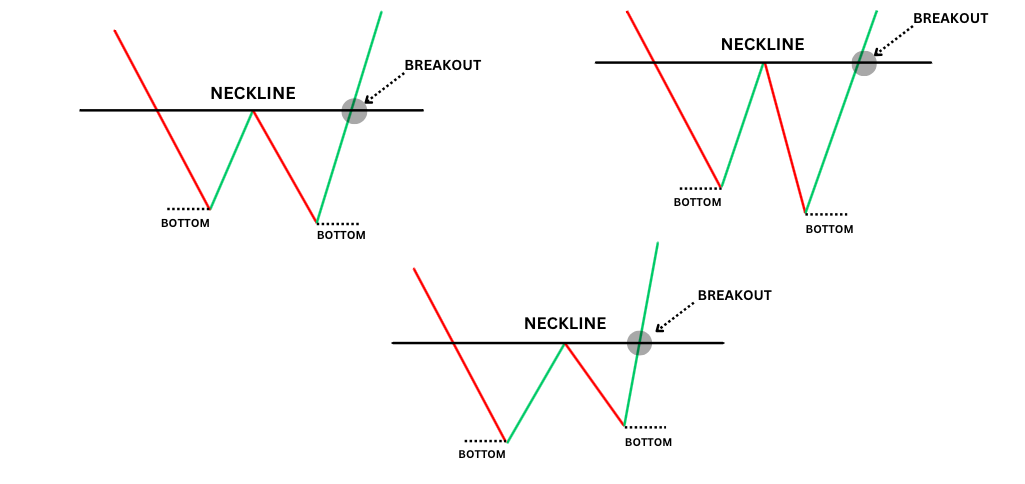
Not all double bottoms are perfectly symmetrical. Sometimes the second bottom is slightly higher or lower. What matters most is the structure and the strong rejection of lower prices, not perfect visual symmetry.

Understanding the Measured Move Target

The measured move target is the expected price movement an asset will make, once a chart pattern has been broken. In a double bottom’s case, the price move would be positioned to the upside.

How to calculate it:

  1. Measure the vertical distance from the lowest bottom to the neckline.
  2. Copy that distance upward from the neckline breakout.

Note that a measured move target provides a realistic profit-taking zone, but like all technical targets, serves more as a guideline rather than as a guarantee. Sometimes, a double bottom may not reach its target, other times, it may overshoot.

(Illustration: Measured move distance from lowest bottom to neckline, projected upward.)

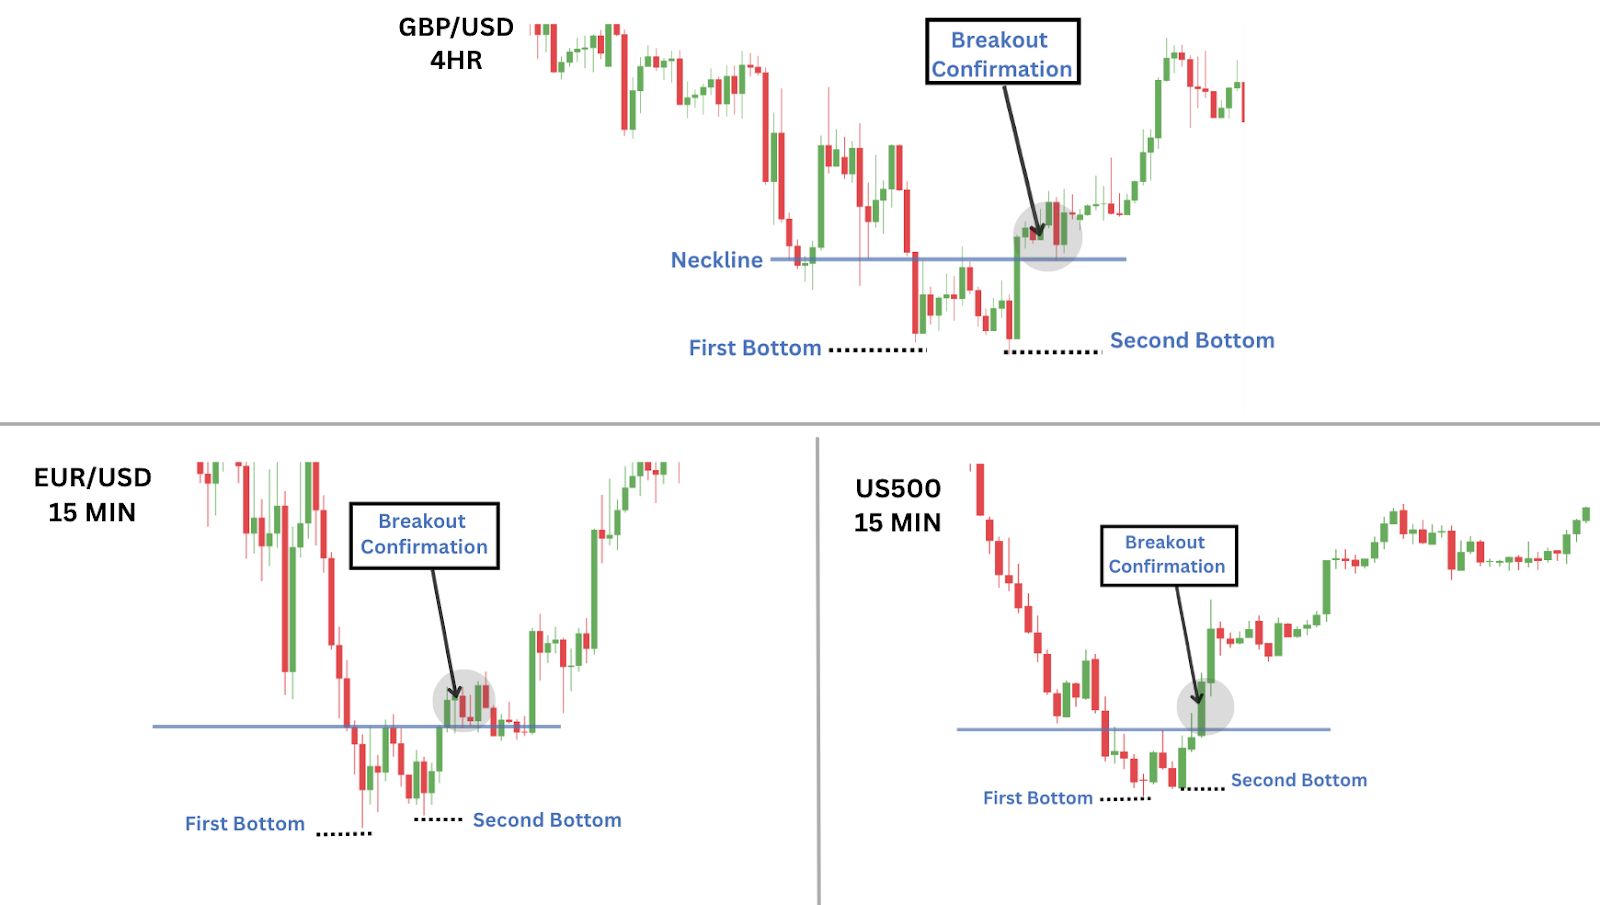
Double Bottom Examples

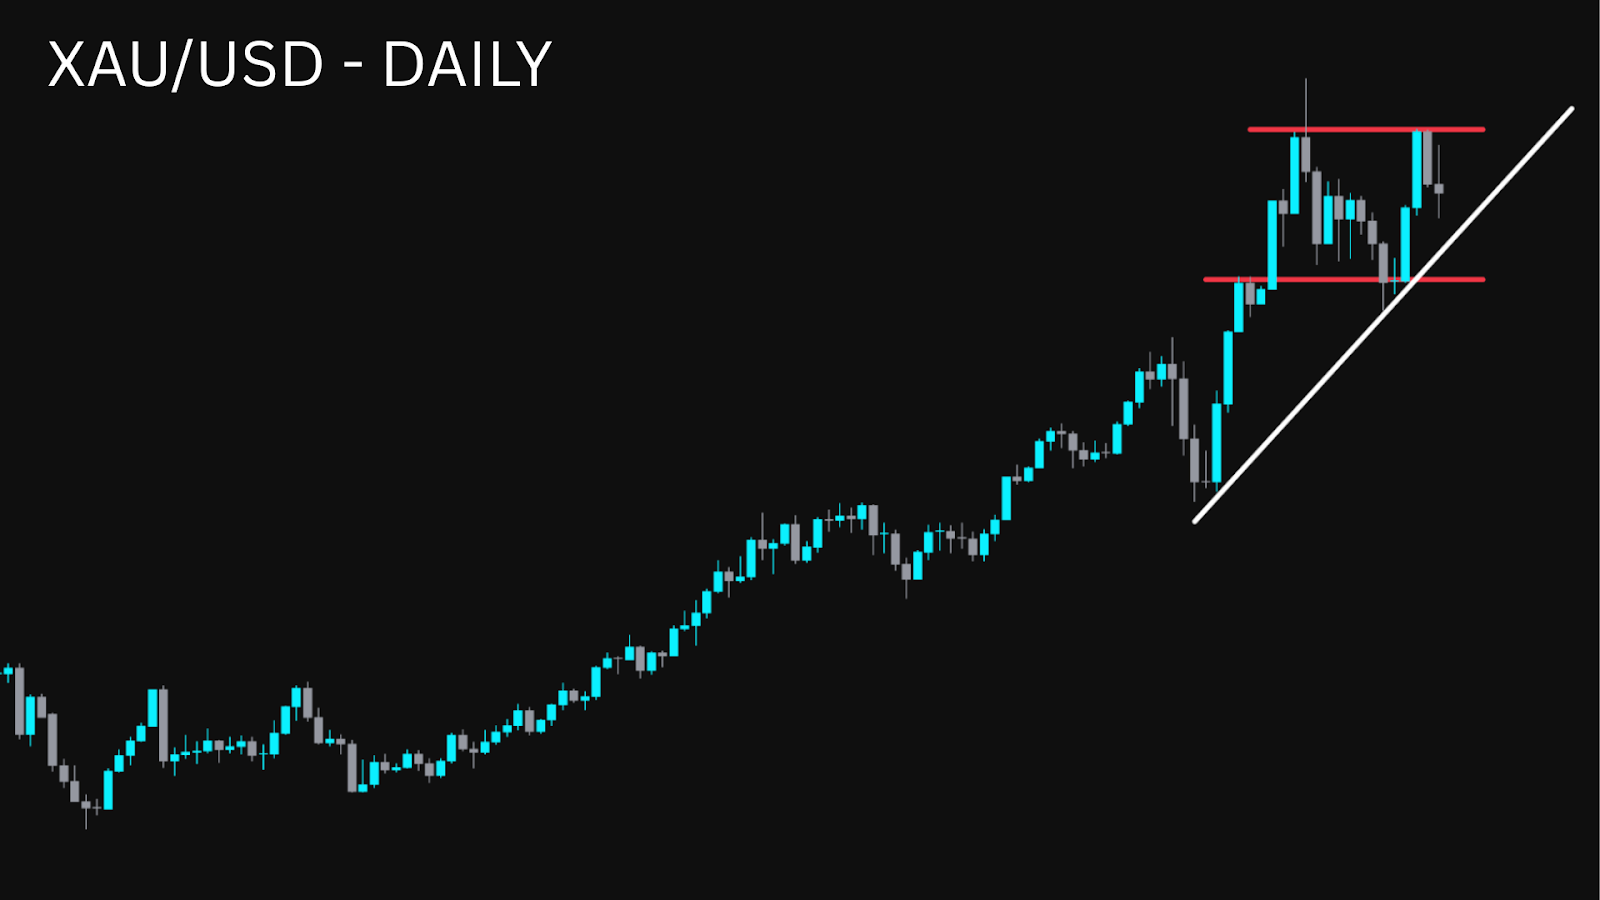
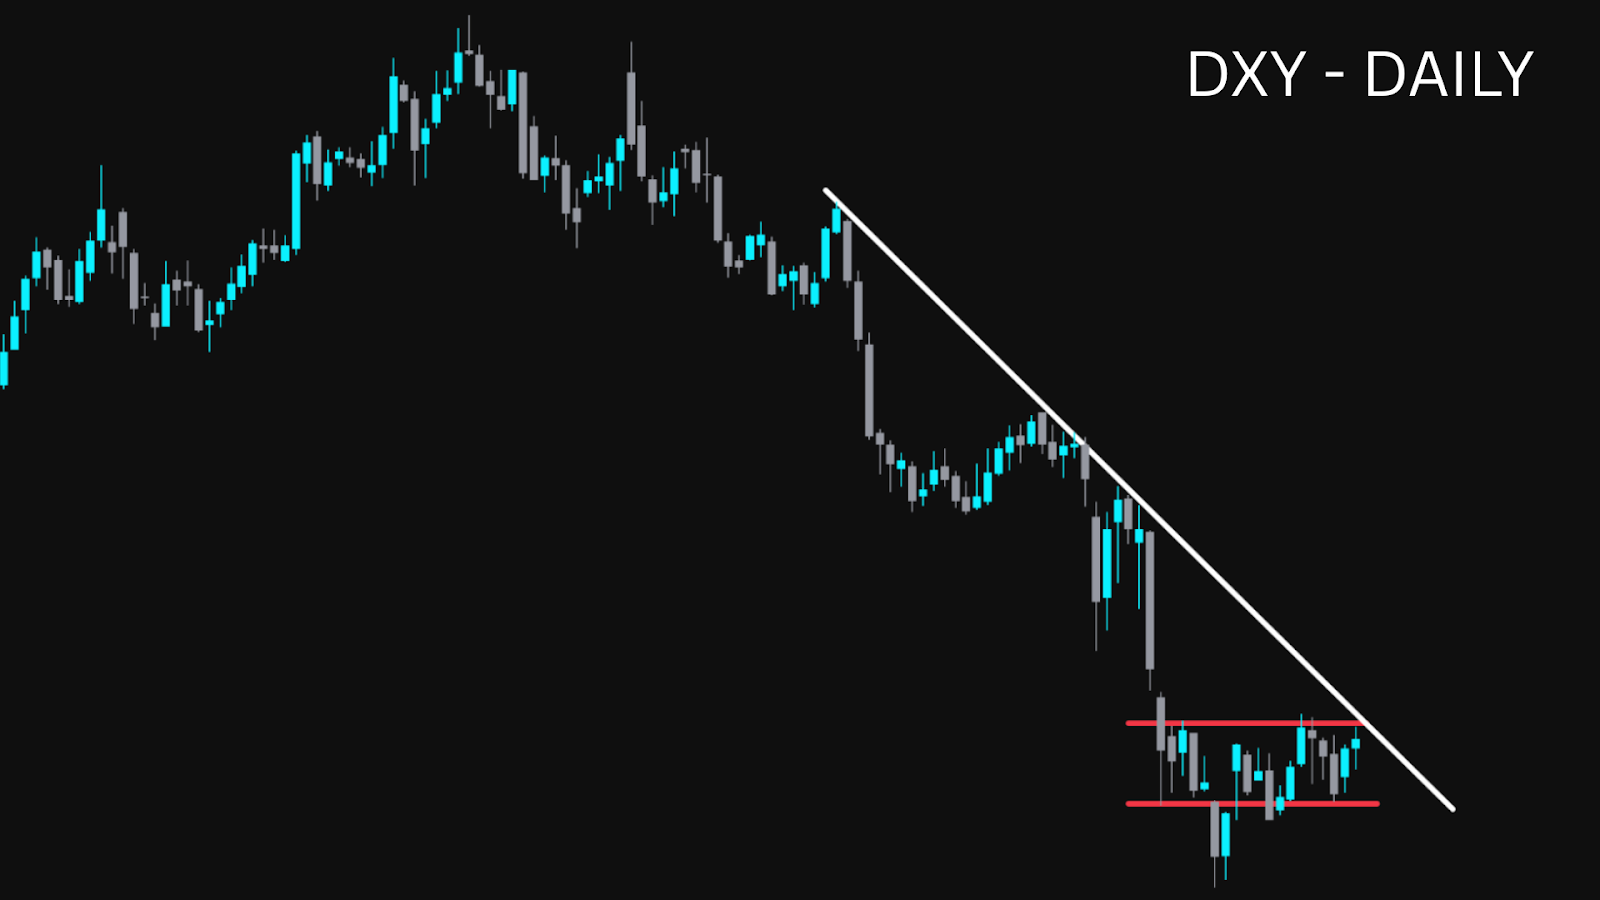
Double bottoms are recurring patterns that can appear on any timeframe, any asset class—from 1-minute to weekly charts— to traditional assets like stocks, to commodities, cryptos, and forex. This is an incredibly versatile pattern, that you can repeatedly spot across various charts and assets, making it a value add to your trading playbook.

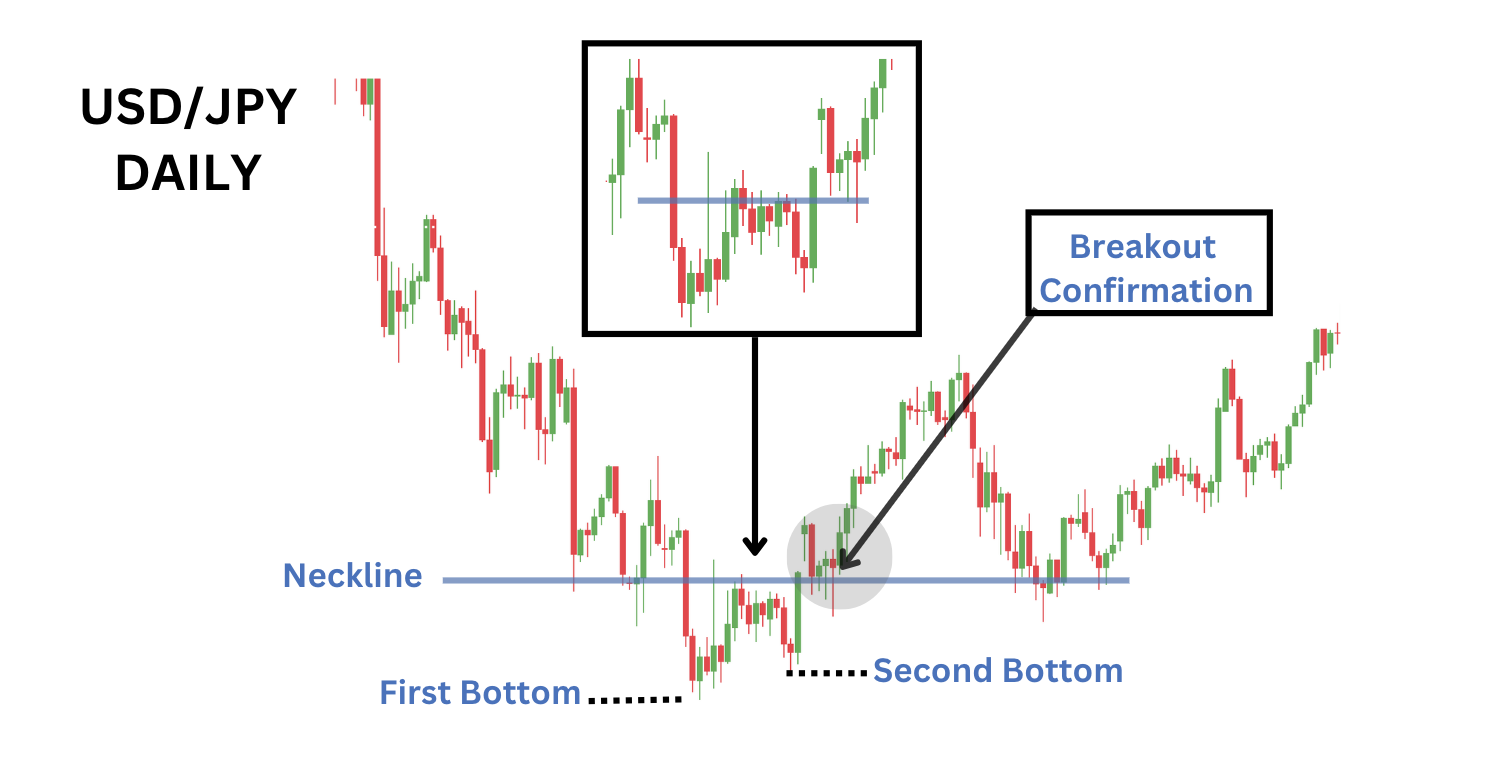
Case Study: Double Bottom on USD/JPY (Daily Chart)

Let’s examine a time when a double bottom caught a significant low.

After an extended downtrend on USD/JPY, the price forms two lows at around the same area. Finally, the price retraces to the previous high, creating that iconic ‘W’ shape and confirming the presence of a double bottom.

Following the breakout, the price retraces back to the neckline, and once again begins to rally to significant highs — confirming the idea of a bullish reversal. 

(Illustration: USD/JPY daily chart showing a textbook double bottom breakout.)

How to Trade the Double Bottom Pattern

The simplest way to trade a double bottom is to enter a long position once the neckline has been broken towards the upside. However, you can also wait for a retest, or even trade it from the second leg up.

The point is, there is a variety of methods you can use to tackle the double bottom, each with their own unique setups. Here are three simple ways to get you started on trading this pattern.

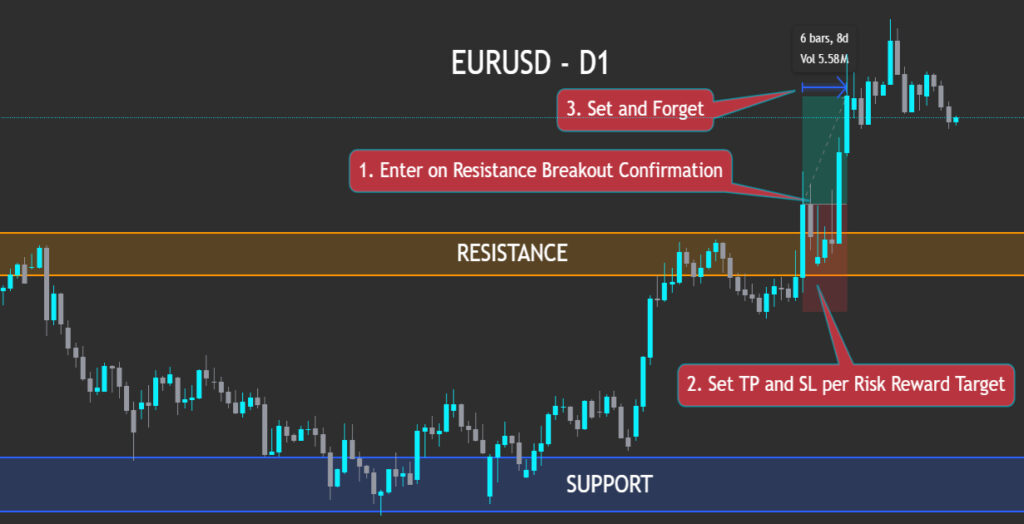
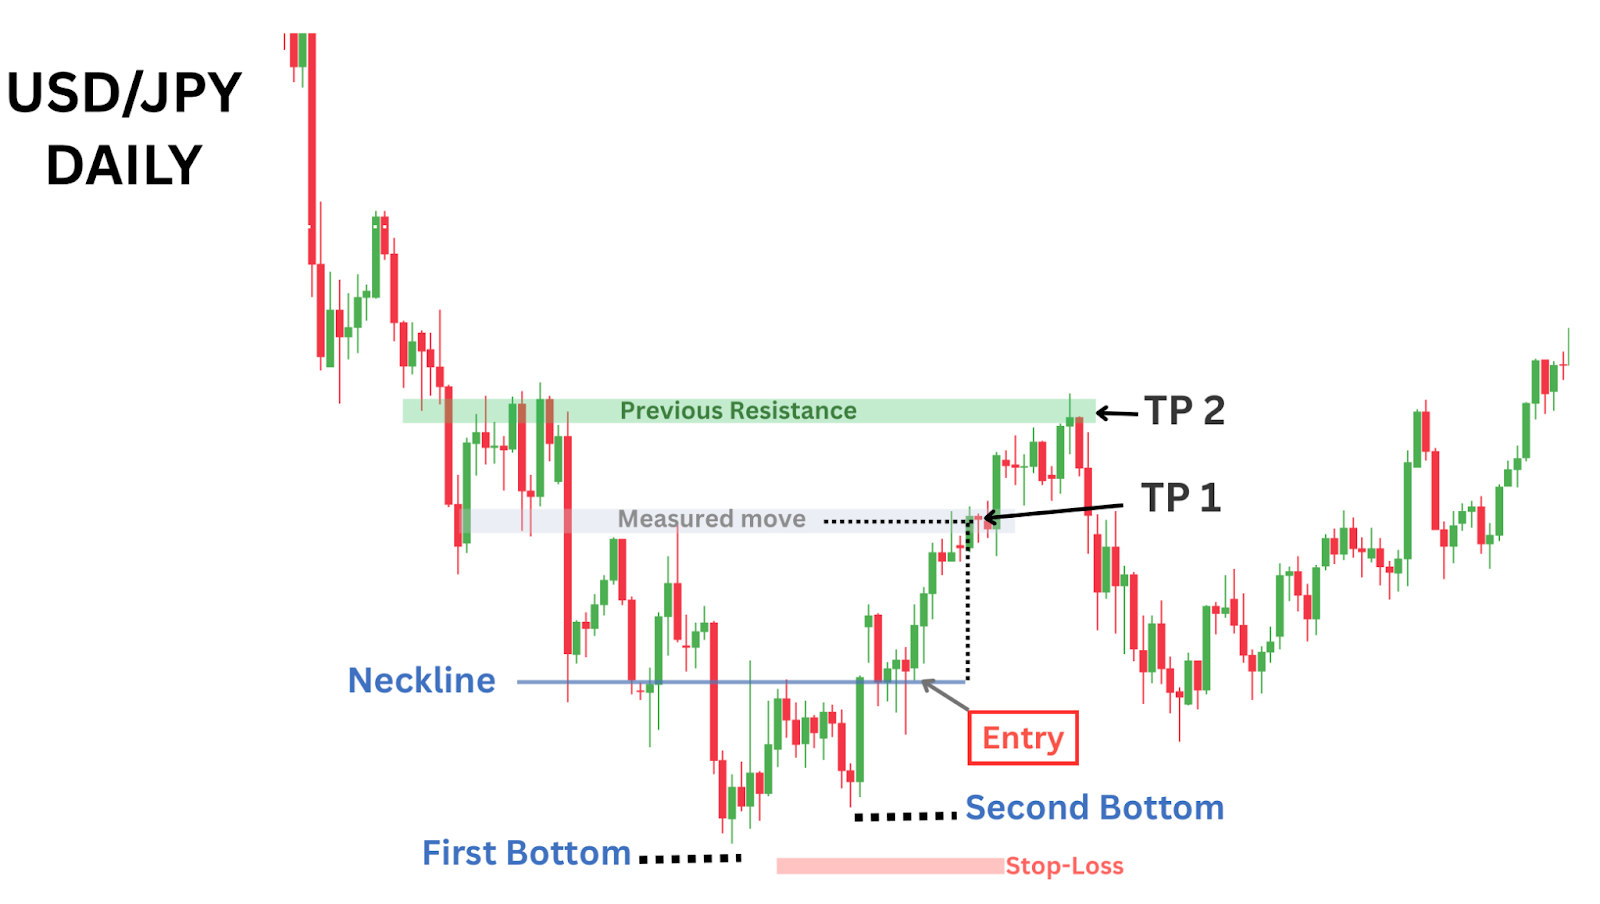
Method One: Break and Retest Entry (Low Risk Strategy)

The most conservative approach to trading a double bottom is to wait for price to break and close above the neckline, then retest the neckline to confirm it as new support.

Instead of jumping in on the breakout, you wait for price to pull back to the neckline and show bullish rejection – locking in a better risk-to-reward profile and reducing the chances of getting caught in a failed breakout.

Setup:

  • Formation: Price forms a double bottom and breaks above the neckline, confirming the reversal.
  • Retest: Price pulls back to retest the neckline — former resistance now acting as support.
  • Entry: On a bullish rejection candle or strong close from the neckline retest.
  • Stop Loss: Placed just below the low of the retest candle.
  • TP1: At the measured move target (bottom-to-neckline distance projected upward).
  • TP2 (optional): At the next major resistance level or prior structure high.
(Example: Break and Retest Entry on Double Bottom Pattern.)

Why This Works:

  • Prioritises confirmation over early entries
  • Higher success rate due to confirmation of the new support
  • Cleaner structure with clearly defined invalidation

Drawback:

  • You may miss the trade entirely if price doesn’t retest the neckline

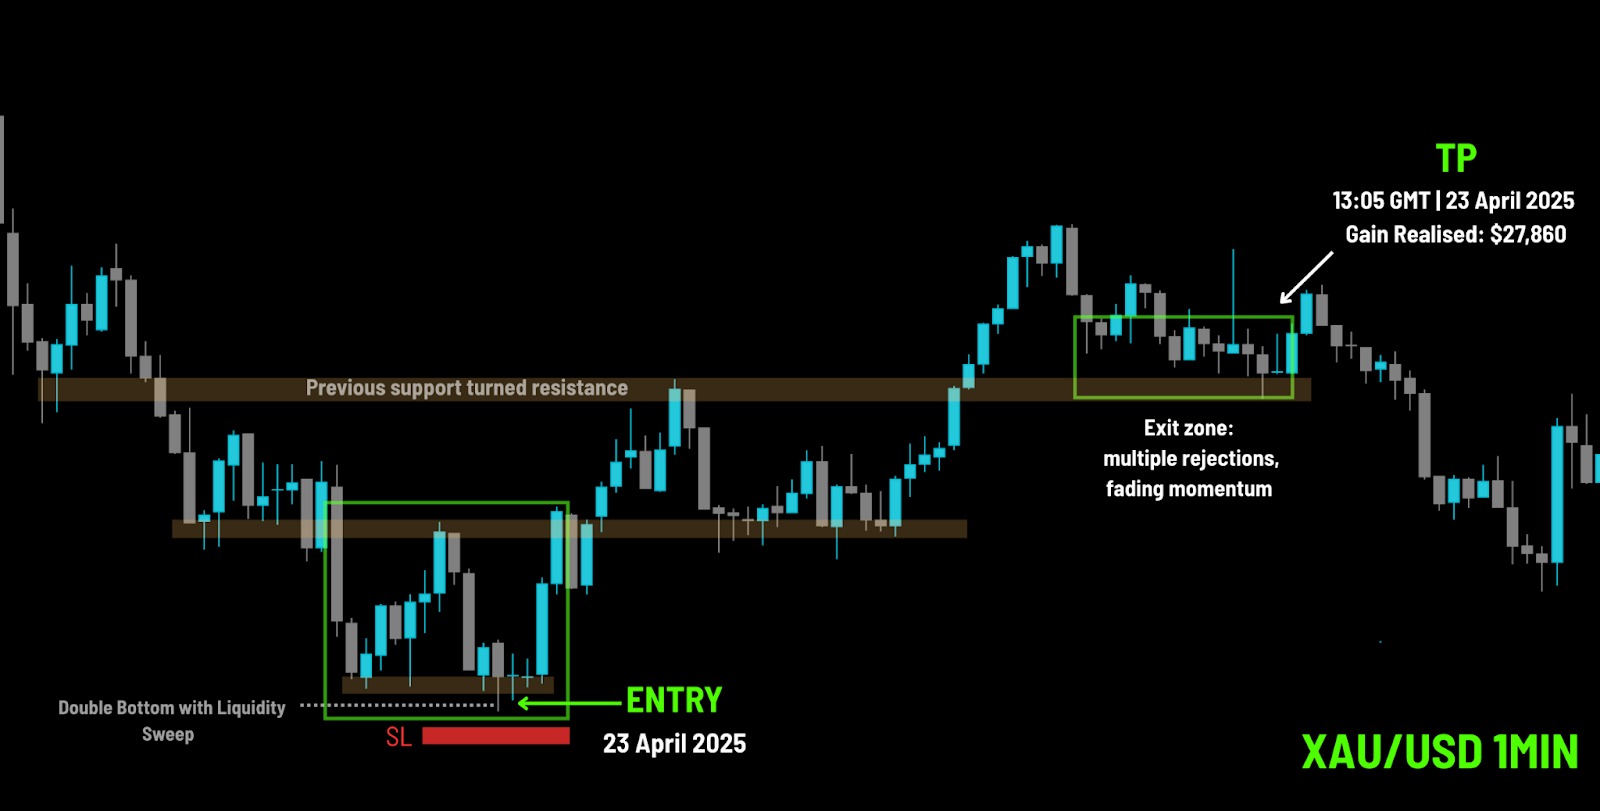
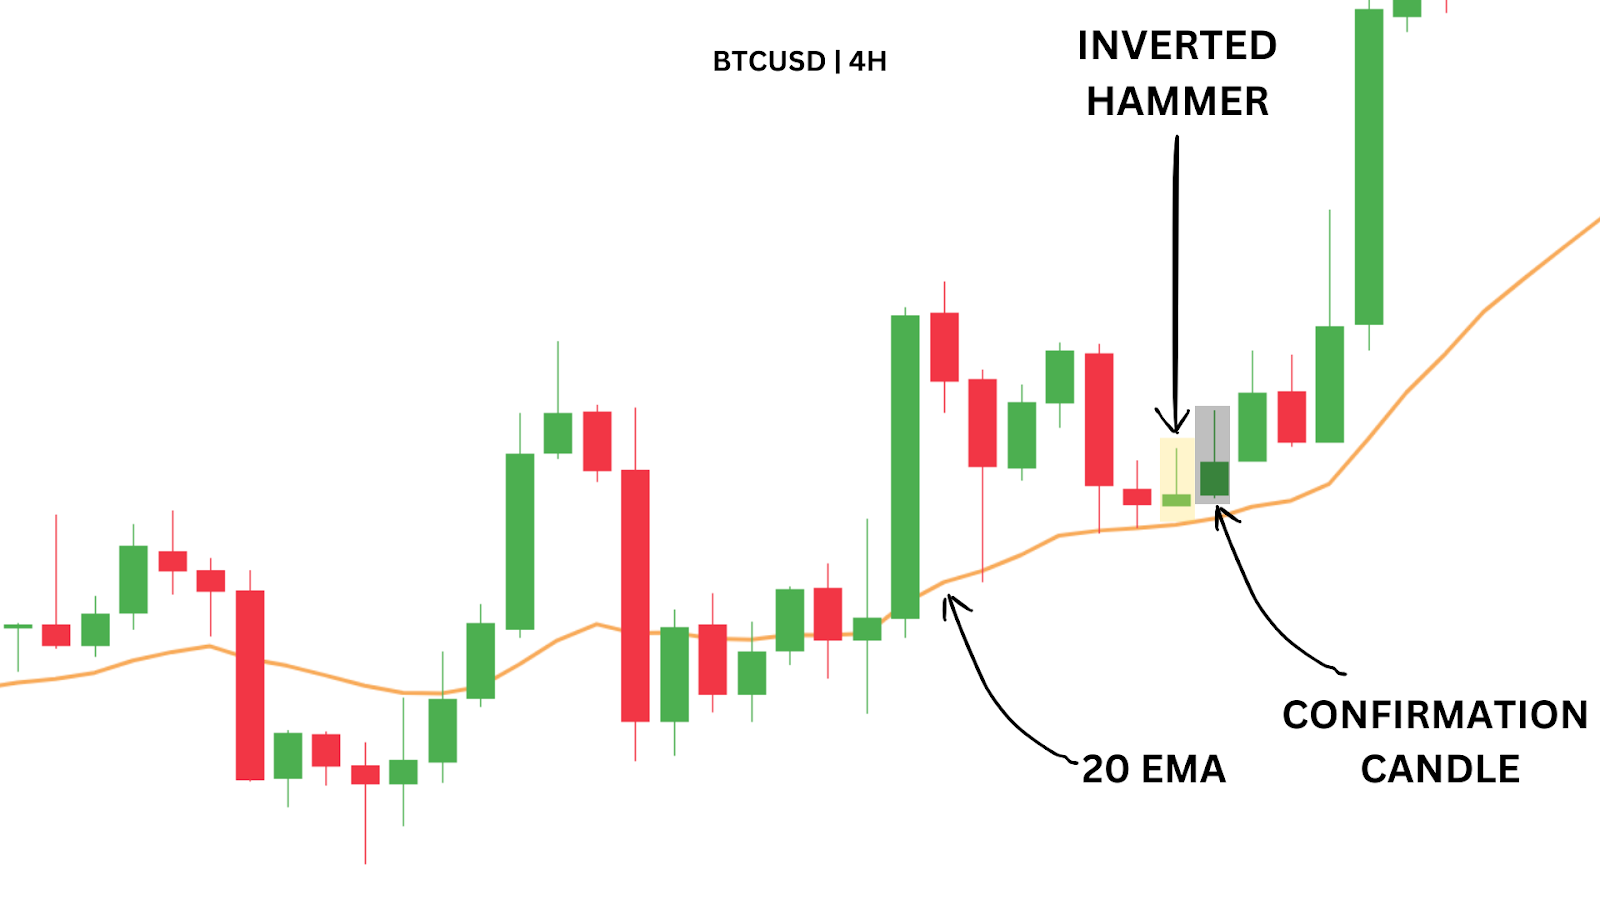
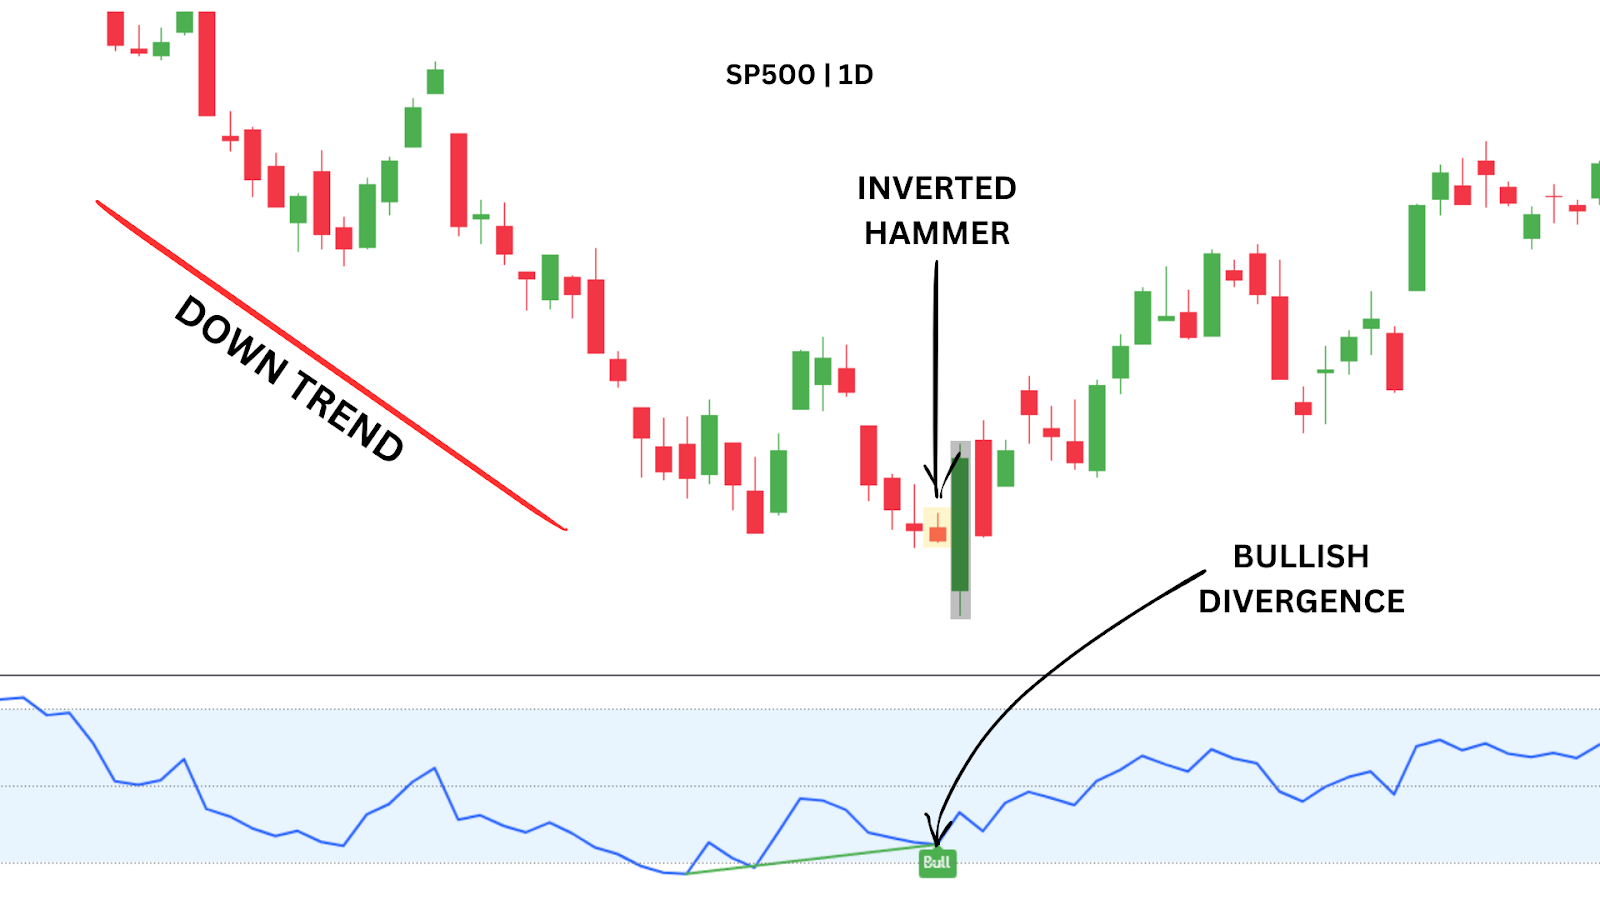
Method Two: Aggressive Second Bottom Entry (High Risk Strategy)

This strategy involves entering at the second bottom – before the neckline breakout – aiming to catch the reversal early.

It’s a higher risk approach, but it offers a better entry price and a tighter stop-loss, making it attractive for traders confident in reading early momentum shifts.
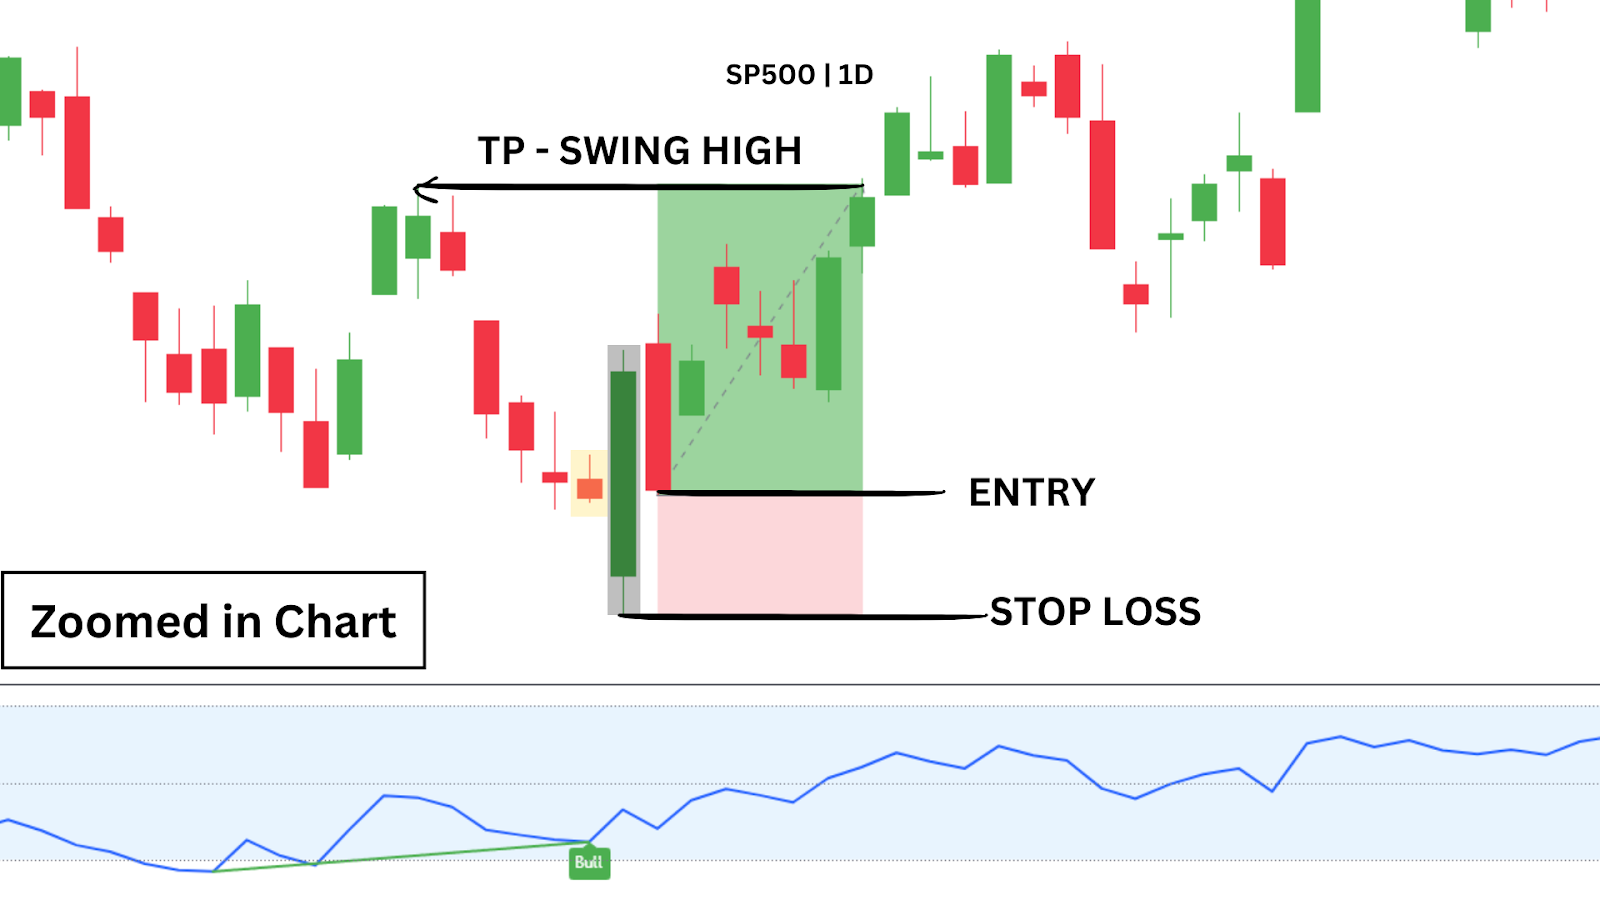
Setup:

  • Formation: Price forms a double bottom at key support, with the second bottom holding at or near the same level.
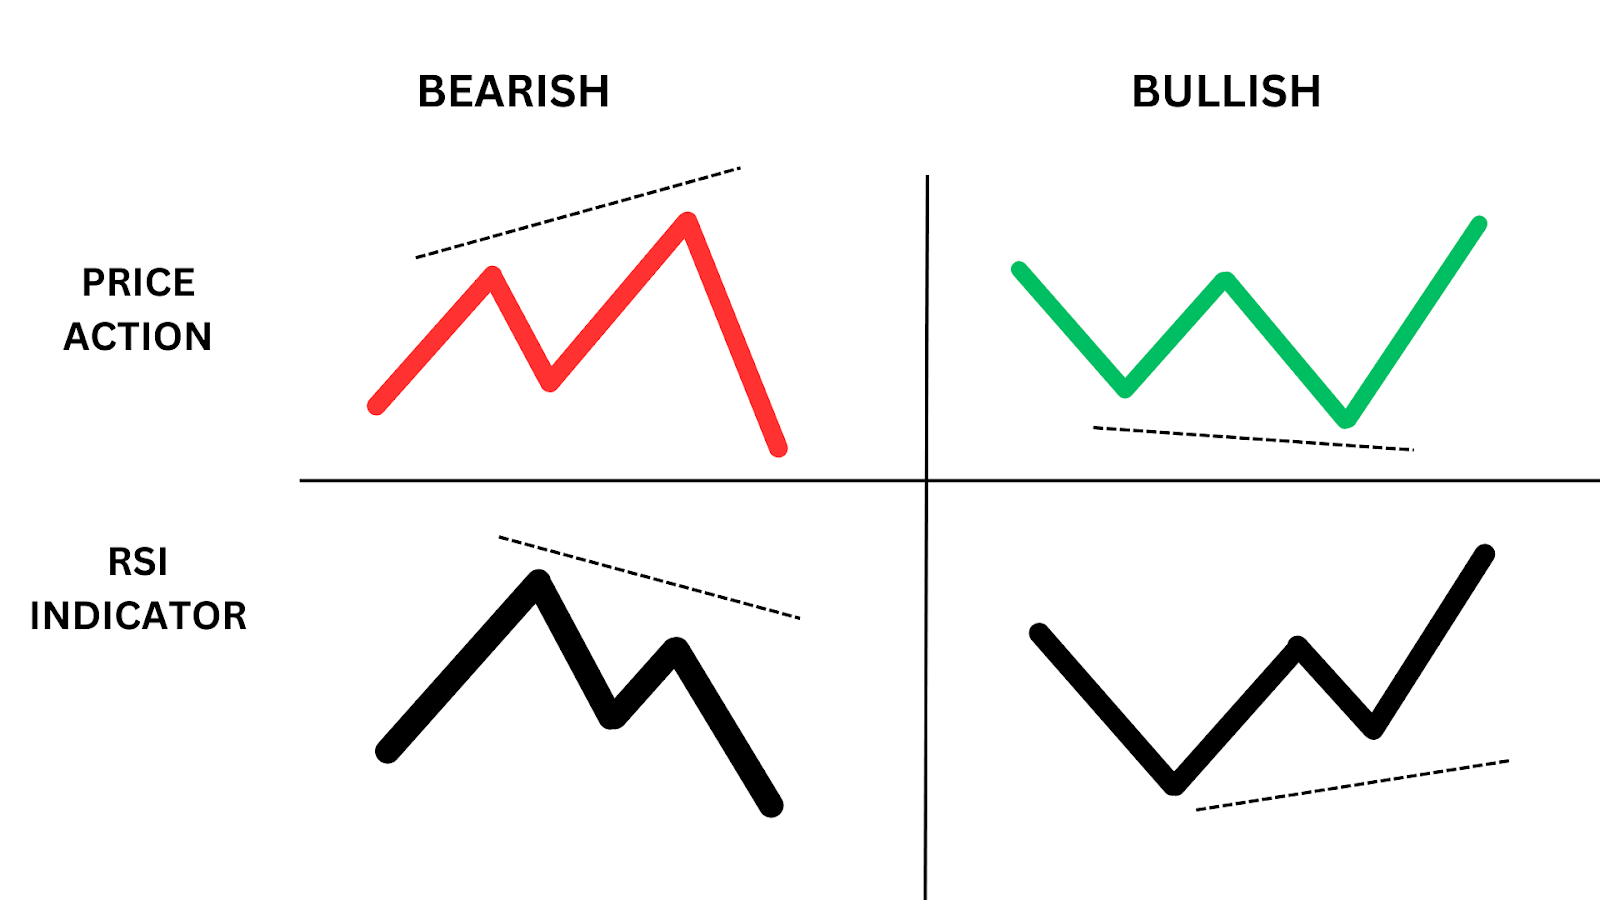
  • Momentum Shift (RSI Indicator): RSI prints a higher low, price forms an equal or lower low.
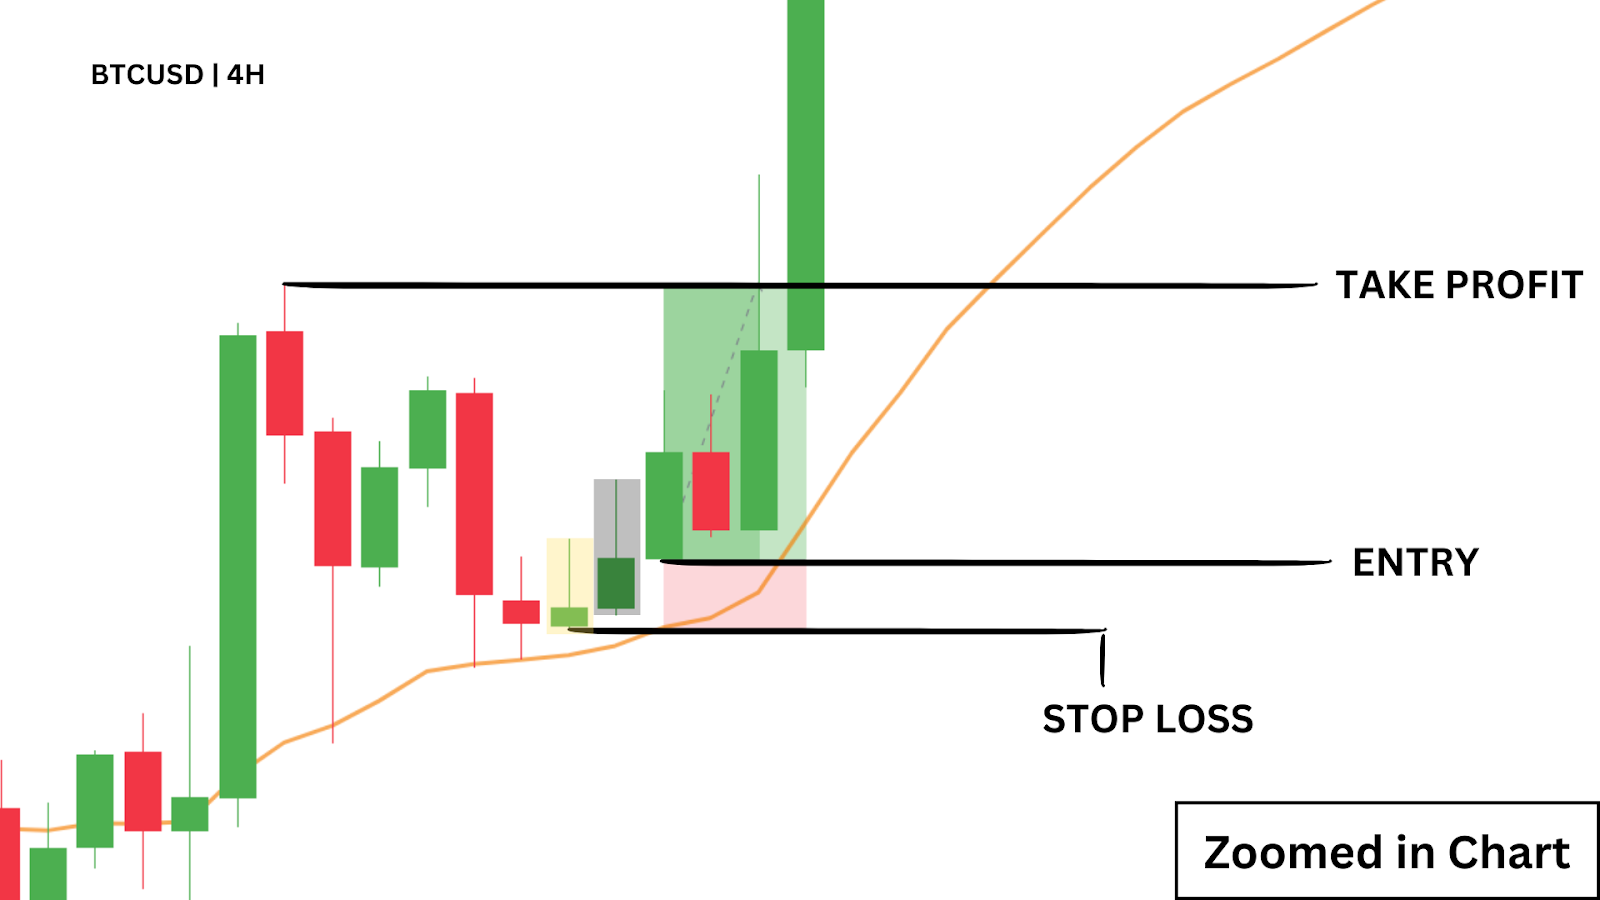
  • Entry: On the bullish candle close after the second bottom forms and rejection is confirmed.
  • Stop Loss: Just below the wick of the second bottom.
  • TP1: At or just above the neckline.
  • TP2: At the measured move target (bottom-to-neckline height projected upward).
  • TP3 (optional): Prior high or next major resistance level.
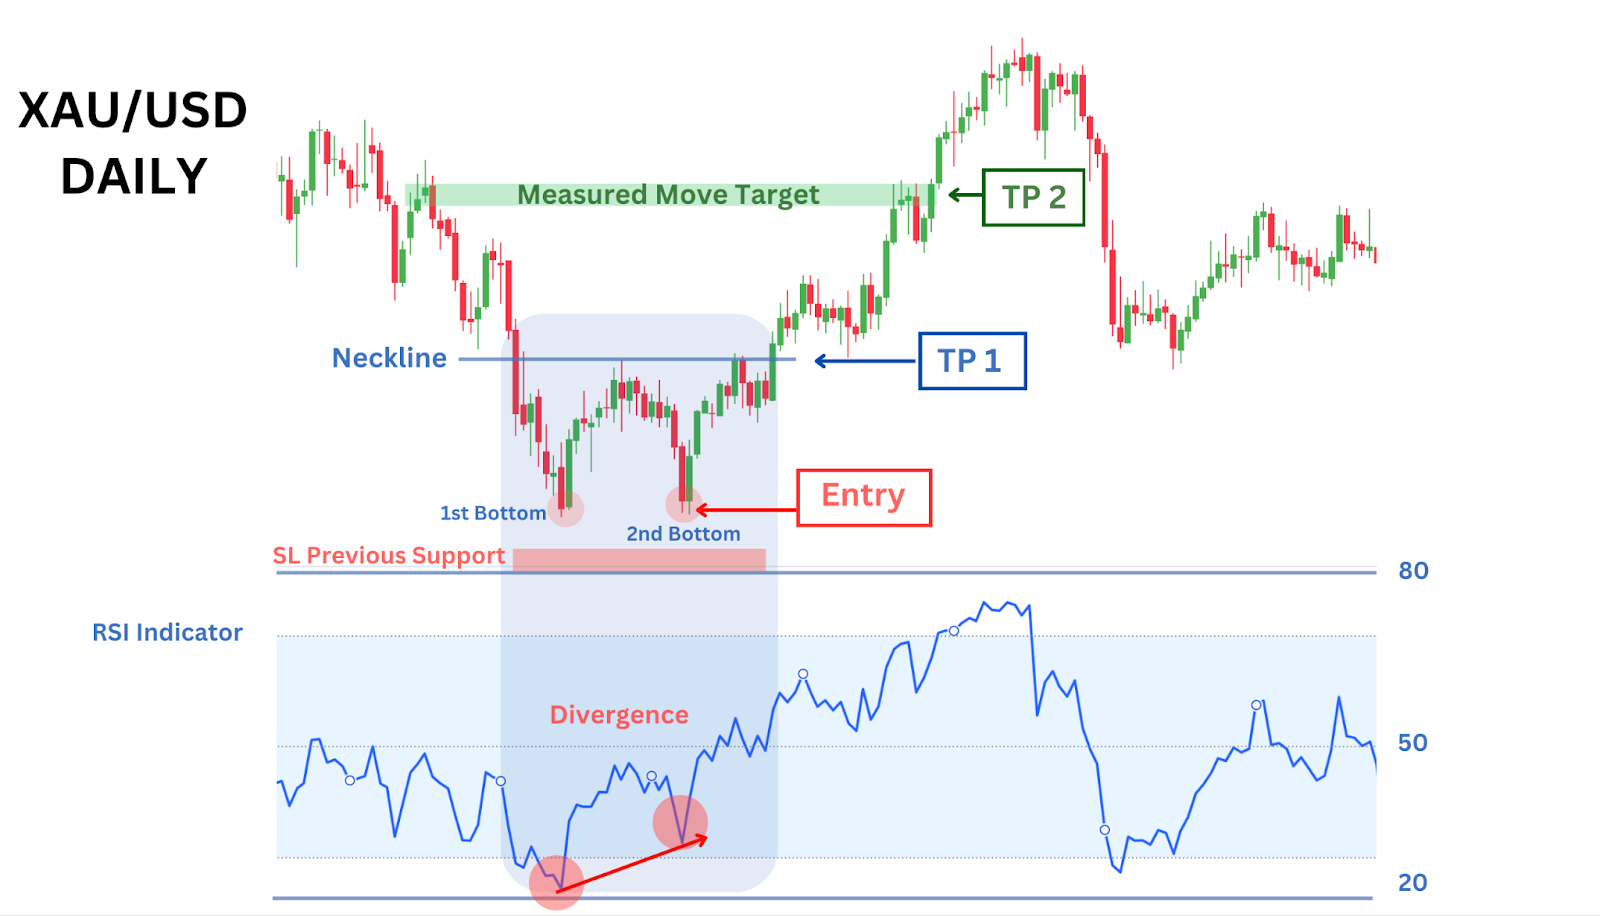
(Example: Aggressive Second Bottom Entry with Bullish RSI Divergence)

Why This Works:

  • The presence of a bullish divergence gives confidence for a reversal near the previous low
  • The neckline serves as a high probability target, unless there are key resistances below
  • Offers a strong risk-to-reward, going beyond the standard 1:1 RR a double bottom typically has

Drawback:

  • The price can trail lower despite a bullish divergence, making this a risky entry

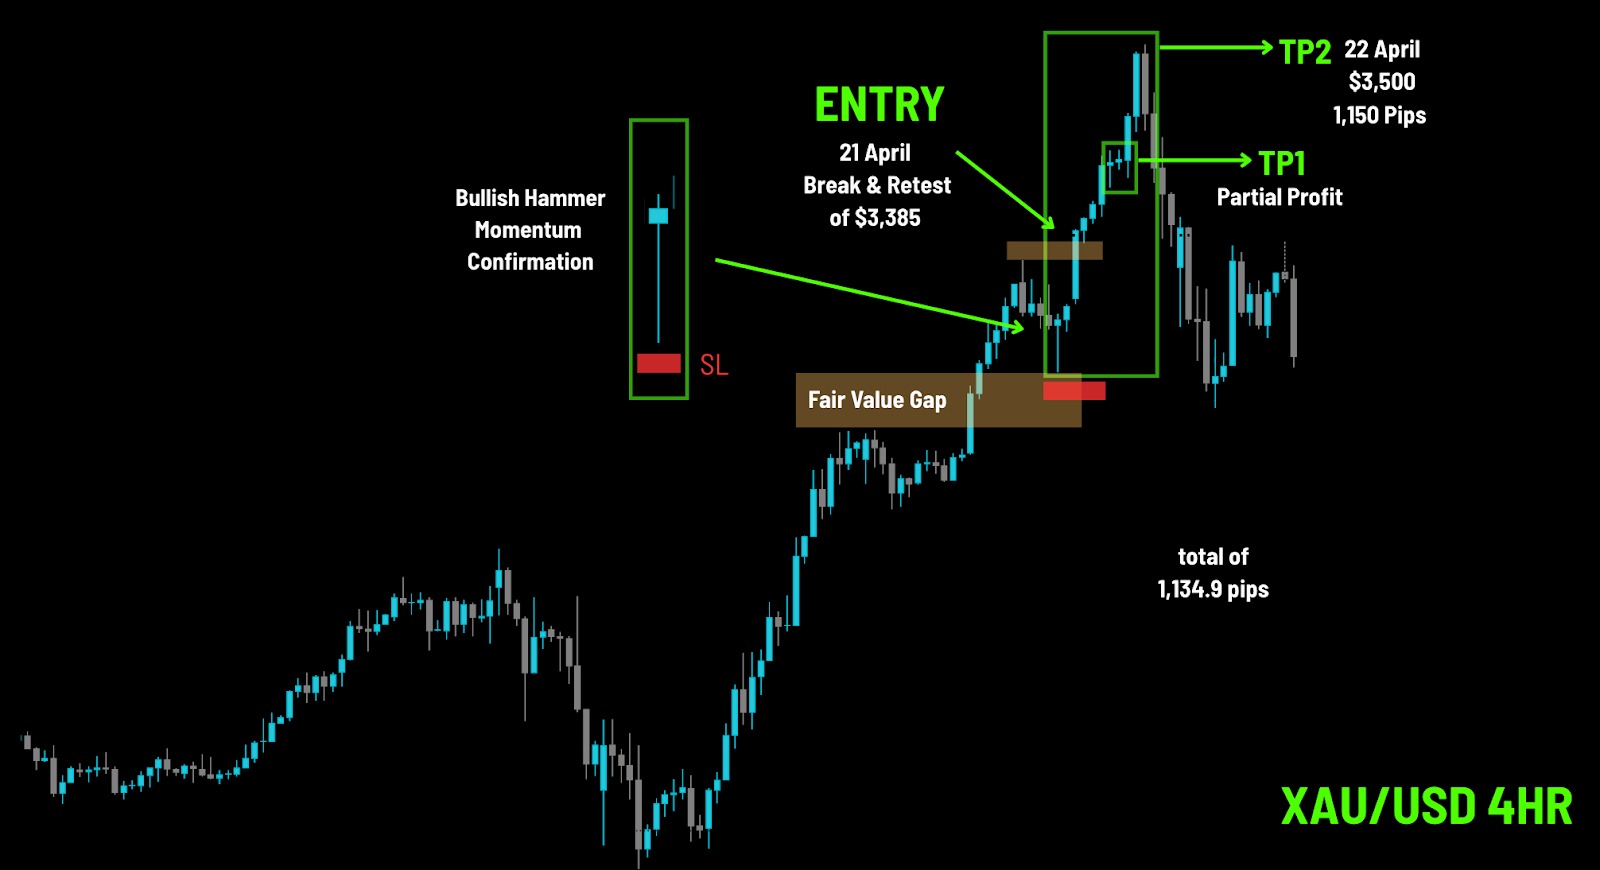
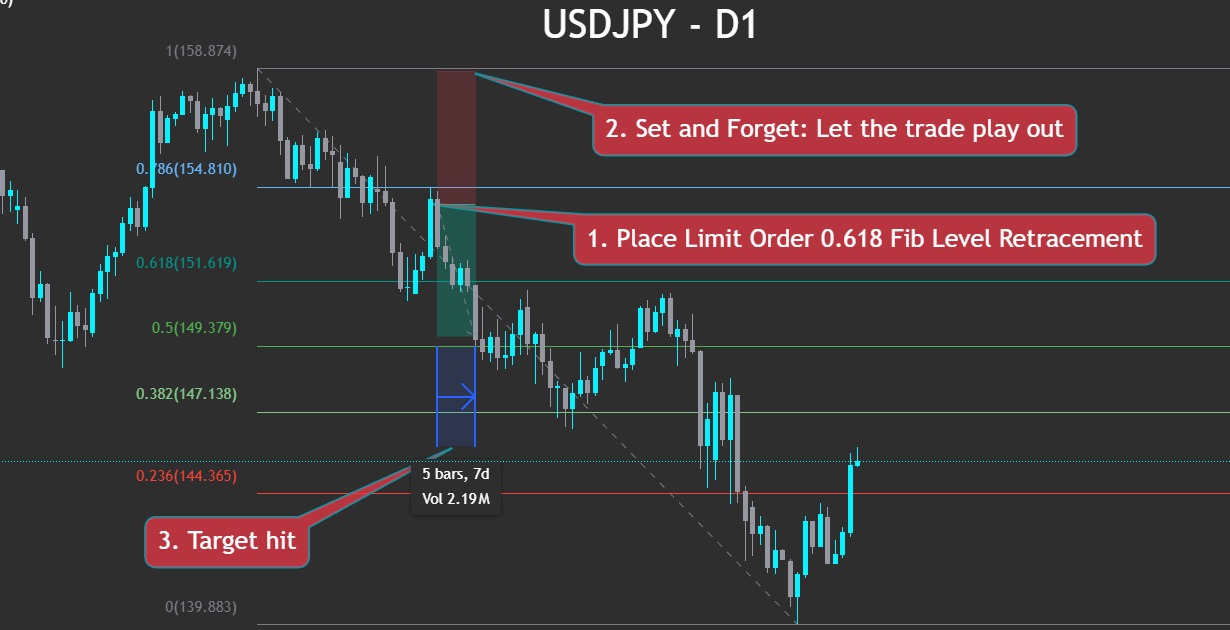
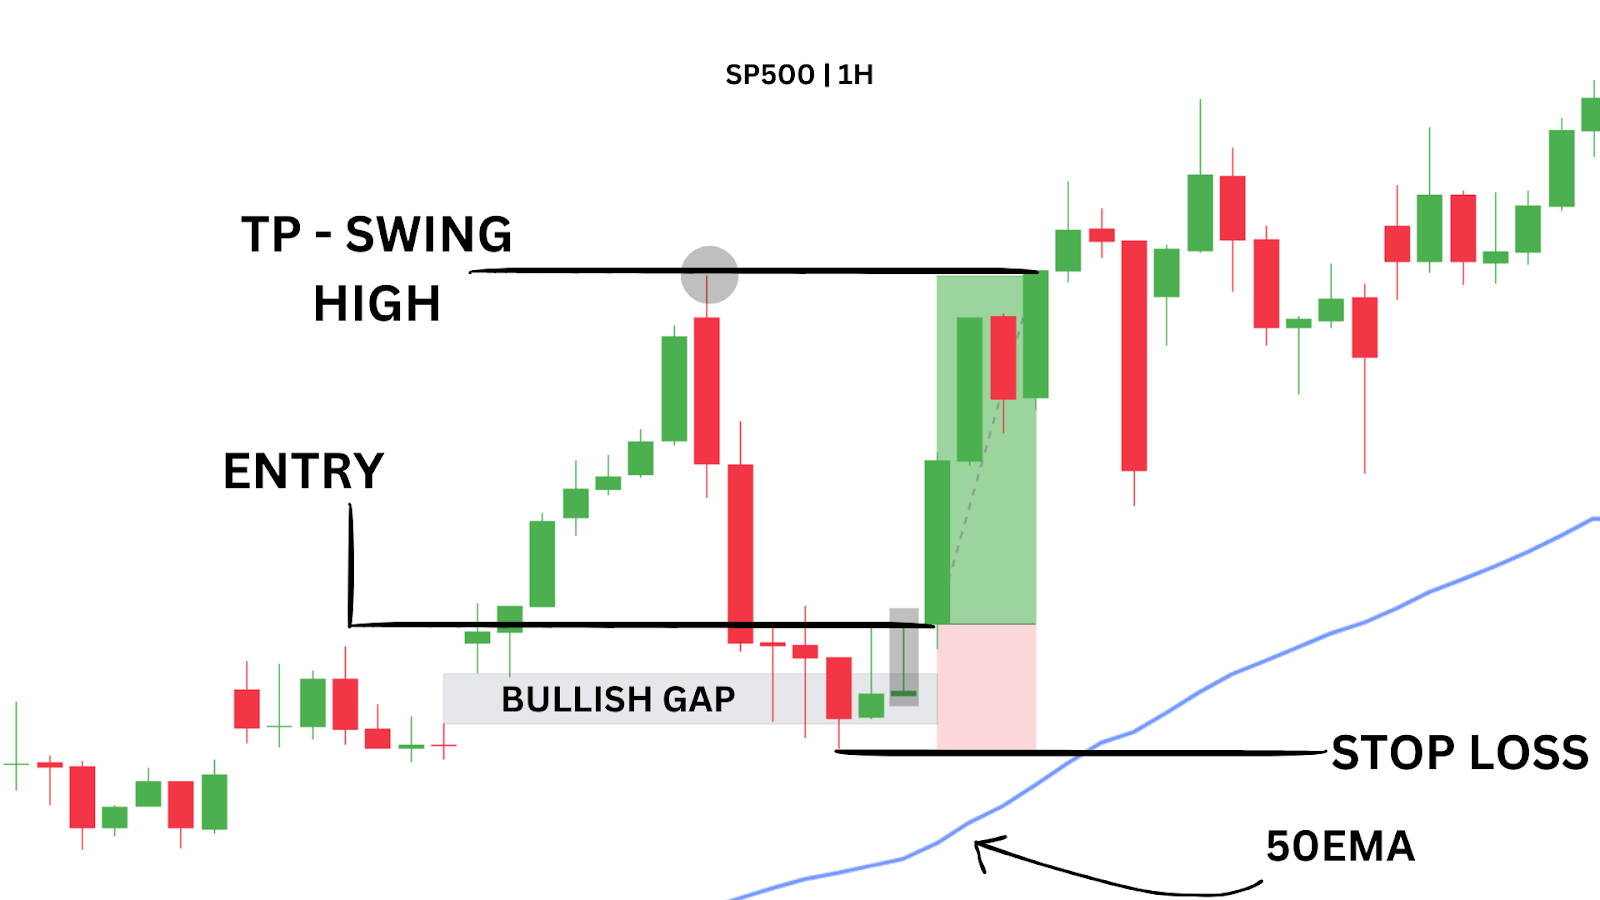
Method Three: Fair Value Gap Retest Strategy

This is somewhat of a more advanced strategy that combines with Smart Money Concepts techniques. Once a double bottom pattern breaks out, price sometimes moves so aggressively that it skips over certain levels, creating a Fair Value Gap (FVG).

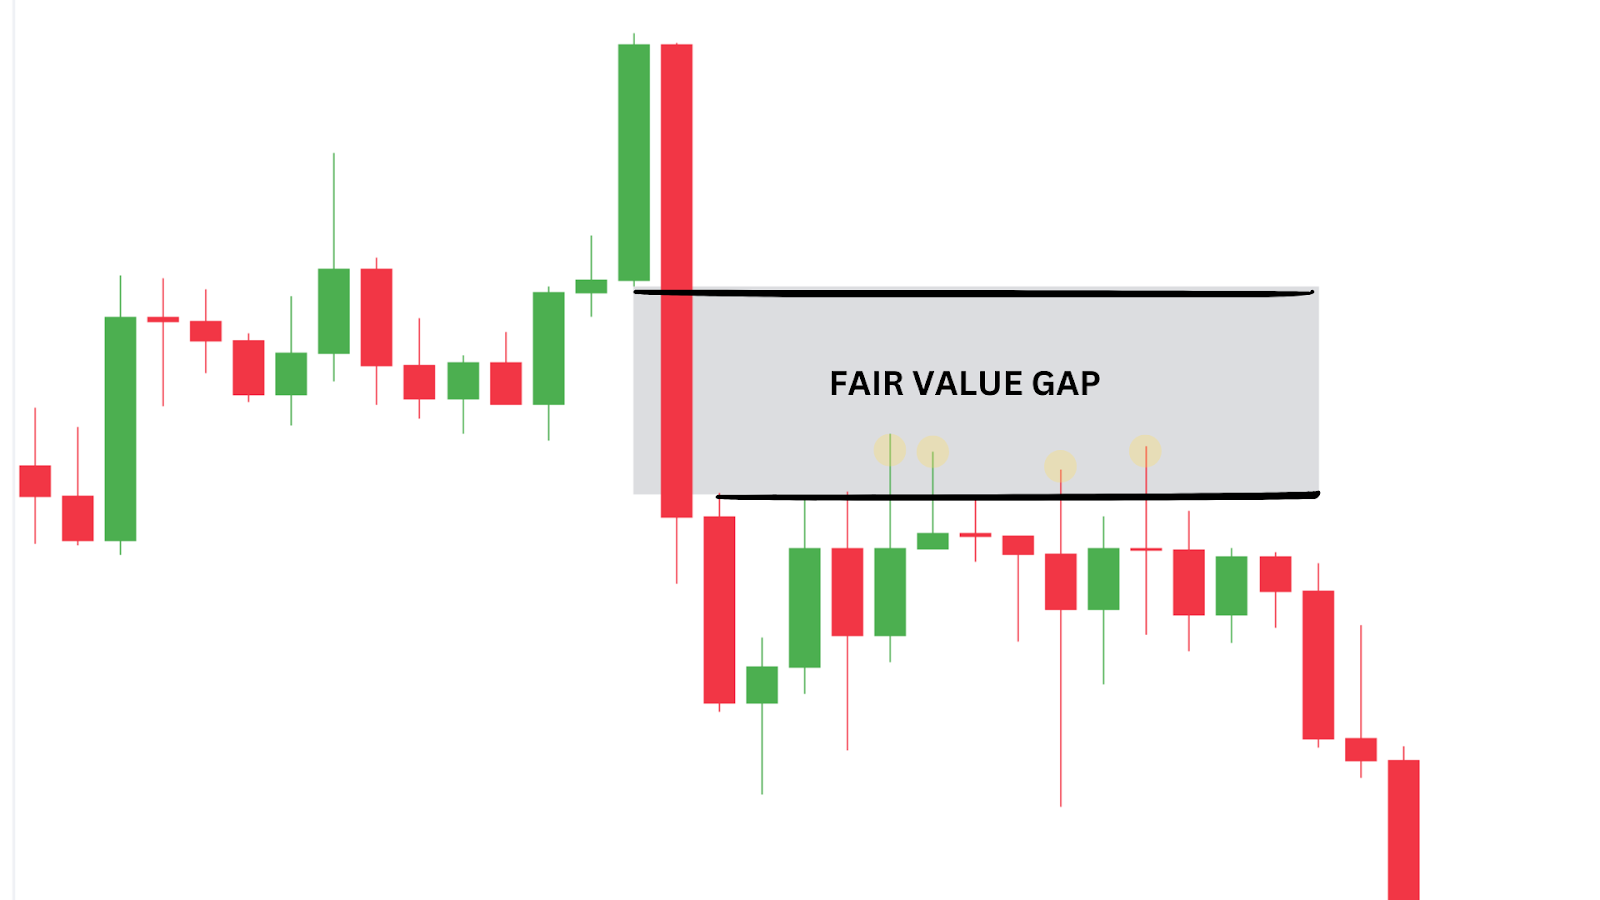
What is a Fair Value Gap (FVG)?

A Fair Value Gap is a gap between candles where price moves so quickly that the first candle’s wicks do not overlap with the third candle’s wicks. This creates a gap within the second candle, and a temporary imbalance — a point in time where price moves so fast that not all buy orders were filled in an area. In many cases, price will return to fill this gap before continuing the breakout direction.

Why it Matters:

  • FVGs act like magnets – price often revisits them to “rebalance” liquidity.
  • They provide low-risk re-entry zones after a confirmed breakout.
  • They symbolise strong momentum in the chart, which validates the breakout on a double bottom.

A fair value gap that occurs during the breakout of a double bottom pattern signals two things: the breakout has high momentum, and that price is likely to retrace to the FVG.

The FVG tends to also align with the neckline, but there are scenarios where the FVG occurs below or above the neckline. This guards against scenarios where the double bottom makes a false breakout, only to retrace slightly and rally again.

Setup:

  • Formation: Confirmed double bottom with neckline breakout, and a Fair Value Gap.
  • Entry: On bullish rejection candle as price taps into the FVG zone.
  • Stop Loss: Below the FVG retest zone or previous low, providing a much better risk-to-reward.
  • TP1: At the measured move target.
  • TP2 (Optional): At the next major resistance level.
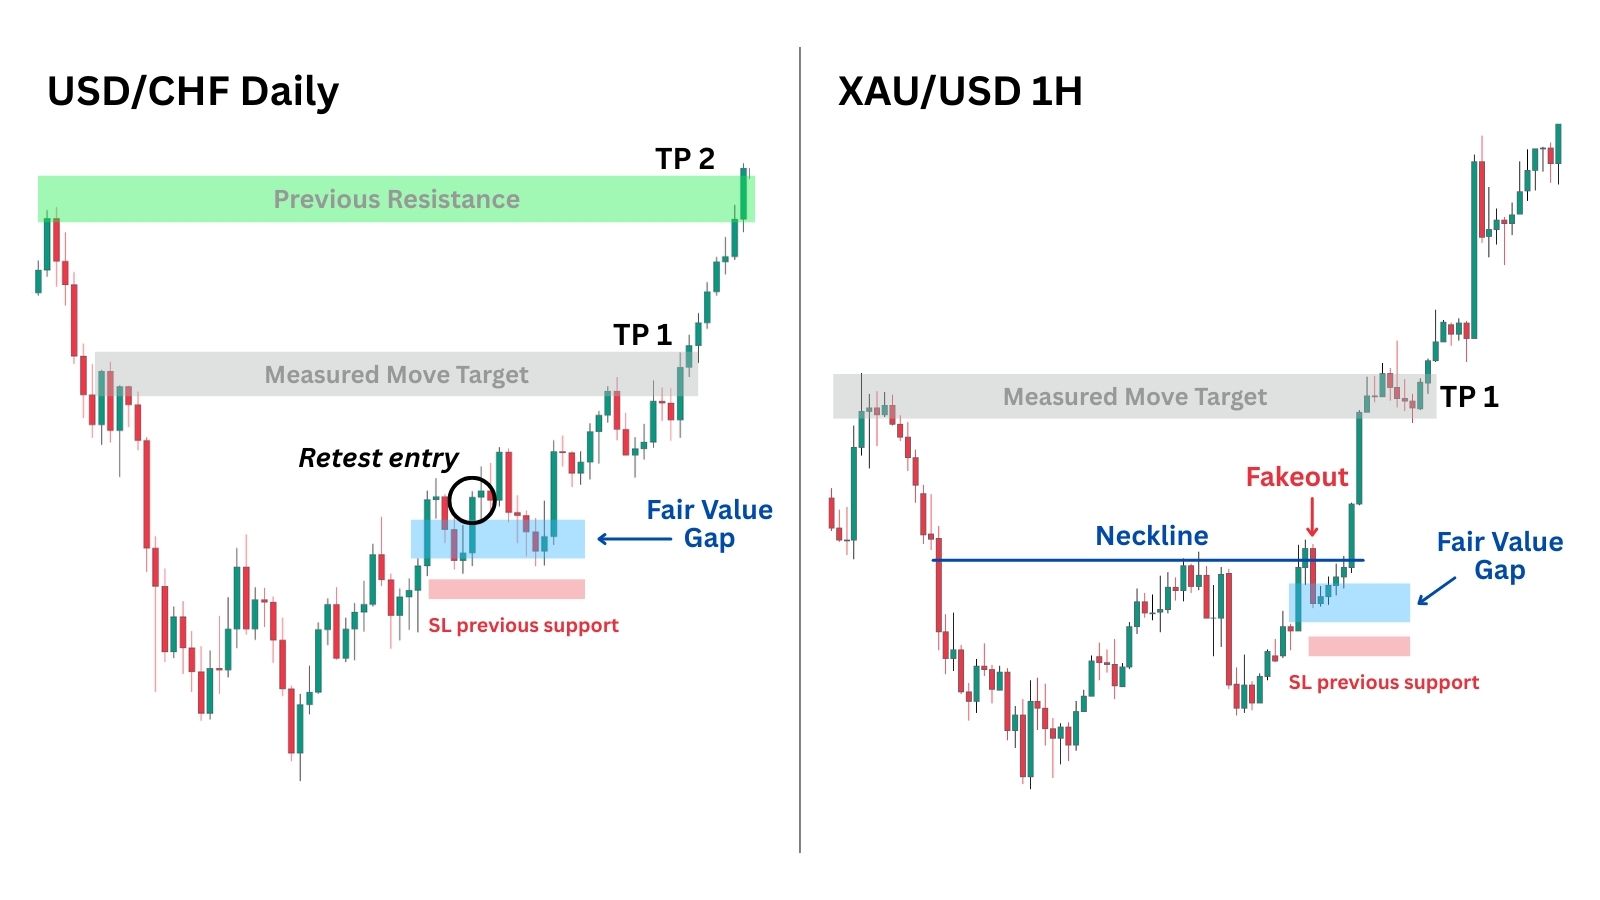
Why This Works:

  • The Fair Value Gap confirms strong momentum — it’s not just a breakout, it’s backed by imbalance.
  • The gap retest filters out weak entries, giving a clear spot to define risk.
  • Targets align cleanly with measured moves and key resistance — strong R:R, no guesswork.

Drawback:

  • Momentum can fade fast — price may slice through the gap without reacting, turning the setup into a trap.

Closing Thoughts on the Double Bottom Pattern

Double Bottom patterns remain one of the most reliable – and often misunderstood – chart patterns in technical analysis.
While its structure appears simple, the real skill lies in recognising where and when it forms, what the price action is signalling, and how to enhance the setup with additional confluences such as RSI divergence, volume confirmation, or Fair Value Gap retests.

Whether you’re scalping intraday moves or swinging major reversals, the Double Bottom offers clear structure, logical risk management, and repeatable setups across all markets and timeframes.

Remember:
Simplicity doesn’t make a setup weak. The best traders are the ones who can spot the “W” pattern early – before the broader market reacts.

Advantages of Trading the Double Bottom Pattern

Widely recognised:One of the most trusted reversal signals in technical analysis, familiar to traders at all levels.
Clear structureThe “W” shape is easy to spot and plan around, especially when paired with RSI or FVG.
Built-in risk managementNaturally defines a stop loss (below second bottom) and clear take-profit targets.
Works across marketsApplies to forex, indices, crypto, commodities, all asset classes and timeframes.
Scalable entriesFlexible for aggressive, conservative, or re-entry setups depending on your trading style.

Disadvantages of Trading the Double Bottom Pattern

Prone to fakeoutsWithout confirmation (e.g. RSI divergence, volume), early entries may fail.
Can be slow to formOn higher timeframes, the full pattern may take time to complete.
Context is criticalA double bottom in a strong downtrend may be a trap without additional confluence.
Not always textbookUneven or imperfect bottoms can confuse traders who rely on perfect symmetry.

FAQs

What’s the difference between a double bottom and a double top?

A double bottom is a bullish reversal pattern that forms after a downtrend. It signals that price has rejected the same support twice and may rally. Double top patterns are the opposite – a bearish reversal after an uptrend, forming with two peaks instead of two bottoms.

How do I know the pattern is valid?

You need three things:

  • Two distinct lows near the same price level
  • A neckline between them (highest point in the pattern)
  • A breakout and close above the neckline

Bonus confirmation: RSI divergence, volume spike, or a neckline retest.

What’s the best timeframe for spotting double bottoms?

Double bottoms work across all timeframes – but:

  • 1H–Daily: Better for clean structure and swing trades
  • 1M–15M: Ideal for scalps, but requires tighter execution and strong confluence

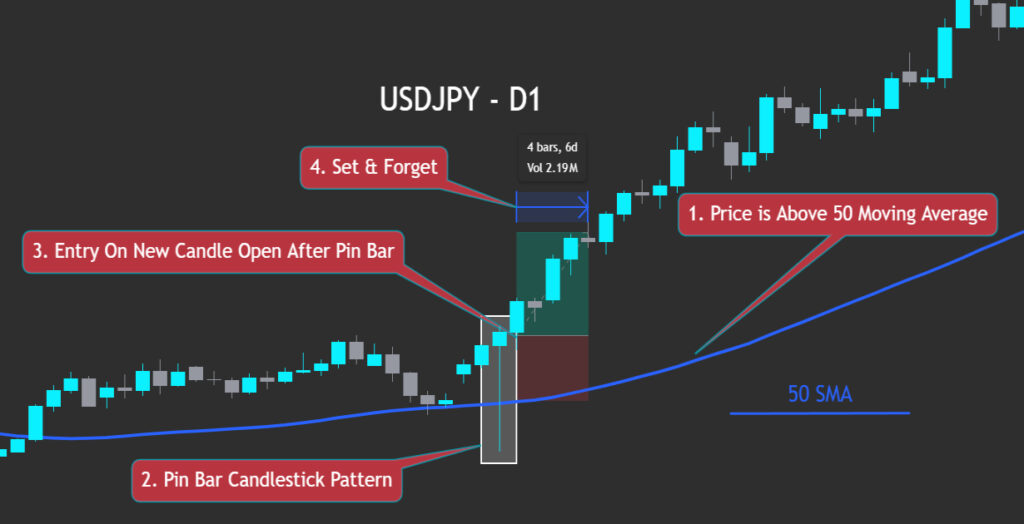
Can I trade Double Bottoms without indicators?

Yes – structure is king. But using confluence from indicators like RSI, EMA, FVG, or volume can help filter out low-quality setups and improve entry timing.

Where should I place my stop loss and take profit?

  • Stop Loss: Below the second bottom (or below the FVG zone if you’re trading a retest)
  • TP1: Neckline
  • TP2: Measured move projection
  • TP3: Previous resistance or the next major structure high

Are all double bottoms the same?

No – some have equal lows, others don’t. Some break cleanly, others come back to retest. What matters is the psychology: sellers attempt to break support twice and fail, giving buyers the upper hand. Confirmation and context are key.

FXIFY Trade of the Month: April Recap

Welcome to the April edition of the FXIFY™ Monthly Recap – your full review of standout trades, key market moves, and top performers across the FXIFY™ community.

April offered volatile conditions and clear opportunities for those who stayed prepared. 

Let’s dive in.


April reignited risk tensions across global markets. The U.S. imposed new 25% tariffs on Chinese electric vehicles and technology, prompting investors to rotate out of equities and into safe-haven assets. As a result, gold surged past $3,250 for the first time, while the dollar weakened amid persistent inflation and reduced expectations of a near-term Fed pivot.

Meanwhile, the Bank of Japan triggered a rare high-volatility move by tightening its yield curve control policy, leading to a sharp appreciation in the yen. USD/JPY dropped more than 800 pips from the beginning of April, marking the largest decline in 2025.

Traders who stayed focused on macro drivers and well-defined technical structure found high-quality setups across commodities, indices, and major FX pairs.

Let’s take a closer look at the standout trades, key setups, and top-performing traders from April 2025.

Top 5 Payouts of the Month

Congratulations to this month’s top performers.

Through clear structure, sharp execution, and disciplined risk management, these traders earned their place at the top of the FXIFY™ leaderboard:

RankTraderAccount SizePayout AmountBiggest Win
1Rasul I.$400K – Two Phase – LIVE$40,999.00$38,096.00
2Tomas R.$200K – Two Phase – RAW$35,494.00$26,448.00
3Ammara A.$400K – Two Phase – RAW$24,439.00$17,810.00
4Quoc VD.$200K – Two Phase – RAW$15,914.00$13,908.00
5Afaque AF.$200K – Two Phase – RAW$11,700.00$7,746.00

Trade of the Month: Surayo A. Secures $27,860 on XAUUSD

April’s standout trade came from Surayo A., who secured a $27,860 gain trading XAU/USD on a $200K funded account. Executed during gold’s parabolic surge toward new all-time highs, the trade demonstrated strong multi-timeframe confirmation, sharp execution, and disciplined risk control – all within just 51 minutes.

$27,860
Gain Realised
XAUUSD
Pair Traded
51 MINUTES
Holding Time

This wasn’t a lucky win – it was a fast, structured trade based on timing, precision, and market understanding.

Surayo traded the 1-minute chart, where every second counts. Instead of jumping in early, he waited for price to drop below a key support level, trigger a liquidity sweep, and then bounce back. This showed that sellers were likely trapped, and buyers were stepping in.

He entered the trade at 12:13 UK time, just as the New York session began – a period known for high volatility and institutional volume. After a clean double bottom formed and price reclaimed structure following a liquidity sweep, Surayo entered long with confidence.

He held the position as price pushed higher, managing the trade with clarity and control. When price reached a previous support-turned-resistance zone and was rejected multiple times, he recognised that momentum was fading. 

Rather than risk a pullback, Surayo closed the trade at $3,327 just 51 minutes later – securing $27,860 in profit with precise execution and disciplined risk management.

Trade Breakdown

  • Entry:
    Surayo entered long at 12:13 UK time on 23 April 2025, after price formed a clean double bottom on the 1-minute chart. The second low triggered a sharp liquidity sweep, flushing out sellers before price quickly reversed. Instead of waiting for full candle confirmation, he entered as structure was reclaimed, a clear sign that buyers were taking control.

  • Exit:
    The trade was closed at 13:05 UK time at $3,327, 51 minutes later, after price reached a previous support-turned-resistance zone. Multiple rejections at this level, combined with clear signs of fading momentum, signalled that the move was likely running out of steam. Reading the shift early, Surayo closed the trade decisively, locking in $27,860 before any pullback could develop.

  • Risk Management:
    A tight stop-loss was placed just below the liquidity sweep at $3,302, giving the setup room to play out while maintaining limited downside. The trade offered a strong 1:4 risk-to-reward ratio and was managed with clear structure, timing, and discipline from entry to exit.

Move of the Month: Gold Surges 1,150 Pips in 24 Hours

April’s most powerful move came from XAU/USD, which delivered a staggering 5,319 pips of upside across the month – including a 1,150-pip surge over just 24 hours, from 21 to 22 April 2025, as price rocketed to a new all-time high of $3,500 per ounce – a level forecasted in advance by UBS, Citi, and Bank of America. 

The rally was driven by a triple threat of macro catalysts: escalating U.S.–China trade tensions, mounting global recession fears, and accelerated central bank gold accumulation aimed at reducing reliance on the U.S. dollar. 

For FXIFY™ traders, the move offered a textbook breakout continuation. 

The setup began with a bullish hammer candle, confirming strong buyer intent and leaving behind a visible fair value gap (FVG) – a signature of institutional momentum. A clean break-and-retest entry at $3,385.00 followed, with a tight stop-loss placed beneath the FVG wick. 

The move accelerated rapidly, hitting TP1 on the first signs of momentum loss, and extended to TP2 at the forecasted $3,500 target, where a tweezer-top reversal signalled exhaustion – opening the door for a potential short or larger pullback. 

With the six-month candle close approaching in May, all eyes are on whether this move sets the tone for the next macro leg. Structurally clear, fundamentally driven, and technically precise, this trade reflected exactly what high-level execution looks like in a volatile environment.

XAU/USD April Price Action Overview

Start Date: 21st April
End Date:22nd April
Starting Price: 3,385.00
Ending Price:3,500,00
Pip Change: 1150
Percentage Change:+3.40%

Top Traded Assets of April

April brought sharp directional moves across FX, commodities, and indices, with FXIFY™ traders dialled in on momentum-fuelled setups and macro-sensitive assets. 

While XAU/USD, EUR/USD, and USTEC remained the most actively traded pairs within the community – consistent with March – the market environment shifted significantly. 

Changes in sentiment, volume rotations, and event-driven volatility shaped the trading landscape and defined April’s key opportunities.

SymbolTotal Trade Volume% Price Change M/M
XAUUSD$44,975,730,386+5.61%
EURUSD$12,024,599,596+4.75%
USTEC$7,767,722,243+2.63%

🏅 XAU/USD (Gold)

Gold gained +5.61% month-on-month, closing April at new all-time highs above $3,250 per ounce. Although trade volume dipped compared to March, trader interest remained strong as gold extended its rally on continued central bank demand, geopolitical uncertainty, and tariff-driven safe-haven flows. FXIFY™ traders capitalised on breakout continuations, fib-based re-entries, and clean level-to-level momentum setups.

💶 EUR/USD

EUR/USD climbed +4.75%, slightly outpacing March’s rally as eurozone data and ECB commentary continued to support the single currency. The pair maintained well-defined technical structure, offering reliable break-and-retest setups and strong intraday continuation plays across both London and New York sessions.

📊 USTEC (Nasdaq 100 Index)

USTEC climbed +2.63% in April, reversing March’s bearish close. The index was buoyed by renewed tech sector optimism and easing concerns over interest rate hikes. While volatility persisted, FXIFY™ traders capitalised on intraday continuation plays, fib-based re-entries, and clean breakout setups during high-volume U.S. sessions.

The Next Top Trader Could Be You!

This month, Surayo A. demonstrated what’s possible when preparation meets precision – securing $27,860 on XAU/USD in just 51 minutes with clean execution and defined risk.

Following in the footsteps of standout performers like Aawez in March and Atanas in February, Surayo now joins the ranks of FXIFY™’s top traders. His confidence, clarity, and technical discipline are proof that one well-executed trade can shift your trajectory.

Whether you’re scaling capital or still refining your edge, every top trader starts with the same foundation: clear structure, disciplined risk, and the decision to show up with intent.

Your next breakthrough is one focused setup away. Stay sharp. Stay consistent.

We’ll see you on the leaderboard.

Month Forward: May 2025 Key Events Watchlist

April ended on a more optimistic note than expected. China quietly rolled back some tariffs on key US imports, signalling a potential de-escalation in the long-running trade tensions. This unexpected move has opened the door for the US to reciprocate—a shift that could have wide-reaching implications across commodities, tech, and global risk appetite. 

As we step into the second half of May, attention turns to inflation data, central bank signals, and how key assets react.

May 2025 Economic Calendar

Taking a look at our FXIFY™ economic calendar, here are our top picks for economic news to look out for in May.

DateAssetEvents
Week One
(May 1 – 4)
JPY
USD
USD
EUR
USD
AUD
BOJ Press Conference
U.S. Unemployment Claims
U.S. ISM Manufacturing PMI
ECB CPI Flash Estimate y/y
U.S. Non-Farm Employment Change
Australia Parliamentary Elections
Week Two
(May 5 – 11)
USD
NZD
GBP
USD
GBP
U.S. ISM Services PMI
New Zealand Unemployment Rate
UK Construction PMI
U.S. Federal Funds Rate
BOE Monetary Policy Report
Week Three
(May 12 – 18)
USD
AUD
GBP
USD
U.S. Core CPI
Australia Unemployment Rate
UK GDP m/m
U.S. Core PPI m/m
Week Four
(May 19 – 25)
CAD
EUR
EUR
EUR
USD
Canada CPI
ECB Financial Stability Review
French PMI
German PMI
Flash Services PMI
Week Five
(May 26 – 31)
NZD
USOIL/UKOIL
USD
RBNZ Monetary Policy Statement
OPEC Meetings
Core PCE Price Index m/m

The first two weeks of May were front-loaded with major events. The FOMC held rates steady on May 1 but hinted at caution around inflation, tempering market expectations for summer cuts. Non-Farm Payrolls came in slightly below forecast, softening the dollar while lifting equities and gold. The BoE also held rates but was more dovish in tone, nudging GBP lower across the board.

FXIFY™ permits news trading on evaluations, but it’s important to note that volatility around key economic releases can increase slippage, spreads, and execution risk. 

1. USD – Federal Funds Rate

As expected, the Federal Reserve kept interest rates unchanged at its May 1 meeting. Markets were less focused on the decision itself and more on Powell’s tone during the press conference. While he acknowledged some signs of economic softening—particularly in labour data—his overall messaging leaned cautious, with little urgency around cuts. This resulted in a muted reaction in EUR/USD, with the pair initially spiking higher before retracing as the dollar found support on reaffirmed inflation concerns.

According to Trading Central’s Volatility Tab, historical Fed rate decisions have caused an average move of 46.39 pips in EUR/USD within the first hour. In this case, the move aligned with the historical pattern: initial volatility followed by a fade, as traders digested the Fed’s data-dependent stance.

2. US Core CPI 

The upcoming US Core CPI release will be one of the most closely watched data points this month. Core inflation remains a key factor in the Fed’s rate path, and another firm reading would reduce the chances of cuts in the near term, likely supporting the US dollar. On the flip side, if inflation shows signs of easing, it could trigger USD weakness and lift risk assets like EUR/USD and equities.

Historically, CPI releases tend to generate sharp reactions. According to Trading Central’s Volatility Tab, EUR/USD moves an average of 40.62 pips within one hour after the event, with a 50/50 split between bullish and bearish outcomes. Traders should be ready for immediate volatility as markets recalibrate expectations around Fed policy.

3. Bank of England Monetary Policy Report

As expected, the Bank of England held interest rates steady, but the tone of the statement and press conference leaned slightly more dovish than prior meetings. Policymakers acknowledged slowing growth and hinted that the next move could be a cut—possibly as soon as this summer. This led to broad GBP weakness, especially against USD and EUR, as traders adjusted their rate expectations.

Historically, the BoE decision triggers an average move of 39.51 pips in GBP/USD one hour after release. This time, the move followed the pattern of past downside reactions, with the pound selling off sharply before stabilising into the US session.

May 2025 Earnings Calendar

The first half of May brought a wave of earnings from major tech and consumer names, with more critical reports still to come. While Apple and Amazon helped lift early sentiment, attention now shifts to how the remaining companies, especially in tech and retail, may influence broader indices as the month progresses.

📅 Earnings Calendar – May 2025

DateCompanyTickerTimeSector
May 1Apple Inc.AAPLAfter Market CloseTechnology
Amazon.com Inc.AMZNAfter Market CloseConsumer Discretionary
May 6Advanced Micro Devices Inc.AMDAfter Market CloseTechnology
May 7Uber Technologies Inc.UBERPre-Market OpenIndustrials
The Walt Disney Co.DISPre-Market OpenCommunication Services
May 8Shopify Inc.SHOPPre-Market OpenConsumer Discretionary
Coinbase Global Inc.COINAfter Market CloseFinancials
May 13JD.com Inc.JDPre-Market OpenConsumer Discretionary
May 14Cisco Systems Inc.CSCOAfter Market CloseTechnology
May 15Walmart Inc.WMTPre-Market OpenConsumer Staples
May 20The Home Depot Inc.HDPre-Market OpenConsumer Discretionary
May 22Nvidia Corp.NVDAAfter Market CloseTechnology
May 28Costco Wholesale Corp.COSTAfter Market CloseConsumer Staples

May’s key earnings come from Apple, Amazon, and Nvidia, which will heavily influence the Nasdaq and S&P 500. Apple and Amazon kick off the month with insight into consumer and tech demand, while Nvidia’s report on May 22 will shape sentiment around AI and semiconductors. These results are likely to drive volatility and set the tone for broader market direction.

Key Story: Gold vs US Dollar

This month’s key narrative is the battle between Gold and the US Dollar, two classic safe havens diverging in structure and sentiment.

Gold remains firmly in an uptrend, currently consolidating between $3,240 and $3,433 after a strong breakout. Price is respecting a clear ascending trendline from March, and a break above resistance could signal continuation toward the previous high near $3,580. The structure suggests bullish momentum is intact unless we close below support.

Meanwhile, the US Dollar Index (DXY) is in a broader downtrend, capped by a descending trendline and stuck in a sideways range between 98.70 and 99.85. It’s currently testing the upper boundary of this consolidation zone, but repeated rejections hint at weakness unless there’s a clean break above both horizontal and trendline resistance.

The setup is clean: if DXY breaks down, Gold is likely to push higher. But if the dollar finds strength and breaks out above 100, it could stall Gold’s advance or trigger a deeper correction. With CPI and Fed tone in focus, this pair reflects the broader market tug-of-war between easing expectations and persistent inflation risk.

Wrapping Up May’s Outlook

May is shaping up to be a pivotal month, with several key events that could shift market direction, including central bank decisions, inflation data, and major earnings reports. ​​These developments will offer more clarity on interest rate paths and broader market trends. Traders should stay focused on how assets like gold, the US dollar, and equities react around these moments.

With your FXIFY account, you can use Trading Central’s tools to support your trading decisions. The Economic Calendar helps you track upcoming events, Technical Views provide clear chart analysis, and Featured Ideas highlight potential setups based on technical and macro factors—all designed to keep your trading process informed and consistent.

Why ‘Set and Forget’ Trading Works (And When It Doesn’t)

Among the many trading strategies available, one method prioritising planning over constant monitoring is ‘Set and Forget’ trading — a method used worldwide to simplify execution. This strategy involves setting up a trade entry, stop-loss, and profit target, and then letting the market run its course without intervention. But is this Set and Forget strategy effective for forex traders, the stock market, and broader global financial markets?

This article explores the Set and Forget approach — its core concepts, pros, cons, and how it fits different trading strategies, including prop trading. This guide helps you decide if this strategy fits your trading plan.

What is ‘Set and Forget’ Trading?

‘Set and Forget’ trading is a strategy where traders do all the analysis beforehand, and place orders with predefined entry, stop-loss, and take-profit levels. Once live, the trade runs independently.

The hallmark of this strategy is non-intervention. The trade will automatically close when either the stop-loss or take-profit target is hit. This detachment reduces emotional decisions and supports discipline and time efficiency.

This approach suits traders who want minimal trade management time and manage their stress levels. Once you set the trade, forget it and come back when it wins and loses. An important note: this approach is usually discretionary—that means entries and exits are based on a trader’s analysis, not purely algorithmic or automated systems.

Limit orders support this passive style by defining entries in advance. You establish the position, walk away, and let the market decide the outcome.

Key Principles of Set and Forget

Three core principles define the Set and Forget trading approach:

  1. Pre-Trade Planning: All trade parameters must be defined before execution. This includes detailed market analysis—primarily technical (support/resistance levels, trendlines, price action), and sometimes fundamental—to determine the exact entry, stop-loss (based on market structure), and a realistic take-profit target. This defines the full trade setup before execution.
  1. No Post-Execution Adjustment: Strict adherence is key. Once the trade is live, traders must resist the urge to adjust stop-loss or take-profit levels, regardless of market movement or emotional impulses. No reacting. No tweaking. Trust the plan.
  1. Emphasis on Discipline: Success depends on trusting the original trade setup, and avoiding emotional decisions during its operation. Let the setup play out without interference from fear or greed.

Why ‘Set and Forget’ Works: The Benefits

Sticking to these principles offers several advantages for this set and forget strategy:

Emotional Control

Trading psychology is one of the biggest challenges that even a professional trader may face. This technique reduces the influence of fear, greed, and impulsiveness by removing the need to manage trades mid-flight. It reduces stress and discourages overtrading.

Time Efficiency

This strategy is ideal for traders who can’t spend much time at the screens or wonder how much time they need to trade effectively. Once a trade is placed, you can walk away — allowing more time for other commitments, strategic development, or simply avoiding screen fatigue.

Enhanced Objectivity

All decisions are made in advance and based on a clear price action analysis. This does not mean reacting emotionally or impulsively when the trade moves for or against you, but rather trusting your initial setup with good risk management. This builds discipline, strengthens trust in your process, and helps you stay consistent over time.

How Set and Forget Fits Different Trading Styles

The suitability of Set and Forget varies by trading timeframe and is not ideal for all trading strategies:

Trading StyleSuitabilityReason / Explanation
ScalpingLowRequires constant, rapid decisions incompatible with the passive nature of Set and Forget. This is one of the unsuitable short-term strategies.
Day TradingMediumCan work for specific setups (e.g., breakouts from key daily levels) but requires careful analysis within the day. A clear trade set with a stop loss and profit target is key.
Swing TradingHighAligns well with holding trades for days/weeks based on analysis of larger market trends (e.g., daily charts), and typically with wider stop loss. This works extremely well with the Set and Forget approach.
Position TradingHighIdeal for long-term trades (weeks/months) based on major market trends, where infrequent adjustments and focus on key levels match the Set and Forget ethos.

Practical Applications and Setups

Several technical strategies work naturally with a Set and Forget approach, especially those that rely on clean, rule-based setups rooted in price action.

Breakout Trades

Look for a clear support or resistance level on the chart. Place a buy stop (or sell stop) just beyond the breakout level, a stop-loss on the opposite side, and a take-profit based on a measured move or prior market structure. Once live, step back and let the trade run.

Fibonacci Retracements

Consider using Fibonacci levels or moving averages to identify likely pullback zones. Enter using a limit order, place your stop-loss beyond the previous swing, and set a target in the direction of the trend.
After entry, avoid adjusting — trust the setup to unfold.

Trend-Following with Price Action

In a clear up‑trend—price above the 50 SMA—you might wait for a bullish pin‑bar or engulfing candle as a continuation signal. Buy on the next candle’s open, set your stop‑loss just below the 50 SMA, and define your take‑profit per your risk/reward plan. Then “set and forget”—let the trade run without mid‑trade edits.

Building Risk Control into Your ‘Set and Forget’ Trade

Effective risk management is critical in Set and Forget trading, especially since you’re not monitoring trades in real-time. Every decision must be precise and pre-planned.

Stop-Loss and Take-Profit Placement

Your stop-loss and take-profit levels should be based on sound technical analysis — such as market structure, recent volatility, or key price zones. Avoid placing them based on emotion or arbitrary profit targets that ignore market conditions. Poorly placed exits can cause premature trade closures, large drawdowns, or even risk triggering a margin call in fast-moving conditions. Rule-based exits are essential.

Position Sizing

Before placing a trade, calculate your position size to ensure the potential loss is only a small percentage of your equity, helping maintain long-term capital preservation.

Backtesting

Always backtest your strategy before going live. This allows you to see how successful your strategy is across different market conditions and trading strategies. Set and Forget relies on trusting the plan — and that trust is built through data.

Market Suitability

Set and Forget works best in clean, trending environments — especially in the forex market, where structure and momentum can support clear setups.

It’s less effective in highly volatile, low-liquidity, or news-driven environments where sudden spikes or gaps can trigger stops unexpectedly. Always assess the trading environment before applying the strategy… adaptability matters just as much as discipline.

Limitations of Set and Forget Trading

While Set and Forget offers structure and discipline, it’s important to understand where it can fall short.

Rigidity

This strategy cannot adapt to real-time market developments. If major news or volatility hits after the trade is placed, the trade continues as planned, even if conditions have changed dramatically. This lack of flexibility is one of its key risks, especially in volatile stock or forex markets.

Missed Opportunities

A fixed take-profit like 1:2 RR means you might exit the trade while the move continues to trend higher. Additionally, if the market reverses just before reaching the take-profit, unrealised gains can disappear entirely. There’s no room to react once the trade is active.

All-or-Nothing Outcomes

Set and Forget trades usually reach either the stop-loss or the full target. Without options like scaling out or trailing stops, large potential gains can turn into full losses. The predefined setup controls the result — for better or worse.

Market Dependence

It performs best in directional markets. In choppy or low-volume conditions, small losses are common. Set and Forget requires the right market context to work effectively.

Optimising the Set and Forget Approach

While Set and Forget prioritises simplicity, you can enhance it without sacrificing core principles. Consider these predefined refinements to boost performance and flexibility:

  1. Flexible Rules (Pre-Planned):
    Establish dynamic management rules in advance, such as moving the stop-loss to breakeven after a certain risk-to-reward milestone (e.g., 1:1). This remains within the Set and Forget mindset.
  1. Trailing Stop-Loss:
    Define a trailing stop before trade execution. It automatically adjusts in your favour, locking in profits while capturing larger moves without manual intervention.
  1. Multiple Targets:
    Plan exits at several predefined levels. For instance, close half the trade at the first target, adjust stop-loss to breakeven and then let the remainder run to the next target.
  1. Contextual Analysis:
    Enhance entry accuracy using top-down analysis—from higher timeframes for broader trends to lower timeframes for precise entries—while preserving hands-off execution.
  1. Trade Alerts:
    Set up automated alerts that notify you as the price approaches key levels. This eliminates constant chart monitoring, aligning perfectly with the Set and Forget approach.

Set and Forget in Prop Trading

Prop firm challenges and funded accounts require strict adherence to predefined rules. Here’s how Set and Forget fits into that environment:

Master Market Level Identification:

Identify precise price levels for entries, stops, and take-profits. These must align with the structure, profit targets, and drawdown limits.

Plan Risk in Advance:

Calculate position size so a loss stays within firm drawdown limits. Avoid relying on manual intervention.

Use a Backtested Strategy with Edge:

Set and Forget only works in prop trading if it’s a proven, profitable strategy. Backtest rigorously to confirm your risk/reward aligns with firm rules and timelines.

Monitor Performance and Rule Compliance:

Track metrics like win rate and average risk-to-reward over time. Confirm that your strategy not only meets your trading edge but also complies with the firm’s rules at every stage — from challenge to funded account.

Trading During Economic News:

In a Nutshell…

Set and Forget trading is a structured approach that balances strategic planning with psychological discipline. Defining trade parameters before execution — including entry, stop-loss, and take-profit — and avoiding mid-trade adjustments, help reduce emotional errors and support time efficiency. For many forex traders, this simplicity and hands-off nature are highly appealing for taking advantage of structured trade setups.

That said, it’s not a universal solution. This method may not suit all traders, especially forex traders using reactive, high-frequency strategies, or market conditions, particularly in choppy or highly reactive environments. But in structured or trending markets — especially swing or position trading — it works well.

Its strengths lie in removing emotional interference, managing time constraints, and encouraging objective, rule-based execution. However, success depends on several key factors: trading skills, strong market analysis, well-calculated position sizing, disciplined risk management, and consistent review of trade outcomes.

When applied carefully, it supports a sustainable, logic-based trading process.

Mastering the Inverted Hammer: A Trader’s Guide to Spotting Reversals

Understanding candlestick patterns is crucial for traders who want to spot potential reversals and shifts. The Inverted Hammer, a powerful bullish reversal signal, can provide key insights at the end of a downtrend. Here’s what you need to know to recognise and trade it effectively.

What is an Inverted Hammer Candlestick?

An inverted hammer candlestick is a bullish reversal pattern that typically appears at the bottom of a downtrend, signalling potential upward movement. 

It has a small body at the lower end of the candle range and a long upper wick, which shows that buyers tried to push prices higher. This buying interest suggests a potential trend reversal, even in a bearish environment.

The inverted hammer reflects buyers testing higher prices, hinting at a possible shift in momentum.

Examples of Inverted Hammer Candlestick Patterns

Not all inverted hammers are equally reliable. The pattern’s strength varies based on timeframe and market conditions:

  • Higher Timeframes: Daily or weekly inverted hammers are more reliable than those on 15-minute or 1-hour charts.
  • Market Context: Patterns near strong support levels or after a defined downtrend hold more weight than those in choppy markets.
  • Additional Confirmations: Using other indicators (e.g., RSI divergence, moving average crossovers) can validate the signal.

Key characteristics that enhance the inverted hammer’s reversal potential include:

  • Appears at Key Support Levels – Indicates buyers stepping in at a critical point, increasing the chances of reversal.
  • Follows a Prolonged Downtrend – Signals potential exhaustion in bearish momentum, making the reversal more credible.
  • High Trading Volume – Shows stronger buying interest, reinforcing the likelihood of a trend reversal.
  • Confluence with Other Indicators – Aligning with bullish indicators like RSI adds credibility.
  • Minimal Lower Wick – Indicates that buyers quickly pushed prices higher with little initial selling pressure.

Let’s explore a real-life example of this pattern in action to see how it can be effectively utilised in trading setups.

Case Study: SP500 Inverted Hammer Candlestick Pattern

On July 11, 2024, the 1-hour SP500 chart provided an excellent example of an inverted hammer in action. After a strong bullish rally, price returned to fill a gap created by prior momentum. 

During this pullback, an inverted hammer formed, followed by another smaller inverted hammer. These candlesticks indicated that buyers were testing the waters and attempting to reclaim control.

With the price positioned above the 50 EMA which was still firmly angled upwards, bullish continuation is likely. The 50 EMA could also be a great place to put stop losses, as will be discussed in trading method one. 

The market then resumed its upward trajectory with a robust move, showcasing how this pattern can act as an early signal for a bullish reversal.

How Do You Trade Inverted Hammer Candlesticks?

The inverted hammer pattern offers versatile trading opportunities, especially when used with additional confluences. Here are three effective methods for trading it.

Method One: Buy at Support

One effective strategy for trading the inverted hammer is to look for it forming near a significant support level, especially when a previous resistance has flipped into support. This support is our bullish gap that was left behind by price action. 

This method leverages the strength of price action combined with the confirmation provided by the pattern itself. 

In our previously mentioned SP500 case study from July 11, 2024, the inverted hammer appeared during a pullback to a key support level at a bullish gap. Market gaps often act as pivotal support or resistance levels when revisited. Here, a confirmation candle – a bullish close following the inverted hammer—validated that buyers were stepping in. 

Traders can place their stop-loss below the most recent swing low (as shown in the image) or the 50 EMA for a more conservative approach, while targeting the most recent swing high for a 1:2.8 risk-to-reward ratio.

Trading Strategy Summary:

  • Entry Point: Market enter after a bullish confirmation candle forms after our inverted hammer.
  • Stop-Loss: Below the recent swing low or the 50 EMA for a more conservative trade.
  • Profit Target: Recent swing high.
PROS: Strong confluence with support levels, better risk management with tighter stop-losses.
CONS: Requires patience for confirmation, may miss opportunities in fast-moving markets.

Method Two: Buy During a Pullback with EMA

For this method, traders wait for the price to pull back to a key EMA (e.g., 20 or 50 EMA) and look for the formation of an inverted hammer as a bullish signal. For this method to work, price must be ABOVE the EMA – this approach combines the support provided by the EMA with the bullish reversal implications of the pattern. 

On August 23, 2024, the 4-hour Bitcoin chart showed an inverted hammer forming at the 20 EMA, which had recently flipped into support. 

After a bullish confirmation candle followed, traders could enter the market, set a stop-loss just below the inverted hammer’s low, and target the most recent swing high for a 1:4 risk-to-reward ratio trade. 

Trading Strategy Summary:

  • Entry Point: Enter after a bullish confirmation candle following the inverted hammer.
  • Stop-Loss: Below the inverted hammer’s low.
  • Profit Target: Recent swing high.
PROS: High-probability setups when combined with EMA support, effective in trending markets.
CONS: Relies on EMA support, which may not always hold in choppy markets.

Method Three: Inverted Hammer with Bullish RSI Divergence

Combining the inverted hammer pattern with RSI divergence can strengthen the reversal signal.

RSI divergence occurs when the price makes a new low, but the RSI fails to do the same, indicating weakening bearish momentum. 

On October 12, 2022, the SP500 daily chart featured bullish RSI divergence along with an inverted hammer at the bottom of a downtrend. 

This combination was confirmed by a subsequent bullish engulfing candle, providing a confirmation of a strong incoming bullish reversal. Here in our example, since the bullish engulfing candle was such an impulsive move, it’s likely that price would experience some sort of a retracement.

Notice how the retracement does not close under the closing price of the inverted hammer, which allows us to enter a comfortable trade with 1.27 reward-to-risk ratio.

Trading Strategy Summary:

  • Entry Point: Market enter after a confirmation candle has followed our inverted hammer, which in this case was our bullish engulfing candlestick. You can choose to wait for a retracement or directly enter.
  • Stop-Loss: Below the recent low.
  • Profit Target: Recent swing high.
PROS:  Provides additional confirmation through RSI, reducing false signals, reliable high-probability setups.
CONS: Requires understanding of RSI analysis, setups can be less frequent.

Advantages and Disadvantages of Trading the Inverted Hammer Pattern

The inverted hammer candlestick pattern is a valuable tool for traders, especially when identifying potential bullish reversals. However, like any trading pattern, it has its strengths and limitations. Here’s a breakdown of what makes this pattern useful – and where it can fall short.

Advantages:

  • High Probability Reversal Signal: When it appears in the right context, such as near a key support level after a prolonged downtrend, the inverted hammer can serve as a reliable signal for a potential bullish reversal.
  • Versatility Across Timeframes: The inverted hammer pattern works well on various timeframes, from intraday charts to weekly and monthly charts, making it accessible for both short-term and long-term traders.
  • Clear Visual Pattern: With its unique shape—a small body with a long upper shadow and little to no lower wick—the inverted hammer is easy for traders to spot on the charts, even for beginners.

Disadvantages:

  • Prone to False Signals in Choppy Markets: In markets that lack a clear trend, the inverted hammer can produce misleading signals, leading to potential losses if not confirmed by other indicators.
  • Requires Additional Confirmation: While it can indicate a potential reversal, the inverted hammer pattern often needs confirmation from other indicators, such as volume, RSI divergence, or EMAs, to improve accuracy and avoid premature entries.

Closing Thoughts and Key Notes

The inverted hammer candlestick pattern is a powerful tool for identifying potential bullish reversals, especially when it appears after a sustained downtrend or at a key support level. Its unique shape—a small body with a long upper shadow – signals that buyers are attempting to push prices higher, hinting at a possible shift in market sentiment.

While the inverted hammer is an effective pattern, it’s most reliable when combined with additional indicators, like RSI, moving averages, or support levels, to confirm the trend reversal. Practising good risk management, such as setting appropriate stop-loss levels, will further enhance the effectiveness of this pattern. Take advantage of our Max Lot Size Calculator today to improve your risk management.

Get Funded with FXIFY Today

At FXIFY™, we believe in empowering traders with the capital and resources they need to succeed. With our variety of evaluation phases and funding levels, you have the opportunity to access up to $400K in starting capital. Our performance splits go up to 90%, and we offer flexible add-ons to support your trading journey.

Join FXIFY™ today and put your trading knowledge to work with a funded account. Start with a challenge, prove your skills, and get instant access to your gains on demand—no delays, no hidden terms. 

Trade smart. Trade with FXIFY.

Purchase a challenge today!

FAQs

What is the Difference Between an Inverted Hammer and a Shooting Star?

The inverted hammer is a bullish reversal pattern that appears after a downtrend, while the shooting star is a bearish reversal pattern that appears after an uptrend. Both patterns have similar shapes but serve opposite functions based on their position within the trend.

Can the Inverted Hammer Pattern be Used on All Timeframes?

Yes, the inverted hammer pattern can be used across various timeframes, but it’s generally more reliable on higher timeframes like daily or weekly charts. Lower timeframes may produce more false signals due to market noise.

How Do I Confirm an Inverted Hammer Pattern?

Look for additional confirmation from other indicators or technical analysis tools. For example, a nearby support level, volume increase, or bullish indicators like RSI divergence can help confirm the pattern and improve its reliability.

Is the Inverted Hammer Pattern Reliable on Its Own?

While it can provide a strong reversal signal, the inverted hammer is best used with other forms of technical analysis to improve accuracy. Confirmation from indicators like moving averages, volume, or support levels can strengthen the signal and reduce the likelihood of false entries.

What Are Common Mistakes When Trading the Inverted Hammer Pattern?

Common mistakes include trading the pattern in isolation without confirmation, ignoring market context, and using it in choppy or range-bound markets where false signals are more likely. To enhance accuracy, always look for confluence with other indicators and set appropriate stop-loss levels.