

ATR Indicator Risk Management: What Average True Range Tells a Funded Trader
You enter a trade, set a stop where it feels safe, and watch price hit that stop minutes before turning back in your favor. This…
You enter a trade, set a stop where it feels safe, and watch price hit that stop minutes before turning back in your favor. This has probably happened to you more than once. It usually comes down to one thing: a stop placed without checking how far the market actually moves. ATR indicator risk management fixes that by turning stop distance into a calculation instead of a guess.
Key ATR and Risk Management Terms
| Term | Definition |
| Average True Range (ATR) | A smoothed average of true range values, most often calculated over 14 periods. It measures how far a market typically moves, not which direction it will move next. |
| True Range | The largest of three values: the current high minus the current low, the current high minus the previous close, and the current low minus the previous close. This accounts for gaps that a simple high-low range would miss. |
| Volatility | How much and how quickly a market’s price moves over a given period. Higher volatility means larger price swings in either direction. |
| Stop Loss | A set price level at which a losing trade is closed automatically to limit the loss on that trade. |
| Position Size | The number of units, lots, or contracts traded in a single position. Position size, combined with stop distance, determines the dollar amount at risk on a trade. |
| Daily Loss Limit | A fixed threshold on a funded account. If daily losses reach it, the account breaches the rule. It resets each day against the prior day’s closing balance and is checked against real-time equity. The exact figure differs by program. |
| Maximum Drawdown | The largest allowed loss from either the starting balance or the highest closed balance, depending on the program. It can be static or trailing. Static drawdown is measured from the starting balance and does not move. Trailing drawdown tracks the highest closed balance and adjusts at server rollover. |
What Is Average True Range (ATR)?
ATR shows how far a market typically moves over a set period. It does not predict direction. It tells you the size of the moves you should expect, so a stop or a target can be built around real market behaviour instead of a round number that feels right.
A 20-pip stop feels safe until you check that the pair has been moving 50 pips a day. At that point, the stop was never protecting the trade. It was just closing it early every time.
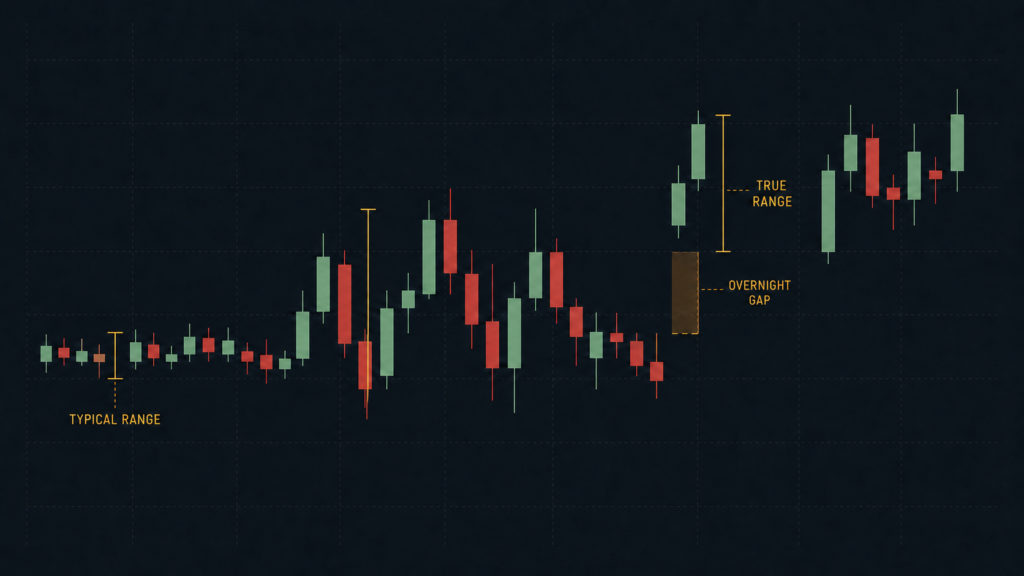
ATR uses true range rather than a simple high-low range, which matters more than it sounds. True range also checks the gap from the previous close, so an overnight jump gets counted instead of ignored. A calculation that misses gaps can understate risk on markets that gap.
How Is ATR Calculated?
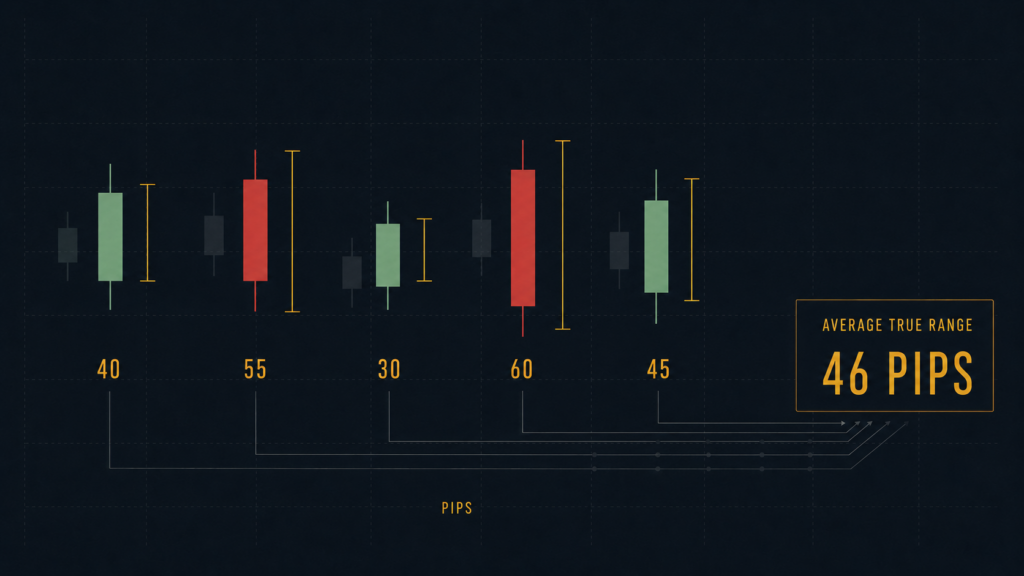
ATR is a smoothed average of true range values, most often over 14 periods. Each new true range value is blended in, with older values gradually carrying less weight, so a single wild day does not distort the whole reading.
As a plain illustration only, if a market moved 40, 55, 30, 60, and 45 pips on five separate days, the average true range across that stretch sits around 46 pips. That single number now tells you what a normal day looks like on that market, before you place a single trade.
How to Set an ATR-Based Stop Loss
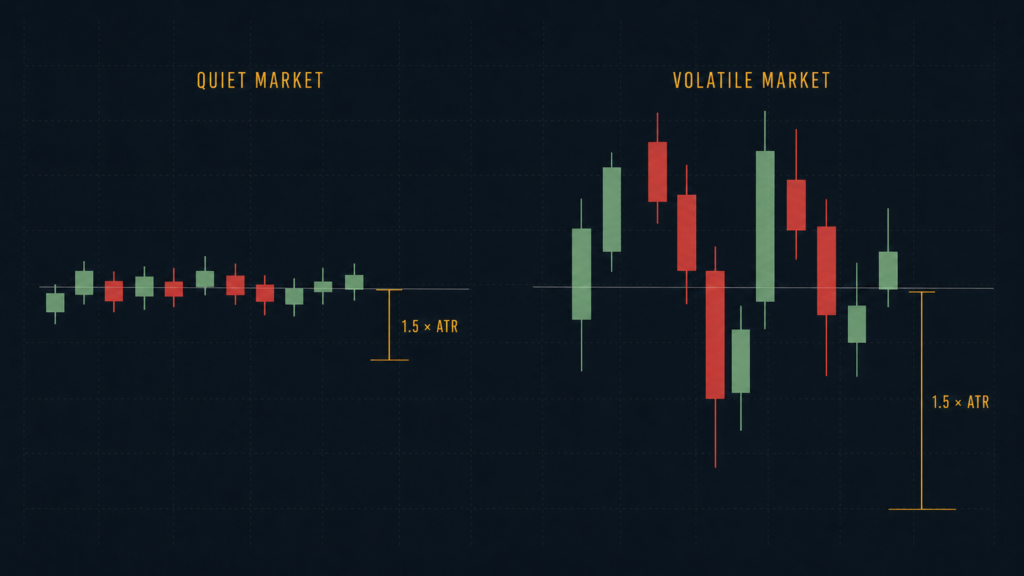
Instead of picking a stop distance because it looks tidy, many traders set it as a multiple of ATR, for example, 1.5 times ATR. Now the stop is proportional to what the market is doing right now, not what it was doing last month.
A quiet market gets a tighter stop. A volatile market gets a wider stop. The trade gets room to breathe when it needs it, and gets pulled in tight when it does not. This one change removes much of the guesswork that makes stop placement feel like gambling.
How to Size a Position Using ATR
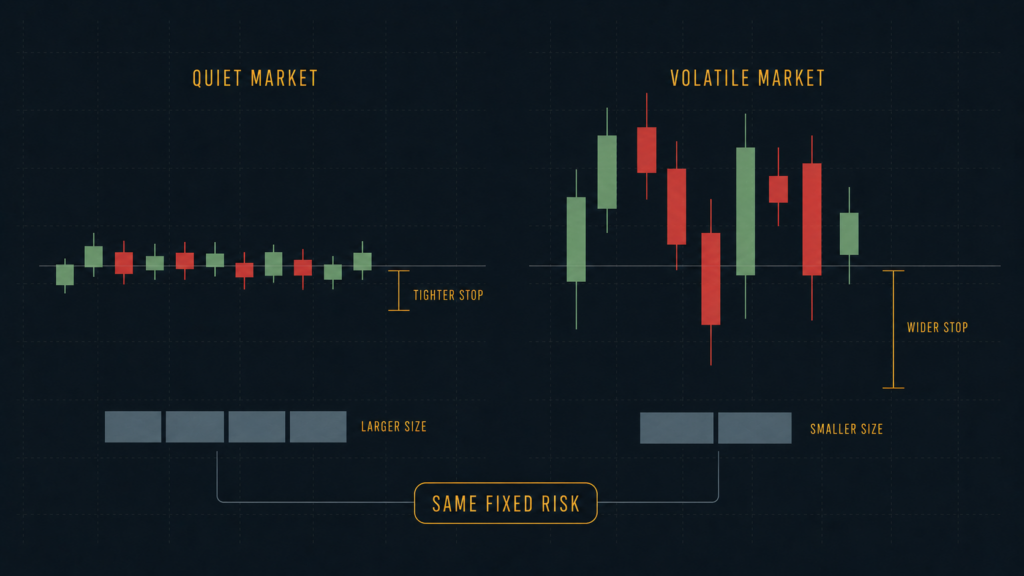
A good stop means nothing if the position size behind it is still a guess. Once the ATR-based stop distance is set, you can calculate position size so a stop-out always costs the same, chosen amount of risk.
The steps are simple. Decide how much of the account you’re willing to risk on the trade. Measure the stop distance in price terms, based on the ATR multiple used. Divide the risk amount by the stop distance to get the position size.
Do this consistently, and something shifts. Every trade risks the same amount, whether it is a slow-moving pair or a fast one. No more accidentally risking three times as much on a volatile day just because the position size was copied from yesterday’s calm trade.
ATR Indicator Risk Management on a Funded Account
Funded accounts, including FXIFY accounts, run on a daily loss limit and a maximum drawdown limit. The exact figures and drawdown type differ by program, and full details for each program are available at fxify.com/programs.
One oversized position in a volatile market can give back days of progress in a single trade. Sizing against ATR is one of the more direct ways to stop that single trade from doing that much damage.
This will not remove risk from trading. It removes the risk of sizing a trade the same way regardless of what the market is actually doing that day.
Common ATR Mistakes to Avoid
ATR tells you how far a market moves, not where it is going next. Using it as an entry or exit signal on its own is asking it to do a job it was not built for.
Volatility changes over time. A multiplier that fit a market last month may already be wrong today. Checking ATR once and never again defeats the purpose.
ATR is also not a price level. It is a distance. Treating it as a support or resistance line, or as a profit target, gives it a meaning it does not have.
Making ATR More Reliable in Practice
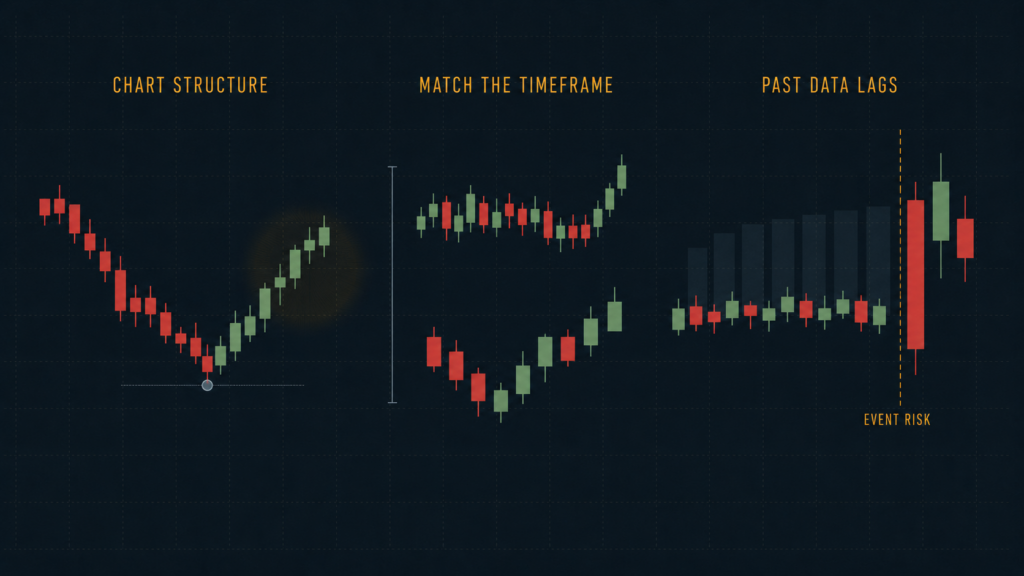
Three refinements help ATR-based sizing hold up better in live market conditions.
Combining ATR with a chart’s structure can work better than using ATR distance alone. Placing a stop just beyond a recent swing high or swing low ties it to the chart. Adding a small ATR buffer beyond that level can help absorb short-term noise.
The ATR period should match the timeframe you trade. A 14-period ATR on a 5-minute chart measures short-term noise. The same 14-period ATR on a daily chart measures the market’s broader swings. Use the timeframe that matches how long you plan to hold the trade.
ATR is also a lagging measure. It is built from past price data, so it does not update instantly when a sudden, high-impact move hits the market. Treat scheduled economic data releases as a separate risk factor, not something ATR already covers.
Frequently Asked Questions
What does the ATR indicator actually measure?
ATR measures how far a market has been moving, on average, over a set number of periods. It does not indicate which direction price will move next.
What is the most common ATR setting?
A 14-period ATR is a standard default on charting platforms. Shorter periods react faster to recent volatility. Longer periods smooth the reading and react more slowly.
Can ATR predict where price will go?
No. ATR is a volatility measure, not a directional signal. Use it alongside a trading strategy, not as a standalone entry or exit signal.
How do traders use ATR for stop losses?
Many traders set a stop loss as a multiple of ATR, such as 1.5 or 2 times ATR, so the stop distance adjusts automatically to current market volatility instead of staying fixed.
How does ATR help with position sizing?
Once a stop distance is set using ATR, you can calculate position size so a stop-out always risks the same, chosen amount of the account, regardless of market volatility.
Does a higher ATR mean higher risk?
A higher ATR means the market is moving further per period. If you don’t adjust position size and stop distance for this, then yes, the trade carries more risk than the same setup in a lower-ATR market.
Is ATR useful for funded account risk management?
ATR-based sizing helps keep risk per trade consistent, which supports staying within a funded account’s daily loss limit and maximum drawdown limit. It does not remove the underlying risk of trading, and it does not guarantee an account will not breach its limits.