October kicks off the final quarter of 2025 with a significant shift in the macroeconomic landscape. The Federal Reserve has officially pivoted, delivering its first interest rate cut of the year in September and signalling more adjustments are likely. This has set the stage for a month where economic data will be intensely scrutinised for its influence on the Fed’s next steps.
Building on our analysis from last month’s forecast, October shifts from if to how fast—the Fed has cut; now the pace is data-driven.
While the Fed turns dovish, other central banks remain cautious. The European Central Bank is in a holding pattern, watching stable inflation, while the Bank of England remains vigilant. This policy divergence, coupled with sticky inflation in the US and slowing global growth, creates a complex environment for traders. Adding to the mix is the start of the Q3 earnings season, which will offer a crucial look at corporate health amid these shifting conditions.
October 2025 Economic Calendar
Taking a look at our FXIFY™ economic calendar, here are our top picks for economic news to look out for in October.
| Date | Asset | Events |
|---|---|---|
| Week One: Oct 1 – 5 | USD | Nonfarm Payrolls (Sept) |
| Week Two: Oct 6 – 12 | USD | FOMC Meeting Minutes |
| Week Three: Oct 13 – 19 | USD | US Retail Sales (Sept) |
| Week Four: Oct 20 – 26 | GBP | UK CPI (Sept) |
| CAD | Canada CPI (Sept) | |
| Week Five: Oct 27 – 31 | CAD | Bank of Canada Rate Decision |
| EUR | ECB Rate Decision | |
| USD | FOMC Rate Decision | |
| USD | US GDP (Q3 advance) & PCE Inflation |
October begins with the high-impact U.S. Nonfarm Payrolls report, a key indicator of labor market health. The month is bookended by major central bank decisions, with both the European Central Bank and the U.S. Federal Reserve holding policy meetings in the final week. In between, critical inflation data from the UK, Canada, and the Eurozone will keep traders on their toes.
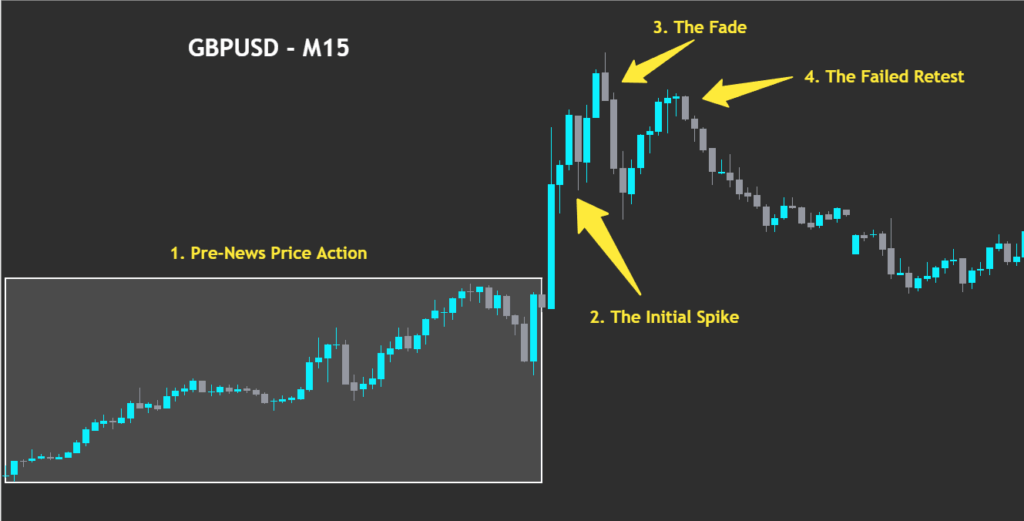
1. USD – Nonfarm Payrolls (Oct 3)
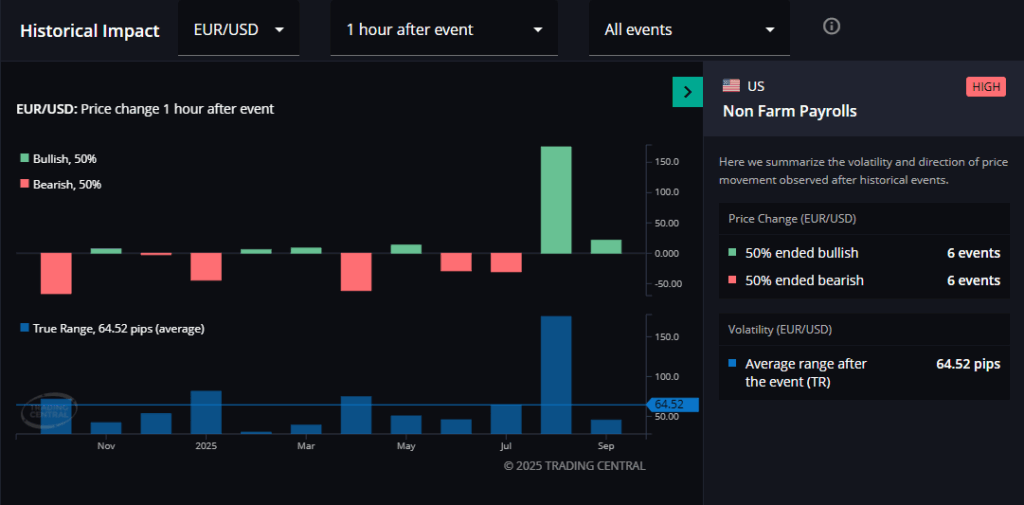
The monthly jobs report remains a primary driver of market volatility. After a recent slowdown in hiring, traders will be looking for confirmation of the labor market’s health to gauge the Fed’s next move. A weak report could reinforce bets on further Fed rate cuts, while a surprisingly strong number could renew concerns about sticky inflation.
According to the Trading Central Economic Calendar (available in your FXIFY dashboard), the average one-hour move in EUR/USD following recent NFP releases is 64.5, with volatility often high on both sides of the release.
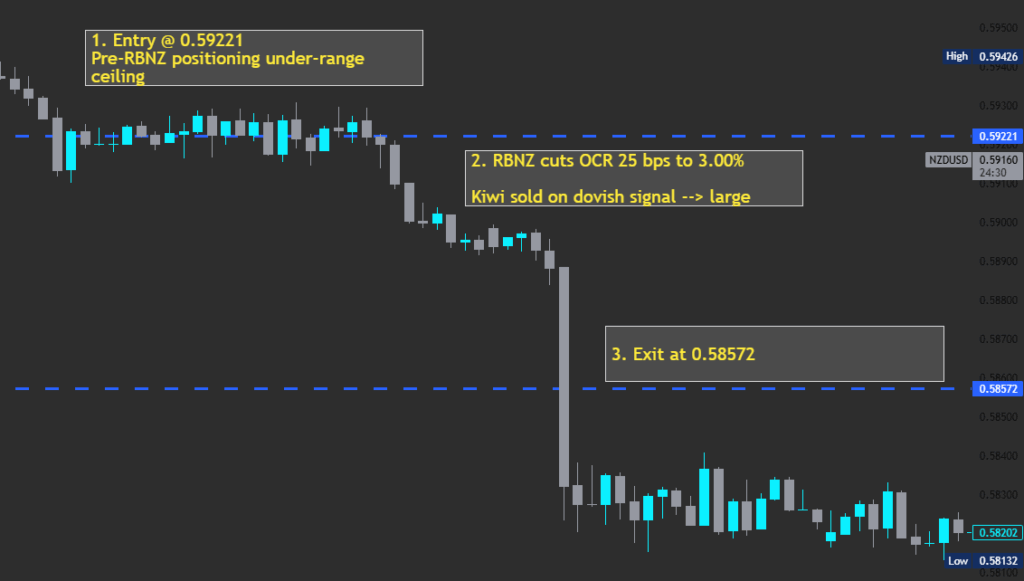
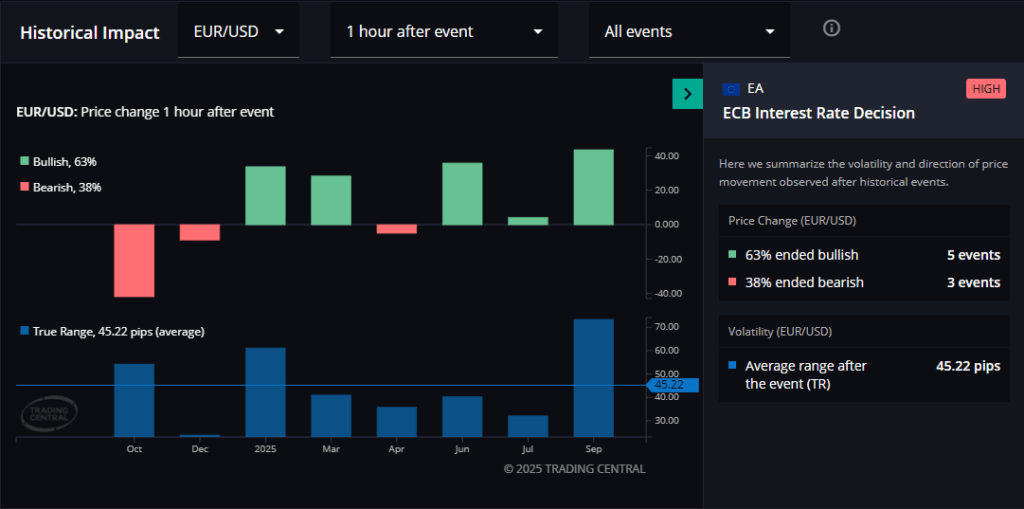
2. EUR – ECB Policy Meeting (Oct 30)
The European Central Bank left rates unchanged in September, noting that inflation was hovering around its 2% target. The ECB is in a data-dependent, “meeting-by-meeting” stance, giving no strong hints about future hikes or cuts. Traders will closely watch President Lagarde’s press conference for any shift in tone, as a dovish lean could weigh on the EUR while a hawkish surprise would provide support.
According to Trading Central data, the average one-hour move in EUR/USD following recent ECB press conferences is 45.2 pips.
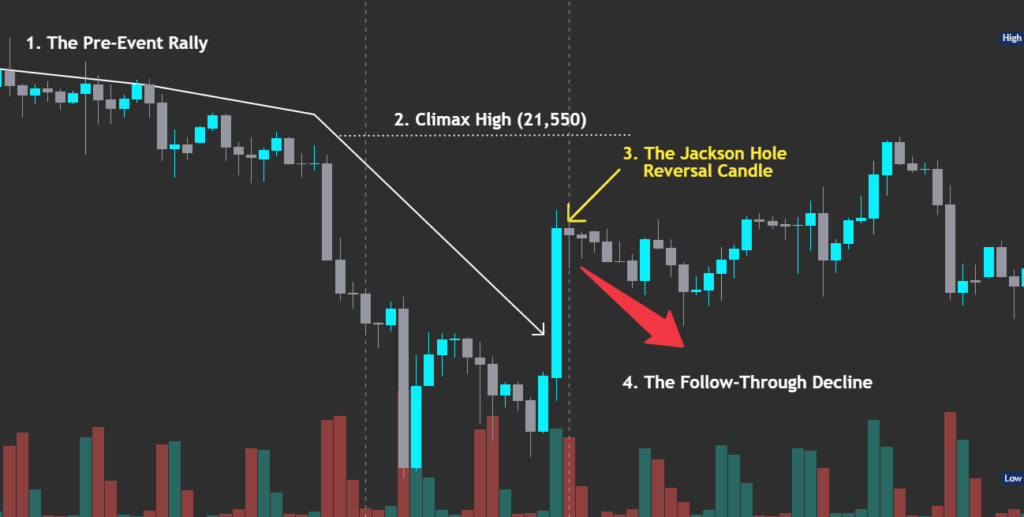
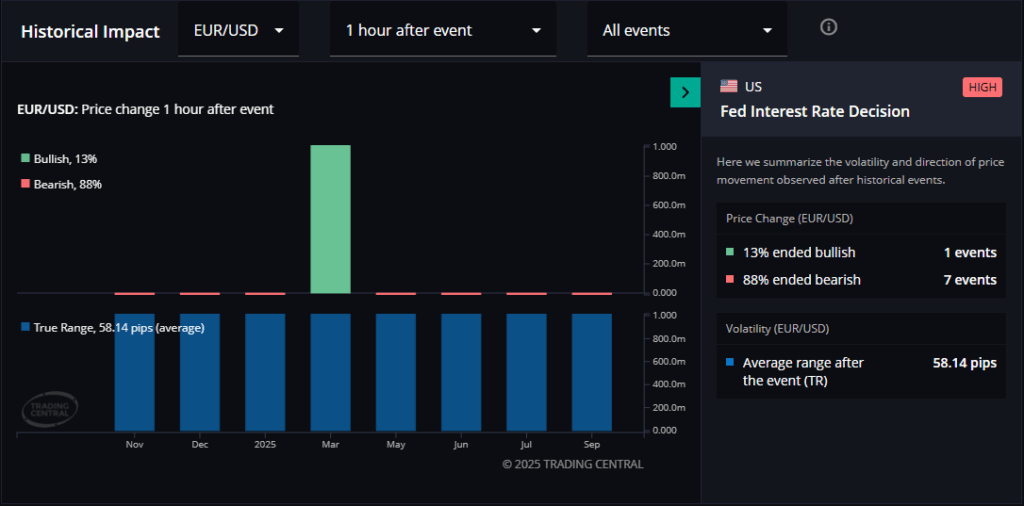
3. USD – FOMC Rate Decision (Oct 29)
This is the main event of the month.
After delivering its first 25 basis point rate cut in September, the market widely expects more easing from the Federal Reserve. Projections show most Fed officials see 1-2 more cuts by the end of the year. The focus will be on the policy statement and Fed Chair Powell’s language for clues on the pace of future cuts. Any surprise, like a hawkish pause, could cause significant market turmoil.
Trading Central data shows that EUR/USD has moved an average of 58.14 pips one hour after the FOMC rate decision.
October 2025 Earnings Calendar
October kicks off the Q3 earnings season, with a heavy focus on the flagship US banks and technology titans. Their results will provide a critical snapshot of corporate and consumer health.
📅 Earnings Calendar – October 2025
| Date | Company | Ticker | Sector |
|---|---|---|---|
| Oct 14 | JPMorgan Chase & Co. | JPM | Financials |
| Oct 14 | Goldman Sachs | GS | Financials |
| Oct 15 | Bank of America | BAC | Financials |
| Oct 22 (est.) | Tesla | TSLA | Consumer Discretionary |
| Oct 29 (est.) | Meta Platforms | META | Communication Services |
| Oct 30 (est.) | Apple Inc. | AAPL | Information Technology |
| Oct 30 (est.) | Amazon.com Inc. | AMZN | Consumer Discretionary |
Key Story: US Dollar Index (DXY) & Gold
This month’s key story focuses on two assets at the heart of the current macro narrative: the US Dollar, which is reacting to a newly dovish Fed, and Gold, which has been hitting new all-time highs.
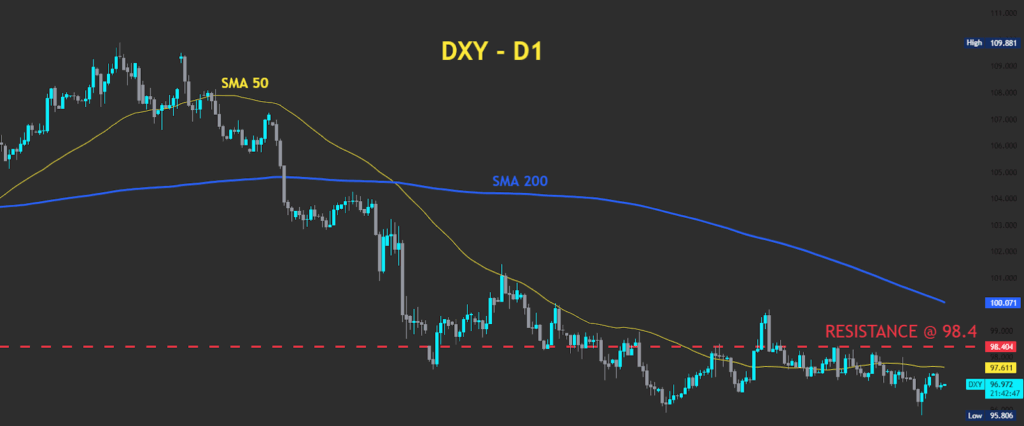
US Dollar Index (DXY)
The DXY is in a clear short-term downtrend, reflecting the Fed’s shift to an easing policy. The index is trading below both its 50-day and 200-day moving averages, confirming a bearish bias. Key resistance is located in the 98.0-99.0 zone. A break below 97.0 could signal a deeper slide for the dollar.
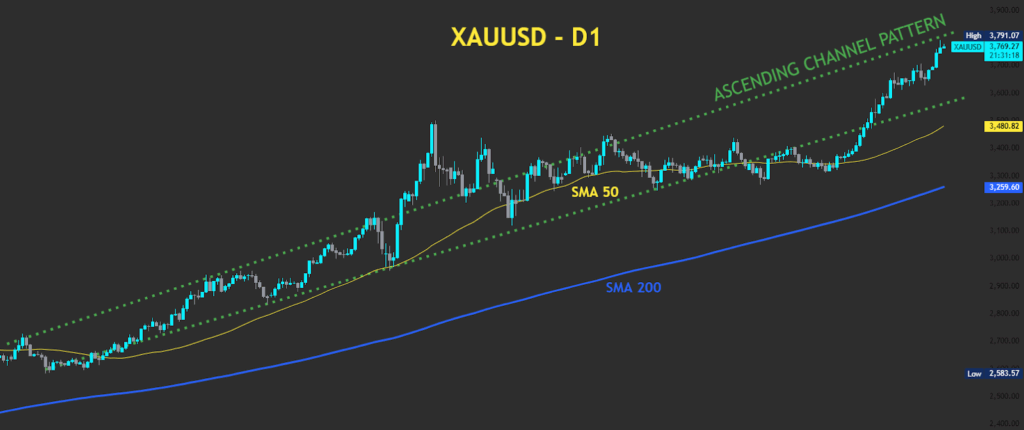
Gold (XAU/USD)
In sharp contrast, Gold is in a strong bull trend, having recently pushed to new all-time highs near $3,791 per ounce.
The price action is defined by an ascending channel pattern, with higher highs and higher lows. Gold remains well above its 50-day and 200-day moving averages, confirming the long-term uptrend. Key support is the lower boundary of the channel, currently trending in the $3,550-$3,600 area. As long as this channel holds, the trend favors a continuation toward and beyond the recent high of $3,791.”
Wrapping Up October’s Outlook
October is set to be a pivotal month. The Federal Reserve’s new easing stance has put a spotlight on incoming data, making the NFP and PCE inflation reports crucial market drivers. With the DXY showing technical weakness and Gold demonstrating strong bullish momentum, the stage is set for a volatile Q4 kick-off.
Whether you’re trading indices, FX, crypto, or commodities, staying updated on the evolving narrative will be key to staying prepared. As always, approach high-impact weeks with a plan. With your FXIFY account, be sure to track these key events using the Economic Calendar. Trading Central’s Featured Ideas and Technical Views can support trade planning and identify setups around news catalysts.