

5 Must-Know Candlestick Patterns for Trading
Candlestick patterns are one of the most widely used tools in technical analysis. This article covers five candlestick patterns for trading that every serious trader…

Candlestick patterns are one of the most widely used tools in technical analysis. This article covers five candlestick patterns for trading that every serious trader should understand. Each pattern is defined by its structure, its signal, and the market conditions where it forms. No theory without application. No claims without context.
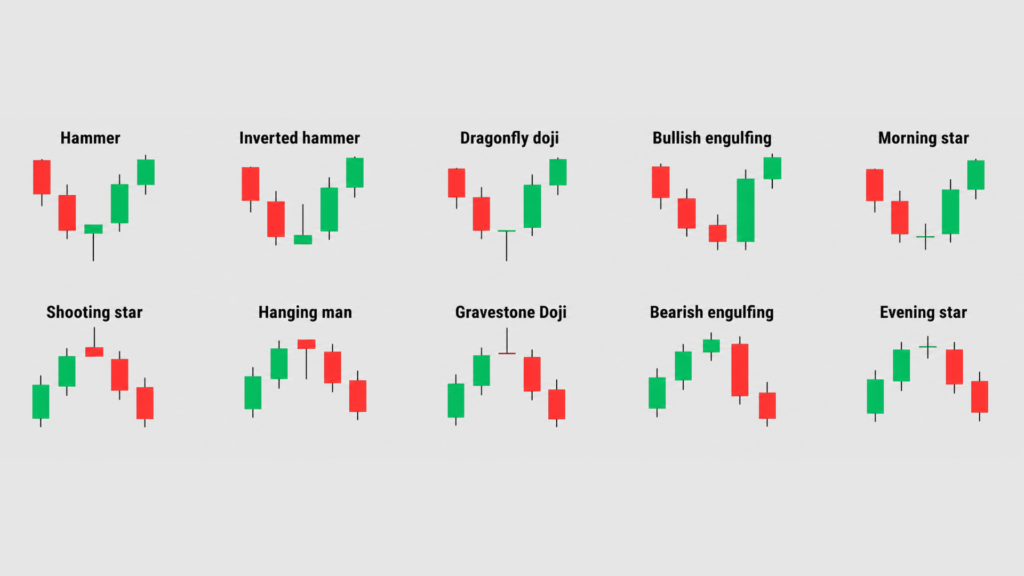
Quick Summary Table
| Pattern | Type | What It Signals | Where It Appears |
| Pin Bar | Bullish / Bearish | Rejection of price level; potential reversal | Support or resistance zones |
| Engulfing Pattern | Bullish / Bearish | Strong momentum shift; prior candle absorbed | End of trending moves |
| Doji | Neutral | Indecision; balance between buyers and sellers | Mid-trend or near key levels |
| Hammer | Bullish | Buyers stepped in after a sell-off | Bottom of a downtrend |
| Shooting Star | Bearish | Sellers rejected a rally | Top of an uptrend |
What Are Candlestick Patterns?
A candlestick represents price movement over a defined time period. Each candle has four data points: open, close, high, and low.
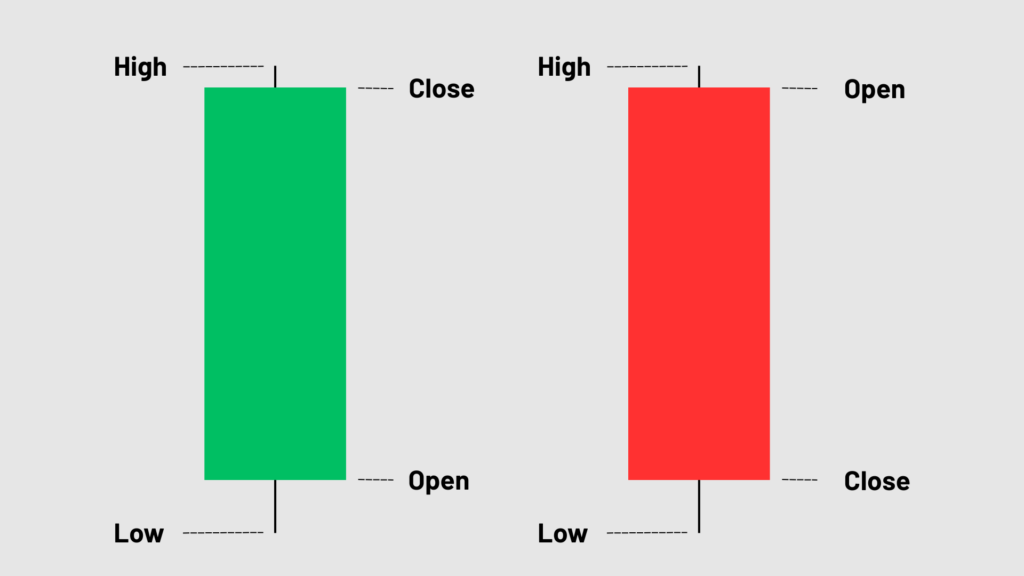
The body is the range between the open and closed. The wicks (also called shadows) show the high and low extremes reached during that period. A bullish candle closes above its open. A bearish candle closes below its open.
Candlestick patterns are specific formations — single candles or combinations — that repeat across markets and timeframes. Traders use them to assess price behavior and anticipate directional moves.
Why Candlestick Patterns Matter in Trading
Correctly explained candlestick patterns are not signals in isolation. They are visual representations of supply and demand at a specific price level.
A pattern forms when buyers or sellers dominate a period in a specific way. That dominance leaves a structural footprint on the chart.
Traders use patterns to:
- Time entries with more precision than price alone
- Confirm signals generated by other tools, such as moving averages and structure levels
- Manage risk by identifying logical stop loss placement points
Understanding candlestick trading strategies means understanding context first, pattern second.
5 Must-Know Candlestick Patterns
1. The Pin Bar — A Key Bullish and Bearish Candlestick Pattern
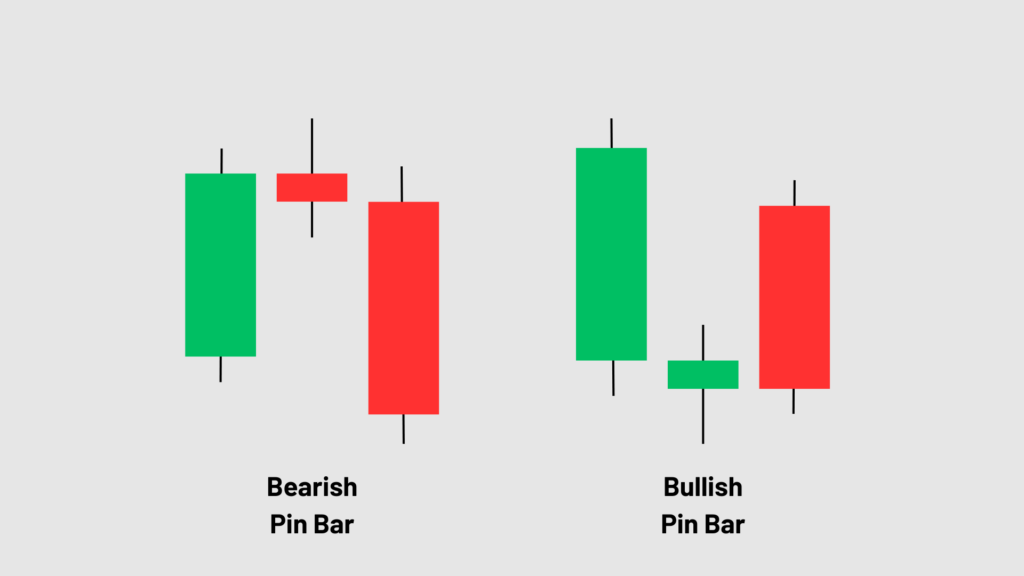
What it is:
A single candle with a long wick and a small body. The wick extends significantly beyond the body in one direction.
What it signals:
One side of the market tried to push price higher or lower but failed. The rejection suggests momentum may be shifting in the opposite direction.
Where it forms:
Most reliable at key support and resistance levels, supply and demand zones, or important swing highs and lows.
Key characteristics:
- Small body.
- One long rejection wick.
- Very small or no wick on the opposite side.
- The longer the rejection wick, the stronger the signal.
What validates it:
- Forms at an important price level.
- Aligns with the overall trend or market structure.
- The next candle confirms the rejection by moving in the expected direction.
How traders use it:
- Traders wait for the Pin Bar candle to fully close first.
- They look for the next candle to confirm rejection by moving in the opposite direction of the wick.
- A bullish Pin Bar is confirmed when the next candle breaks above the Pin Bar high or closes bullish.
- A bearish Pin Bar is confirmed when the next candle breaks below the Pin Bar low or closes bearish.
- Stop loss is usually placed beyond the tip of the long wick.
- Targets are usually the next support/resistance level or a fixed risk-to-reward target.
- Stronger setups form at key levels and align with the higher timeframe trend or structure.
2. The Engulfing Pattern — A High Probability Bullish and Bearish Signal
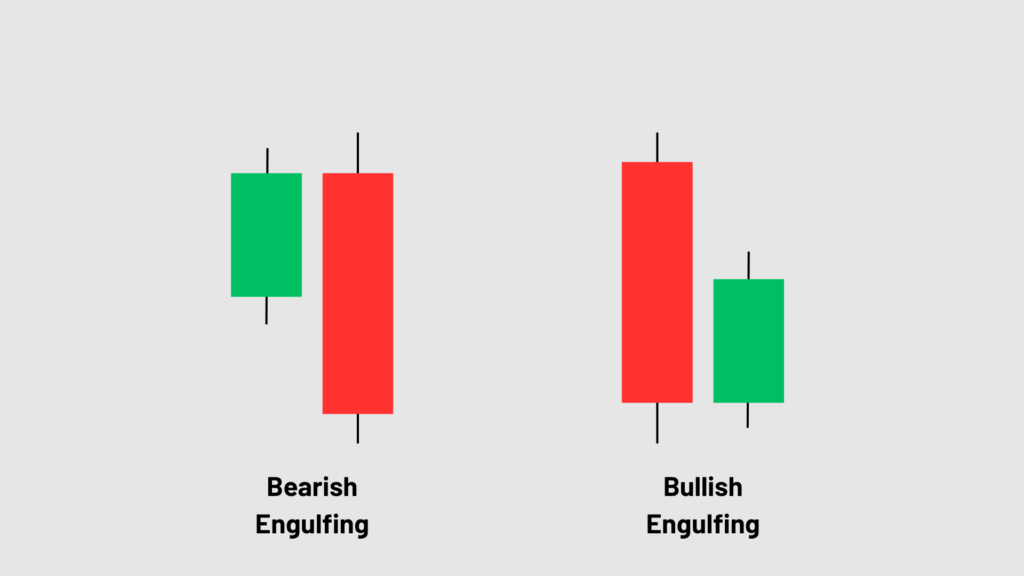
What it is:
A two-candle reversal pattern where the second candle completely engulfs the body of the first candle. It shows that momentum has shifted sharply in the opposite direction.
What it signals:
A strong shift in buying or selling pressure. A bullish engulfing suggests buyers have taken control after a decline, while a bearish engulfing suggests sellers have taken control after an advance.
Where it forms:
Most reliable at key support and resistance levels, supply and demand zones, swing highs and lows, or after a trend pullback. It carries more weight when it appears after a sustained move.
Key characteristics:
- Consists of two candles.
- The second candle’s body completely engulfs the first candle’s body (open to close).
- The second candle closes strongly in the direction of the reversal.
- A larger engulfing candle generally indicates stronger momentum.
What validates it:
- Forms at an important technical level.
- Aligns with the higher timeframe trend or market structure.
- The engulfing candle closes near its high (bullish) or low (bearish), showing strong conviction.
- The following candle continues in the direction of the engulfing candle, confirming the reversal.
How traders use it:
- Wait for the engulfing candle to fully close before considering a trade.
- Enter when the next candle breaks above the engulfing candle’s high (bullish) or below its low (bearish), or after a confirming close in the same direction.
- Place the stop loss below the low of the bullish engulfing pattern or above the high of the bearish engulfing pattern.
- Target the next key support/resistance level or use a predefined risk-to-reward ratio.
- Combine the pattern with trend, market structure, and key levels rather than trading it in isolation.
3. The Doji — Candlestick Patterns Explained Through Indecision
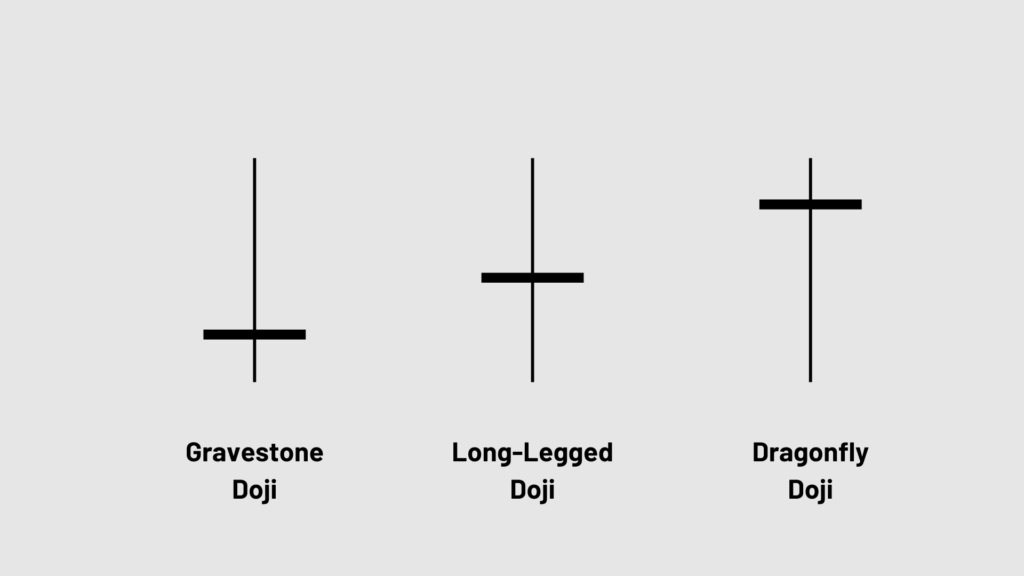
What it is: A candle where the open and close are nearly identical. The body is minimal or nonexistent.
What it signals: Indecision. Neither buyers nor sellers controlled the session. The market is at equilibrium at that price level.
Where it forms: Mid trend or near key support and resistance zones.
How traders use it:
- A Doji alone is not an actionable signal
- Traders wait for the following candle to confirm direction
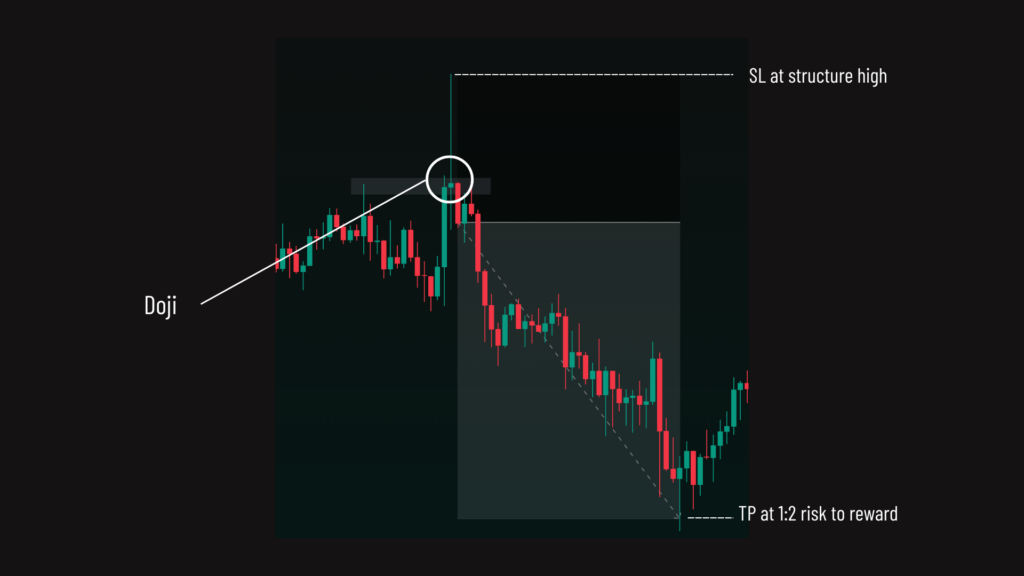
- A Doji at a high after a strong rally signals a possible stall or reversal — not a confirmed trade
- A Gravestone Doji (long upper wick, no lower wick) leans bearish. A Dragonfly Doji (long lower wick, no upper wick) leans bullish.
4. The Hammer — A Classic Bullish Candlestick Pattern
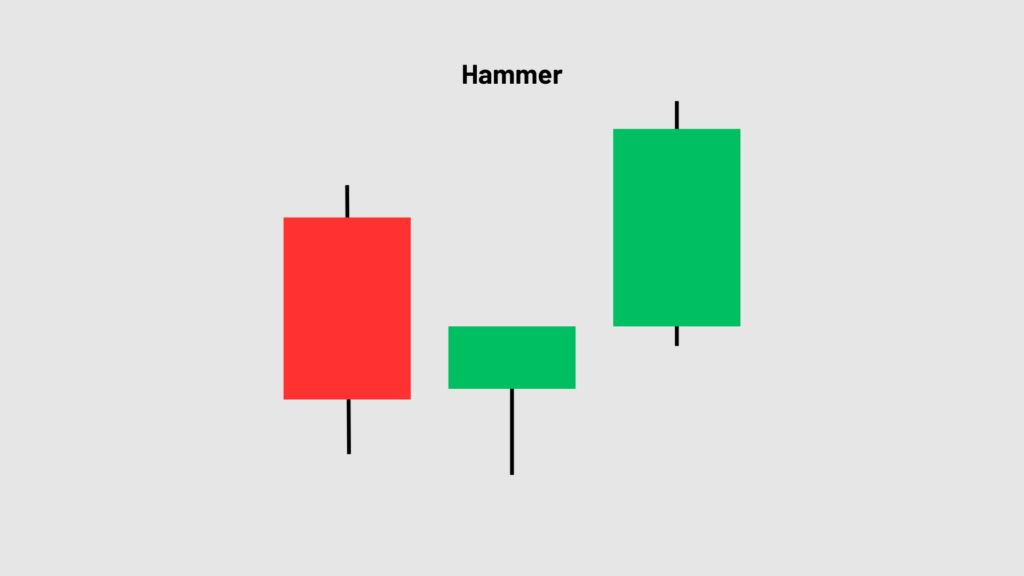
What it is: A single candle with a small body near the top and a long lower wick. The lower wick should be at least twice the length of the body.
What it signals: Sellers drove price down sharply during the session, but buyers absorbed that pressure and pushed price back up near the open. Buyers had the final say.
Where it forms: At the bottom of a downtrend or at established support levels.
How traders use it:
- Most valid when the wick tests a defined support zone or prior swing low
- Entry is taken after a confirmation candle closes bullish, following the Hammer
- Stop loss is placed below the low of the Hammer wick
5. The Shooting Star — A Bearish Candlestick Pattern at Market Tops
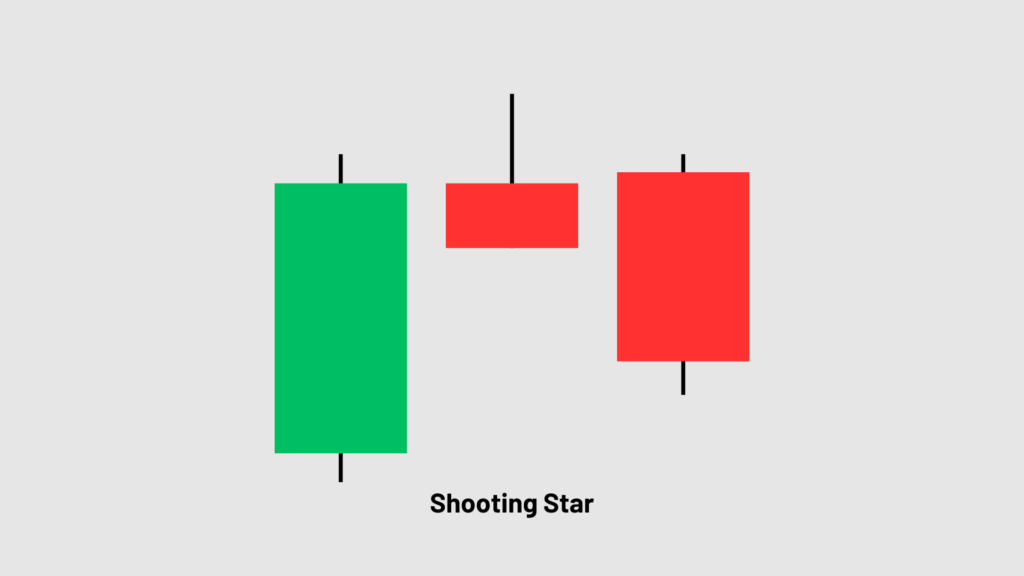
What it is: A single candle with a small body near the bottom and a long upper wick. It is the structural inverse of the Hammer.
What it signals: Buyers pushed price significantly higher during the session, but sellers stepped in and drove price back down near the open. Sellers won the session.
Where it forms: At the top of an uptrend or at established resistance zones.
How traders use it:
- Valid when the wick extends into a known resistance area or prior swing high
- Entry is taken after a bearish confirmation candle
- Stop loss is placed above the high of the upper wick
- The signal weakens significantly if it forms away from a meaningful price level
Common Mistakes When Using Candlestick Patterns
Trading patterns without context. A Hammer in the middle of a range has no edge. A Hammer at a 4-hour support level, tested twice, has context.
Skipping the confirmation candle. An entry on the pattern candle itself increases the risk of false signals. The confirmation candle removes ambiguity.
Ignoring the timeframe hierarchy. A bearish Shooting Star on the 1-minute chart means little if the 4-hour chart shows a strong uptrend. Higher-frequency bias overrides lower-frequency patterns.
Using patterns as the only filter. Candlestick patterns are not standalone systems. They work best when combined with:
- Structure levels (support and resistance)
- Trend direction
- Volume confirmation where available
Moving the stop loss to avoid being stopped out. If the pattern is valid, the stop loss position is logical. Removing or widening the stop compromises the trade’s risk structure.
How This Applies to Prop Trading
In a prop trading context, pattern recognition alone is not enough. Execution discipline determines whether a valid pattern produces a viable trade.
Every pattern-based entry must have:
- A defined stop loss is placed at the structural level, and the pattern suggests
- The risk-to-reward ratio is calculated before entry, not after
- Position sizing is calculated relative to starting capital and current account risk limits
Traders using evaluation programs — including FXIFY’s — are assessed on consistency and risk control, not on win rate alone. A trader who enters five clean, correctly structured pattern trades with proper stops demonstrates more process discipline than a trader who takes twenty entries without structure.
Drawdown rules in any evaluation program require precision. Candlestick patterns that provide defined entry and stop loss levels are one tool that supports that precision.
Key Takeaways
- Candlestick patterns reveal the balance of buying and selling pressure at a specific price and time.
- Context determines validity. Every pattern must be assessed against structure, trend, and timeframe
- Confirmation candles reduce false entries. Do not act on the pattern candle alone in most cases.
- Stop loss placement is structural. Each pattern has a logical invalidation point — respect. it
- Pin Bars, Engulfing patterns, and Hammers are reversal signals. They require directional context to carry weight.
- A Doji is an indecision signal, not a directional one. Always wait for follow-through.
- Combining candlestick patterns with support/resistance and trend analysis improves accuracy over patterns used in isolation
FAQ
What are the most reliable candlestick patterns for trading?
Reliability depends on context, not pattern type alone. The Pin Bar, Engulfing Pattern, and Hammer are among the most consistently studied. All three are most effective when formed at identifiable structure levels on higher timeframes.
How do I read candlestick charts as a beginner?
Start with the basics: each candle has an open, a close, a high, and a low. The body shows the session range between open and close. The wicks show the extremes. Learn to identify bullish candles (closing above the open) and bearish candles (closing below the open) before moving on to patterns.
What is the difference between bullish and bearish candlestick patterns?
Bullish candlestick patterns signal that buying pressure may be increasing — typically forming at support levels. Bearish candlestick patterns signal that selling pressure may be increasing — typically forming at resistance levels. Both require confirmation before acting.
Can candlestick patterns be used on any timeframe?
Yes. However, patterns on higher timeframes (4-hour, daily, weekly) carry more statistical weight than patterns on lower timeframes (1-minute, 5-minute). Lower timeframe patterns are subject to more noise.
What is the difference between a Hammer and a Shooting Star?
Both have small bodies and long single wicks. The Hammer has a long lower wick and forms at the bottom of a downtrend — a bullish signal. The Shooting Star has a long upper wick and forms at the top of an uptrend — a bearish signal. Structure is the same; direction and location are opposite.
Do candlestick patterns work in all markets?
Candlestick patterns are used across forex, indices, commodities, and equities. The underlying logic — price rejection, momentum shifts, indecision — applies wherever buyers and sellers interact. Liquidity conditions and session timing affect pattern quality.
How should prop traders use candlestick patterns within risk parameters?
Prop traders should use patterns to define precise entry points and logical stop loss levels. Every trade must be sized relative to available starting capital and the evaluation program’s maximum drawdown threshold. Patterns that do not offer a clearly defined point of invalidation should be avoided in evaluation contexts.