MACD Indicator Guide: How to Spot Trends and Divergences
The MACD, or Moving Average Convergence Divergence, is one of the most widely used indicators in trading. It compares two moving averages and shows you…
The MACD, or Moving Average Convergence Divergence, is one of the most widely used indicators in trading. It compares two moving averages and shows you where momentum is building, fading, and when a trend may be about to turn.
For funded prop traders, where timing and drawdown control matter, MACD can be the difference between a clean run and an avoidable loss. This guide breaks down how MACD works, the best settings for different styles, and how to trade trends and divergences.
Key Terms
| Term | What it means |
| MACD Line | The difference between the 12-period and 26-period exponential moving averages (EMAs) of closing prices |
| Signal Line | A 9-period EMA of the MACD Line |
| Histogram | The difference between the MACD Line and the Signal Line, drawn as bars |
| Crossover | When the MACD Line crosses above or below the Signal Line |
| Divergence | When price and the MACD move in opposite directions, hinting that momentum is fading or building |
What’s in This Guide
- What MACD is and how it works
- MACD settings: default vs custom
- How to trade trends with MACD
- How to trade MACD divergences
- Examples in real charts
- MACD in a prop trading account
- Common mistakes
- FAQs
What MACD Is and How It Works
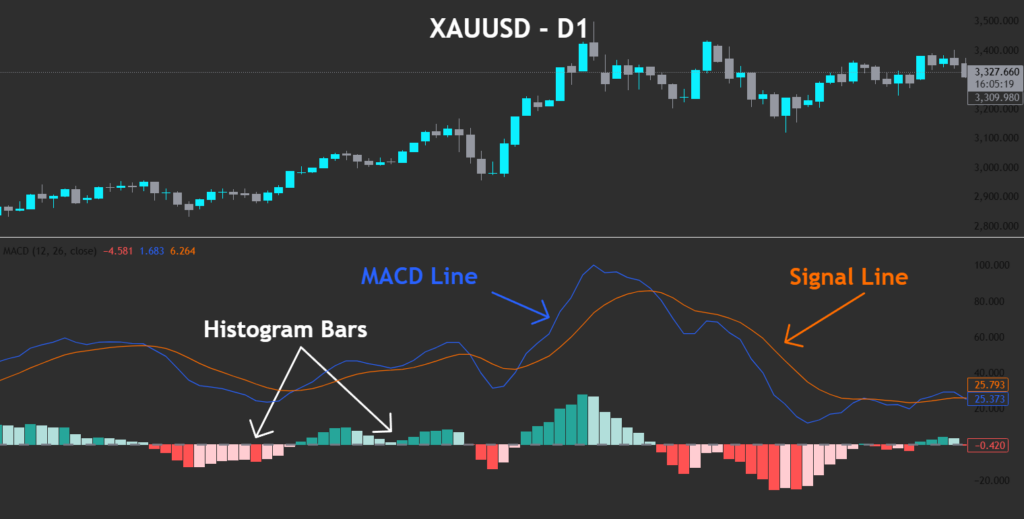
MACD has three parts:
- MACD Line. The 12-period EMA minus the 26-period EMA. It moves faster than the price trend itself.
- Signal Line. A 9-period EMA of the MACD Line. It moves more slowly and acts as a smoothing reference.
- Histogram. Bars that show the gap between the MACD Line and the Signal Line. The bars rise when upside momentum builds. They fall when downside momentum builds.
The MACD moves above and below a zero line. When it sits above zero, upside momentum is in control. When it sits below zero, downside momentum is in control.
Why MACD Matters for Traders
A single MACD chart shows you three things at once:
- Whether momentum lines up with the current trend
- How strong is that momentum right now
- Whether momentum is shifting before the price actually turns
For prop traders working inside drawdown limits, that combination is useful. Better timing means fewer losing trades. Fewer losing trades means more room to grow the account.
MACD Settings: Default vs Custom
Default Settings (12, 26, 9)
Most platforms come with 12-26-9 because:
- The 12 and 26 EMAs capture short and medium-term price cycles on the daily chart
- The 9-period EMA of the MACD Line smooths out noise without adding too much lag
- The combination balances responsiveness and reliability
When to Customise MACD
| Trading style | Suggested settings | Why |
| Scalping / fast day trades | 6-13-5 | Faster EMAs catch quick price moves |
| Intraday trend trading | 8-21-9 | Balances speed and noise on liquid markets |
| Swing or position trading | 24-52-9 | Filters out intraday swings, follows the bigger trend |
The right setting depends on your timeframe and the asset. Shorter settings work better for scalpers on tight pricing. Longer settings work better for swing traders on broader moves.
How to Trade Trends With MACD
Spotting Trend Direction
A bullish crossover happens when the MACD Line crosses above the Signal Line. It signals building upside momentum, especially if the cross happens below the zero line and pushes through it.
A bearish crossover happens when the MACD Line crosses below the Signal Line. The same logic in reverse.
Confirming Trends With the Histogram
Think of the histogram as a momentum gauge:
- Rising green bars above zero: upside momentum is building
- Deepening red bars below zero: downside momentum is building
- Flattening bars: momentum is fading, even if the price keeps moving
Entry and Exit Tactics
- Find a MACD crossover that lines up with the bigger trend on the higher timeframe
- Confirm with structure: higher highs for longs, lower lows for shorts
- Plan your invalidation level (where you would exit if wrong)
- Exit when the histogram shrinks sharply, or when an opposite crossover forms
How to Trade MACD Divergences
What Divergence Means
Divergence happens when the price moves one way, but the MACD moves the other way. It tells you the move you are watching is not as strong as it looks.
There are two main types:
- Regular Divergence. Signals a possible trend reversal
- Hidden Divergence. Signals a likely trend continuation
Divergence can appear either in the MACD histogram (earlier but less reliable) or in the MACD Line itself (slightly later but more reliable).
The Four Divergence Types
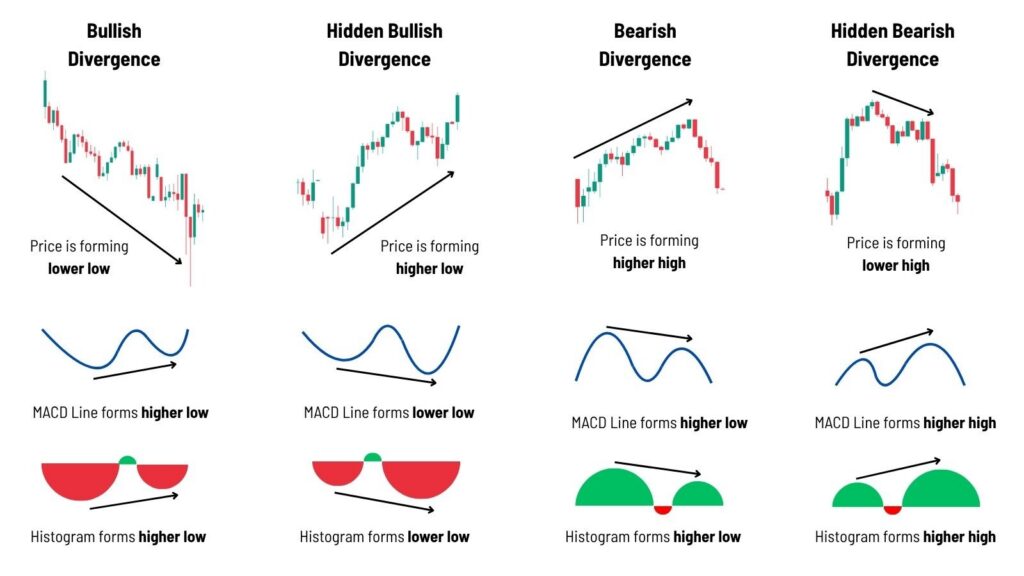
Regular Bullish Divergence
- Price makes lower lows
- MACD does not make a lower low
- Downside momentum is fading. Watch for a bullish reversal.
Regular Bearish Divergence
- Price makes higher highs
- MACD does not make a higher high
- Upside momentum is fading. Watch for a bearish reversal.
Hidden Bullish Divergence
- Price makes higher lows
- MACD makes a lower low
- The uptrend may continue. Watch for a bullish continuation setup.
Hidden Bearish Divergence
- Price makes lower highs
- MACD makes a higher high
- The downtrend may continue. Watch for a bearish continuation setup.
How to Trade a Divergence
| Source | Signal timing | Reliability | Best use |
| Histogram | Early | Less reliable | Initial heads-up. Needs confirmation. |
| MACD Line | Slightly delayed | More reliable | Best used with structure breaks or candle patterns. |
| Signal Line | Not used | Not applicable | Not used for divergence. |
You do not need MACD to print perfect highs or lows as the price does. Divergence occurs when MACD fails to follow price action.
Step-by-step Setup
- Spot the divergence. Price prints a new high or low. MACD does not.
- Zoom out. Check if you are late in a trend or near a key support or resistance level.
- Wait for confirmation. A bullish engulfing candle, a pin bar, or a trendline break works well.
- Enter the confirmation code. Above the close for longs. Below for shorts.
- Place your invalidation level beyond the recent swing point.
- Exit when: the histogram crosses back through the zero line, or a new opposite divergence forms.
Divergence setups work best on the H4 and D1 timeframes, where there is less noise.
Quick MACD Examples
Example 1: Bearish Continuation on USDJPY (D1)
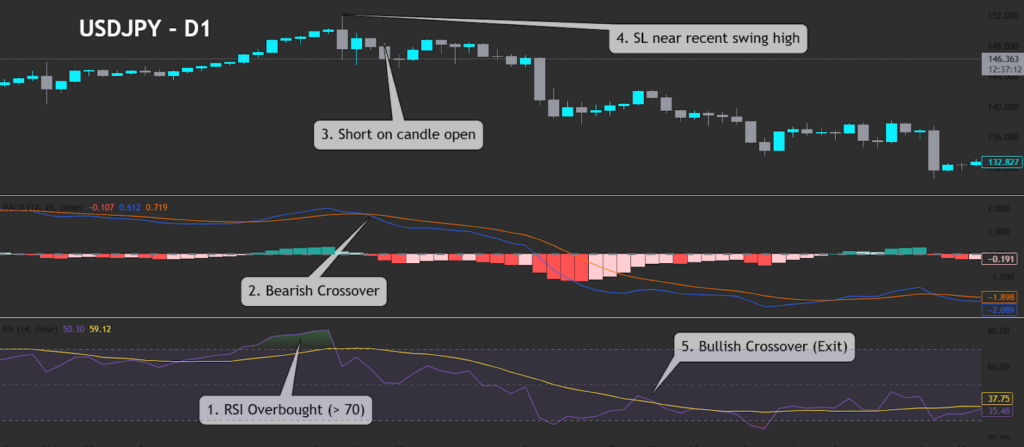
USDJPY on the daily timeframe. Price rallies into overbought territory. The MACD prints a bearish crossover that lines up with RSI above 70. This combination triggers the short.
| Condition | What you see |
| RSI above 70 | Price rallied into overbought territory |
| MACD bearish crossover | MACD Line dropped below the Signal Line. Histogram flipped negative |
| Short on candle open | Entry taken at the open of the next candle |
| Invalidation above recent swing high | Beyond the prior top |
| MACD bullish crossover | Exit signal |
Example 2: Regular Bullish Divergence on XAUUSD (H1)
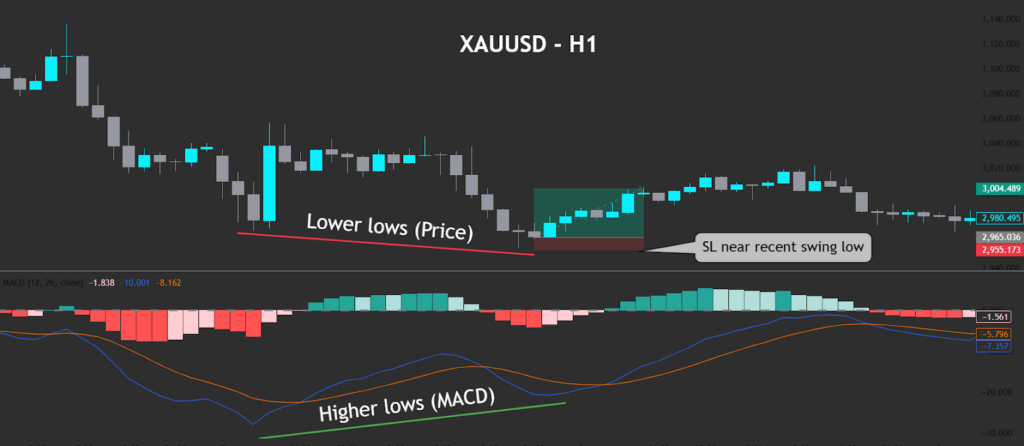
XAUUSD on the hourly timeframe. Price prints lower lows. MACD prints higher lows. The mismatch tells you downside momentum is fading.
| Step | What you see |
| Price makes a lower low | Price keeps falling |
| MACD makes a higher low | Momentum is building back |
| Potential long zone | Price bases and forms a bullish candle |
| Invalidation near the recent swing low | Beyond the divergence low |
| Trade management | Scale out, trail, or exit at structure |
Timeframes and Market Conditions
Best Timeframes for MACD
- H1 to H4. Fast but meaningful moves. Good for intraday funded accounts.
- D1 and higher. Clearer divergences and stronger trend context. Better for swing traders.
Trending vs Ranging Markets
| Market condition | Crossover strategy | Divergence strategy |
| Strong trend | High-probability crossovers. Ride momentum until the histogram peaks. | Low probability. Momentum confirms the trend. |
| Late-stage trend | Weaker crossovers. Watch for false signals. | Bearish divergence in uptrends. Bullish divergence in downtrends. |
| Sideways range | Many false signals. | Divergence at the range extremes can flag breakout traps. |
MACD in a Prop Trading Account
MACD works well for prop traders if the strategy fits inside drawdown limits. MACD signals often need wider invalidation levels by default, so testing the strategy on a demo first is the smart move. Use it to figure out your risk sizing before going live.
Why MACD Suits Prop Traders
- Clear, rule-based entries and exits reduce emotional decisions
- Histogram momentum is a useful visual cue for managing open trades
- Crossover signals can be checked at a glance, which helps inside the daily drawdown limits
Practical Use With FXIFY
- Shorter MACD settings suit scalpers on FXIFY’s Raw spreads
- Longer MACD settings let swing divergence on daily charts mature without rushing
- FXIFY’s flexible account sizes let you match the indicator’s setup to your risk per trade
Common MACD Mistakes
- Trading every crossover without checking the higher-timeframe trend
- Ignoring the zero line (above-zero crossovers and below-zero crossovers are not the same)
- Using MACD on its own in overbought or oversold conditions
- Sticking to default settings without adjusting for the timeframe or the asset
Tips for Better MACD Trading
- Confirm crossovers with other tools like RSI or Bollinger Bands
- Focus only on crossovers that line up with higher-timeframe momentum
- Overlay a longer EMA (like the 50-period EMA) to filter out counter-trend trades
- Journal your MACD trades to refine your edge over time
FAQs
What does MACD tell you?
It shows whether upside or downside momentum is in control, how strong that momentum is, and whether it is shifting before the price actually turns.
How do you use MACD as a beginner?
Start with the default 12-26-9 settings. Trade crossovers that align with the larger trend on a higher timeframe. Confirm with a simple structure, like higher highs or lower lows.
MACD or RSI: which one is better?
They work better together. MACD is built for momentum and trend. RSI is designed to detect overbought and oversold conditions. Used in pairs, they confirm each other and reduce false signals.
What is a good MACD value?
There is no single “good” value. Focus on the crossover, the histogram width, and where the MACD sits relative to the zero line.
Is the 12-26-9 MACD strategy profitable?
It can be, with disciplined risk management, higher-timeframe confluence, and consistent execution.
Bottom Line
MACD gives traders a clear, repeatable view of momentum. The MACD Line shows direction. The Signal Line gives the crossover trigger. The histogram shows the strength of the move.
Use it on a higher-timeframe chart. Confirm with the structure. Adjust the settings to fit your style.
For prop traders, MACD pairs naturally with rule-based execution. The signals are objective. The visual cues are clear. The strategy is repeatable.