PPI Impact on Forex: This Week’s Print and What It Did to Price
You saw the number hit the calendar at 14:30. US PPI for April printed at 1.4 percent for the month. The forecast was 0.4 percent….
You saw the number hit the calendar at 14:30. US PPI for April printed at 1.4 percent for the month. The forecast was 0.4 percent. That is not a small miss. The red “high impact” flag was on the event, and a print almost four times the forecast looks like a clear signal to act fast.
Then you looked at the chart. The first hour was quiet. The pairs barely moved. By the end of the afternoon, some of them had drifted the opposite way to what a hot inflation print is supposed to do.
This guide breaks down what PPI printed, how forex and gold actually moved, and why the gap between the headline and the price action matters when you trade a funded account.
Key Terms
| Term | What it means |
| PPI (Producer Price Index) | Measures the change in prices that producers receive for goods and services. It is watched as an early read on inflation. |
| MoM (month over month) | The change from one month to the next. April PPI MoM was 1.4 percent. |
| YoY (year over year) | The change from the same month one year ago. April PPI YoY was 6 percent. |
| Core PPI | PPI with food and energy stripped out. These two are volatile, so the core is used to see the underlying trend. |
| Forecast (consensus) | The number analysts expected before the release. Price often reacts to the gap between actual and forecast, not the actual alone. |
| True range | The full-distance price is covered within a set window, from high to low. A way to measure how big a move actually was. |
| Drawdown | The drop in your account balance or equity from a peak. Funded accounts have fixed drawdown limits you cannot breach. |
What’s in this guide
- What the April PPI print showed, and why the miss was the story
- How the US dollar reacted in the first hour
- How the forex pairs moved over four hours
- What gold and yields did
- Why a hot print did not produce a clean directional move
- What the PPI impact on forex means for reading an event
- FAQs
- Bottom line
What the April PPI Print Showed
The headline numbers were hot.
US PPI for April rose 1.4 percent month over month. That was the biggest monthly jump since March 2022.
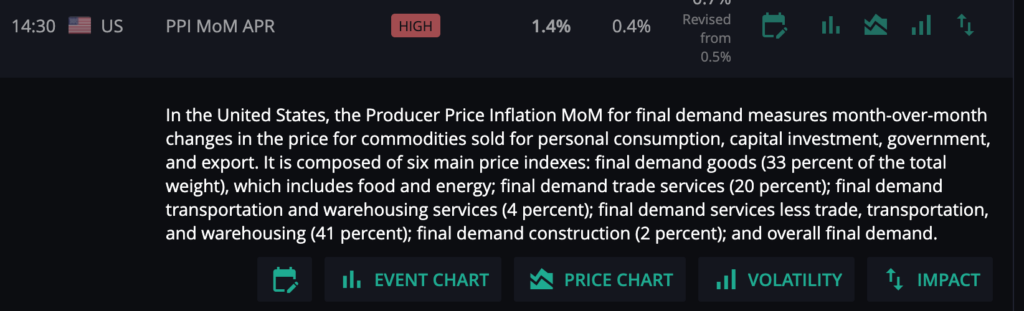
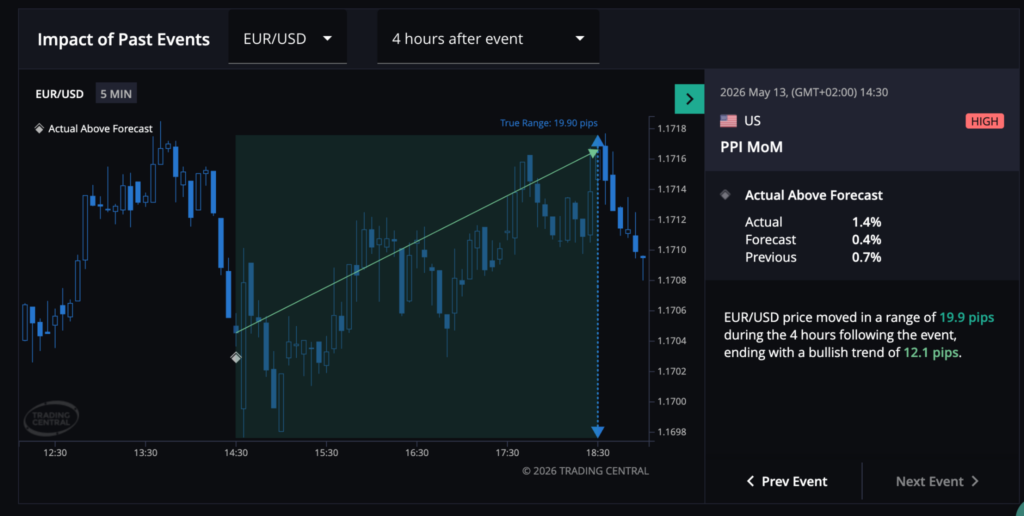
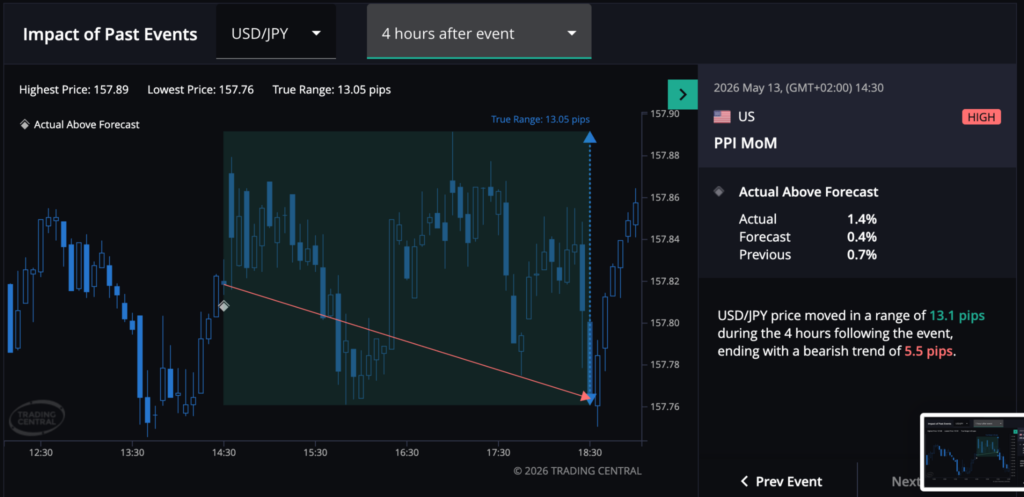
US PPI MoM, April 2026: 1.4% actual vs 0.4% forecast. Year over year, PPI rose 6 percent, the hottest annual reading since December 2022.
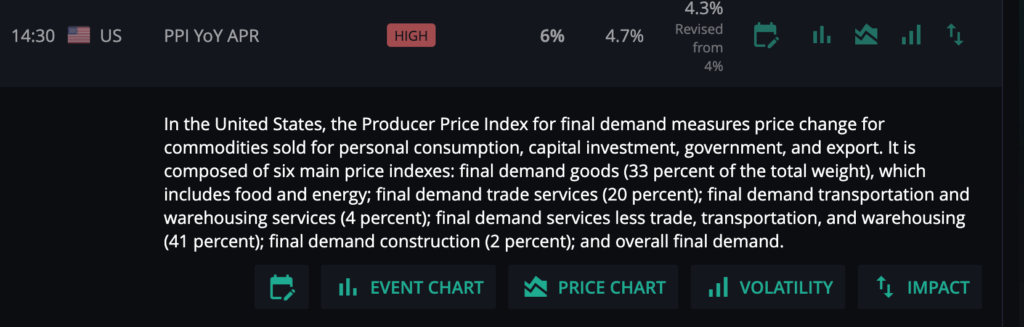
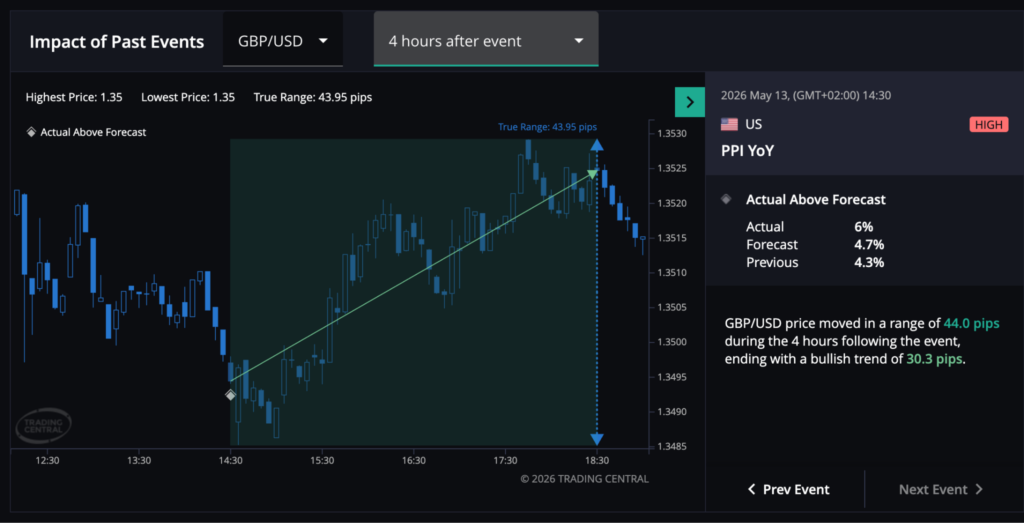
US PPI YoY, April 2026: 6% actual vs 4.7% forecast.
Both numbers came in well above forecast. The monthly figure beat by a full percentage point. The annual figure beat by more than a point.
There is a detail most recaps skip. The previous month was revised up. March MoM was revised from 0.5 percent to 0.7 percent. The annual figure was also revised higher. So the print was not just hot on its own. It also made the month before look hotter. That matters because it shows the trend was stronger than the market expected, not just a single spike.
Core PPI, which strips out food and energy, rose 1.0 percent for the month. The main driver of the headline number was energy, with gasoline prices up sharply on the back of higher oil costs. PPI is a measure of wholesale inflation, so a jump this size points to cost pressures building before they reach the consumer.
For a forex trader, the textbook read is simple. Hotter inflation, stronger dollar. A print this far above forecast should push the US dollar up against most pairs. That is the obvious trade.
The charts did not make it that simple.
How the US Dollar Reacted in the First Hour
Here is where the reaction gets interesting.
A “high impact” event with a near 4x miss sounds like it should produce a large, fast move. The hour after the release tells a different story.
In the hour after the print:
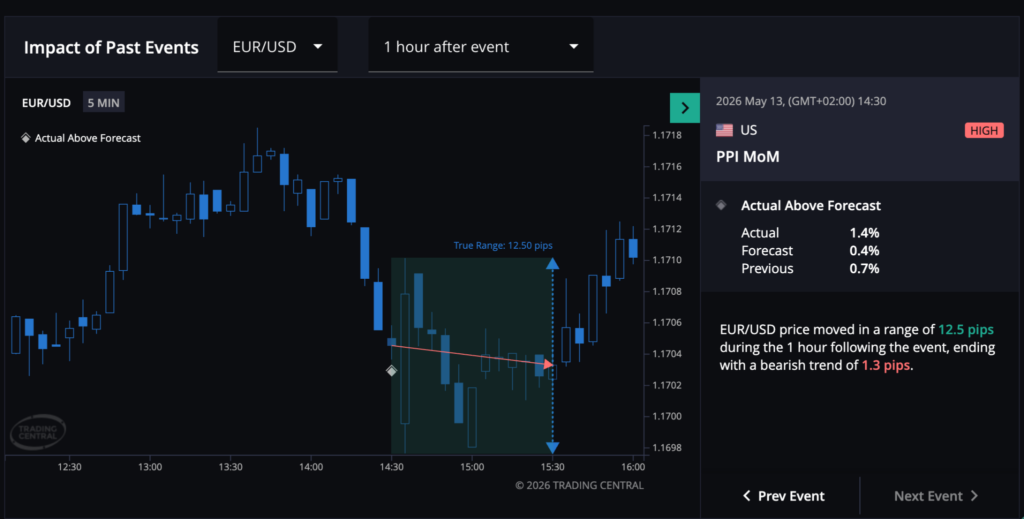
- EUR/USD moved in a range of about 12.5 pips. It closed the hour with a small bearish drift, around 1.3 pips. The dollar is slightly stronger, as the textbook expects, but only just.
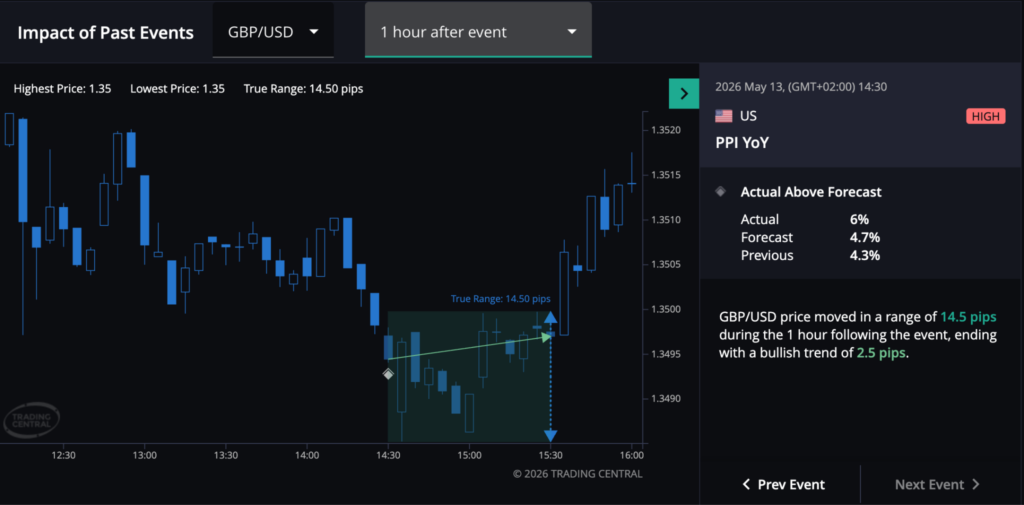
- GBP/USD moved in a range of about 14.5 pips. It closed the hour with a small bullish drift, around 2.5 pips. The dollar is slightly weaker.
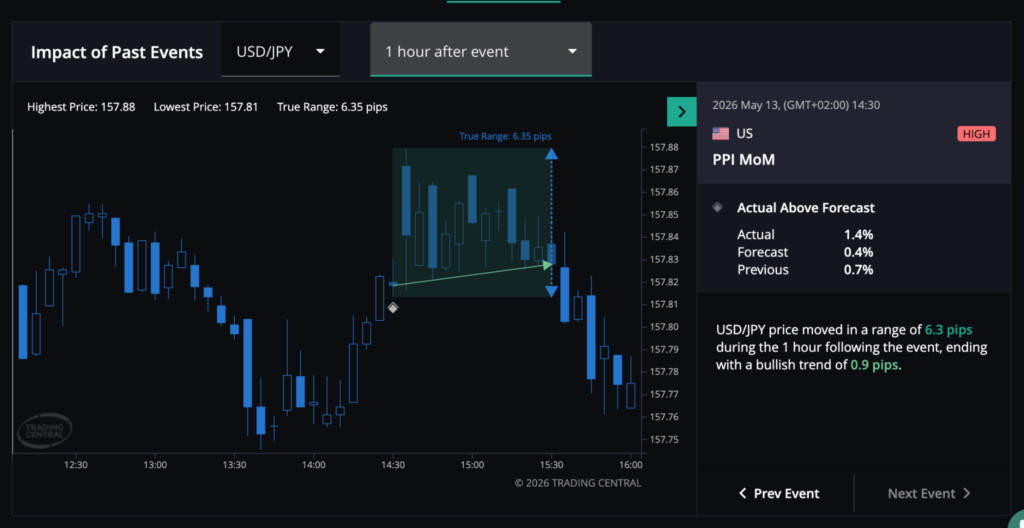
- USD/JPY moved in a range of about 6.3 pips. It closed the hour with a small bullish drift, around 0.9 pips.
Read those ranges again. The biggest of the three was 14.5 pips. For a red-flag event that beat the forecast by a full point, these are contained moves.
This is the first lesson. The impact rating on your calendar tells you that a release can move the price. It does not tell you whether the move will be large or in which direction. The size of the surprise and the size of the price reaction are not the same thing.
If you had widened your stop expecting a big news candle, you were carrying extra risk for a move that did not come in the first hour.
How the Forex Pairs Moved Over Four Hours
The four-hour windows changed the picture again.
Over the four hours after the release:
- EUR/USD moved in a range of about 19.9 pips and closed the window with a bullish drift of around 12.1 pips. The euro rose against the dollar.
- GBP/USD moved in a range of about 44 pips and closed the window with a bullish drift of around 30.3 pips. The pound rose against the dollar.
- USD/JPY moved in a range of about 13.1 pips and closed the window with a small bearish drift of around 5.5 pips. The dollar slipped slightly against the yen.
Look at what happened to the textbook trade. Hot inflation is supposed to lift the dollar. Over these four hours, the dollar was weaker against the euro and the pound, and roughly flat to slightly down against the yen. The obvious trade did not work cleanly on any of the three.
One honest caveat. These windows are anchored to the PPI release time, but PPI was not the only thing moving that afternoon. There were Federal Reserve speakers on the calendar, the market was watching headlines from a high-profile US-China meeting, and the oil story was still live. So this is what the charts show in the hours after the print. It is not proof that PPI alone caused the drift, or that the reaction “reversed.” The point is simpler and still useful: the move you saw at the four-hour mark was not the move you saw at minute five.
For more on how scheduled releases ripple through price and into a funded account, see our guide on when to sit out a news event.
What Gold and Yields Did
Gold and bond yields fill in the rest of the reaction.
US Treasury yields rose after the print. The 10-year yield touched its highest level of the year, trading around 4.48 percent, and the 30-year traded above 5 percent, according to reporting from Bloomberg and CNBC. Hotter inflation data tends to lift yields, because the market starts to expect interest rates to stay higher for longer. For background on how split the Fed itself has been on rates, see our write-up on the divided vote at Powell’s final FOMC.
Gold fell. Reuters-cited market data showed spot gold dropping for a second straight session that week, trading near the 4,700 dollar area. The move was not due to PPI alone. A firmer dollar and the broader shift in rate expectations were both in play. But the direction is the point worth noting.
That can feel backward. Gold is often described as an inflation hedge, so a hot inflation print sounds bullish for gold. But gold does not pay a yield. When yields rise and the dollar firms, holding a non-yielding asset becomes less attractive, and gold often comes under pressure. That is the dynamic that played out here.
This is a useful reminder. “Inflation hedge” is a general idea, not a rule that prints on cue. On the day, the yield reaction and the dollar reaction mattered more for gold than the inflation label.
Why a Hot Print Did Not Produce a Clean Move
Put the pieces together, and you get the real takeaway.
The print was hot. The miss was large. The calendar flag was red. Every headline input said “big directional move.” The price action said something more complex. Contained ranges in the first hour. Mixed and partly counter-textbook drift over four hours. Gold is falling on an inflation print.
There are a few plain reasons this happens.
- First, the market often prices in expectations before the release. By the time the number lands, some of the move is already done. The reaction is to the surprise, and even a large surprise can produce a small move if positioning was already leaning that way.
- Second, one release does not trade in a vacuum. Other events, other headlines, and broader positioning all push price at the same time. A clean one-to-one reaction is the exception, not the rule.
- Third, the immediate reaction and the multi-hour reaction are different trades with different risks. The first-hour range tells you about the spike. The four-hour drift tells you about what happened after the spike settled. Treating them as the same thing is a mistake.
Note: the figures here describe what these specific charts showed after this specific release. They are not a prediction of how the price will react to the next print. Past reaction is context, not a forecast.
What the PPI Impact on Forex Means for Reading an Event
You do not need to predict the next print to take something useful from this one. The reaction itself teaches a few things about how to read a red flag event.
The impact rating is about volatility, not direction. A “high impact” label means the release can move the price. It does not tell you which way, and it does not promise a large move. Plan for a range of outcomes, not one.
The size of the surprise is not the size of the move. April PPI beat forecast by a full point and still produced contained first-hour ranges on the majors. A big number on the screen does not guarantee a big candle on the chart.
The first hour and the rest of the day can disagree. The immediate spike and the slower drift after it are not the same move. If your plan only accounts for the spike, the drift can still work against you.
Counter-textbook reactions are normal. Hot inflation did not lift the dollar cleanly here, and gold fell on an inflation print. The “obvious” reaction is a starting point for thinking, not a setup you can lean on.
This is educational content about how to read an event. It is not advice on what to trade or a prediction of market direction. Always make your own trading decisions based on your own plan and risk rules.
FAQs
What is PPI, and why do forex traders watch it?
PPI, the Producer Price Index, measures the change in prices received by producers for their goods and services. Forex traders watch it because it is an early read on inflation. Inflation data feeds into interest rate expectations, which are a major driver of currency value.
What did the US PPI print for April 2026?
April PPI rose 1.4 percent month over month and 6 percent year over year. Both came in well above forecast. The monthly figure was the biggest jump since March 2022, and the annual figure was the hottest since December 2022. The previous month’s figures were also revised higher.
Is PPI more important than CPI?
They measure different things. CPI tracks prices consumers pay. PPI tracks prices producers receive, earlier in the supply chain. PPI is sometimes seen as a leading signal for CPI. Most traders watch both rather than ranking one above the other.
Why did the dollar not rise cleanly after a hot PPI print?
Hotter inflation is the textbook reason for a stronger dollar, but price does not always follow the textbook. The market often prices in expectations before the release, other events move the price at the same time, and positioning matters. In this case, the majors showed contained first-hour ranges and mixed drift over the following hours.
Why did gold fall when inflation came in hot?
Gold is often called an inflation hedge, but it does not pay a yield. When the hot print pushed bond yields higher and firmed the dollar, holding a non-yielding asset became less attractive. On the day, the yield and dollar reaction mattered more for gold than the inflation label.
How big was the move in USD pairs after the PPI release?
In the first hour, EUR/USD moved in a range of about 12.5 pips, GBP/USD about 14.5 pips, and USD/JPY about 6.3 pips. Over four hours, the ranges were wider, with GBP/USD covering about 44 pips. For a high-impact event, the immediate moves were fairly contained.
Does a “high impact” calendar flag mean a big move is coming?
No. The impact rating tells you a release has the potential to move the price. It does not tell you the direction, and it does not guarantee the move will be large. It is a signal to plan for volatility, not a signal that points one way.
Should I trade the PPI release?
That is a decision only you can make, based on your trading plan, strategy, and risk rules. This guide explains how the release moved the price. It does not recommend trading it or avoiding it.
What should I take from this print going into next week?
The useful takeaway is about process, not prediction. A large surprise can still produce a small immediate move. The first hour and the rest of the day can disagree. And the “obvious” reaction to a data point is a starting point for analysis, not a setup you can rely on.
Bottom Line
April PPI was hot. It printed at 1.4 percent month over month and 6 percent year over year, both well above forecast, with the prior month revised higher. Every headline input pointed to a big directional move in the dollar.
The charts were more mixed. USD pairs showed contained ranges in the first hour. Over four hours, the dollar was weaker against the euro and the pound and roughly flat against the yen, which is not the clean textbook reaction to hot inflation. Gold fell, and yields rose.
The lesson is not about predicting the next release. It is about how you read an event. The PPI impact on forex this week was a reminder that a red calendar flag means volatility is possible, not that direction is known or that the move will be large. The size of the surprise and the size of the price reaction are two different things. Build your plan around that, and a print like this becomes information you can use instead of a trap.
Risk Disclaimer
Trading foreign exchange, CFDs, and other leveraged products carries a high level of risk and may not be suitable for all investors. You may lose some or all of your initial capital. Past performance is not indicative of future results. The information in this article is for educational purposes only and is not financial advice. Always consult a qualified financial professional before making any trading decisions.