Symmetrical Wedge Pattern Explained
A symmetrical wedge pattern is a chart shape where price makes lower highs and higher lows that meet at a point. It is also called…
A symmetrical wedge pattern is a chart shape where price makes lower highs and higher lows that meet at a point. It is also called a symmetrical triangle. This guide shows you how to spot it, how to trade it and where it can fail.
What a Symmetrical Wedge Pattern Is
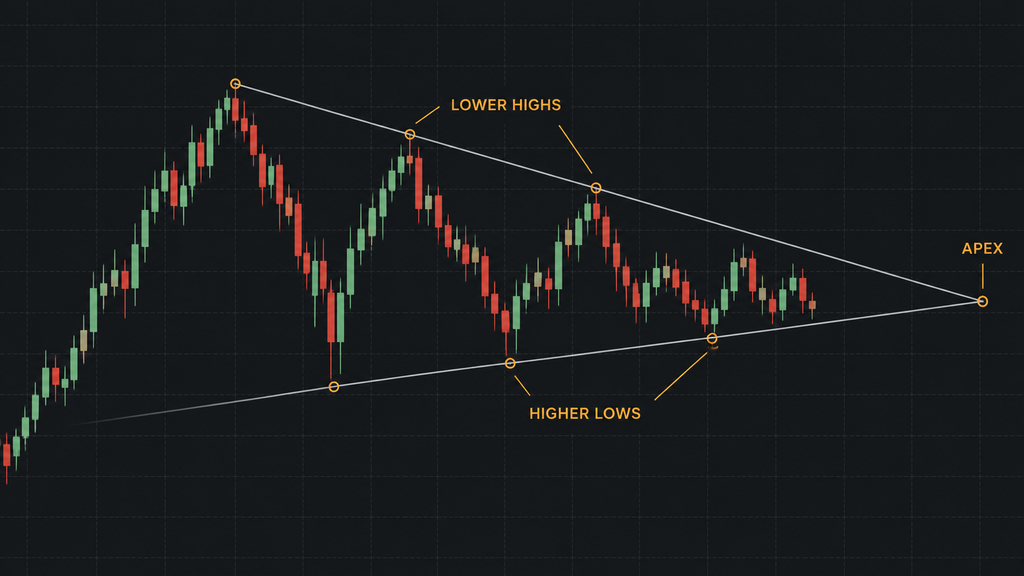
A symmetrical wedge pattern forms between two trendlines that move toward each other:
- The upper line slopes down. It connects a series of lower highs.
- The lower line slopes up. It connects a series of higher lows.
Each swing up stops lower than the one before. Each swing down stops higher than the one before. Price moves get smaller and smaller until the two lines meet.
This shape shows a market that has not chosen a direction yet. Buyers keep pushing the lows higher. Sellers keep pushing the highs lower. At some point, price breaks out of the shape.
How to Spot the Pattern on a Chart
Lower Highs and Higher Lows
Start with the highs. Each new high should be lower than the last one. Then check the lows. Each new low should be higher than the last one.
If the highs are flat or the lows are flat, you are looking at a different pattern. The comparison table later in this guide shows the difference.
At Least Two Touches on Each Line
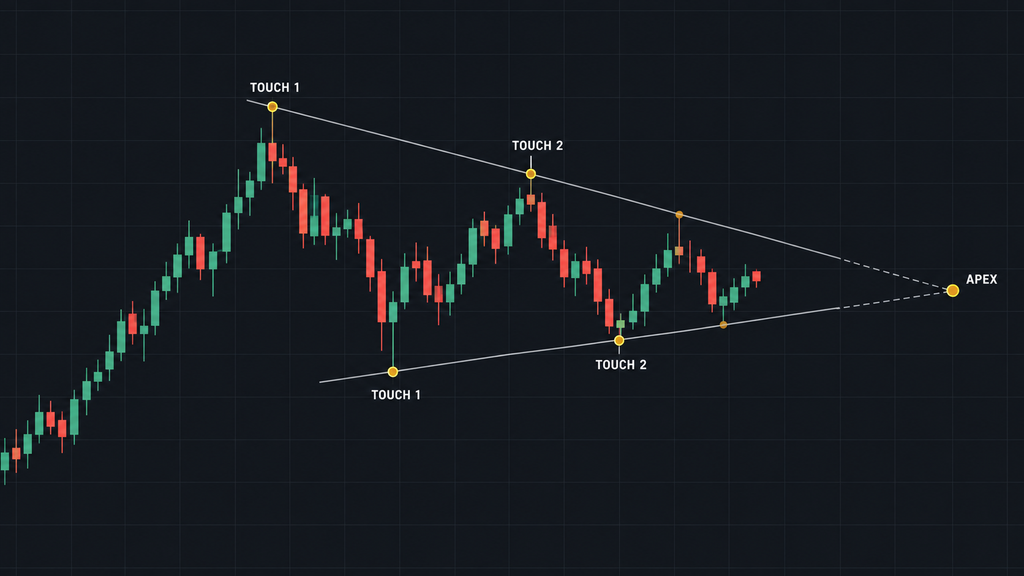
You need at least two highs to draw the upper line. You need at least two lows to draw the lower line. More touches make the lines easier to see.
Draw each line across the highs and lows that price has already made. Do not force a line through points that do not fit.
The Apex
The apex is the point where the two lines meet. You can find it by extending both lines to the right. The pattern can break out before price gets near the apex.
Which Way Can Price Break?
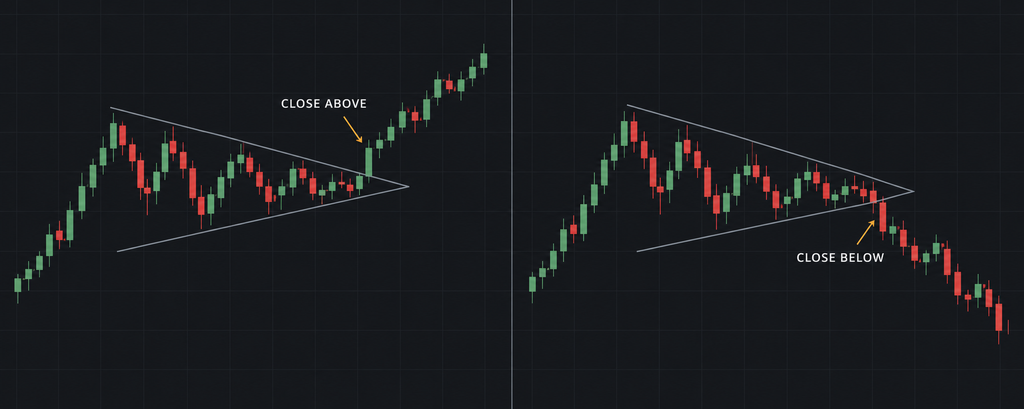
A symmetrical wedge pattern does not tell you the direction in advance. Price can break above the upper line or below the lower line.
Do not guess the direction and enter early. Wait for price to show you which way it breaks. The trend before the pattern may give you context, but it does not confirm the breakout.
How to Trade a Symmetrical Wedge
Wait for a Candle to Close Outside the Pattern
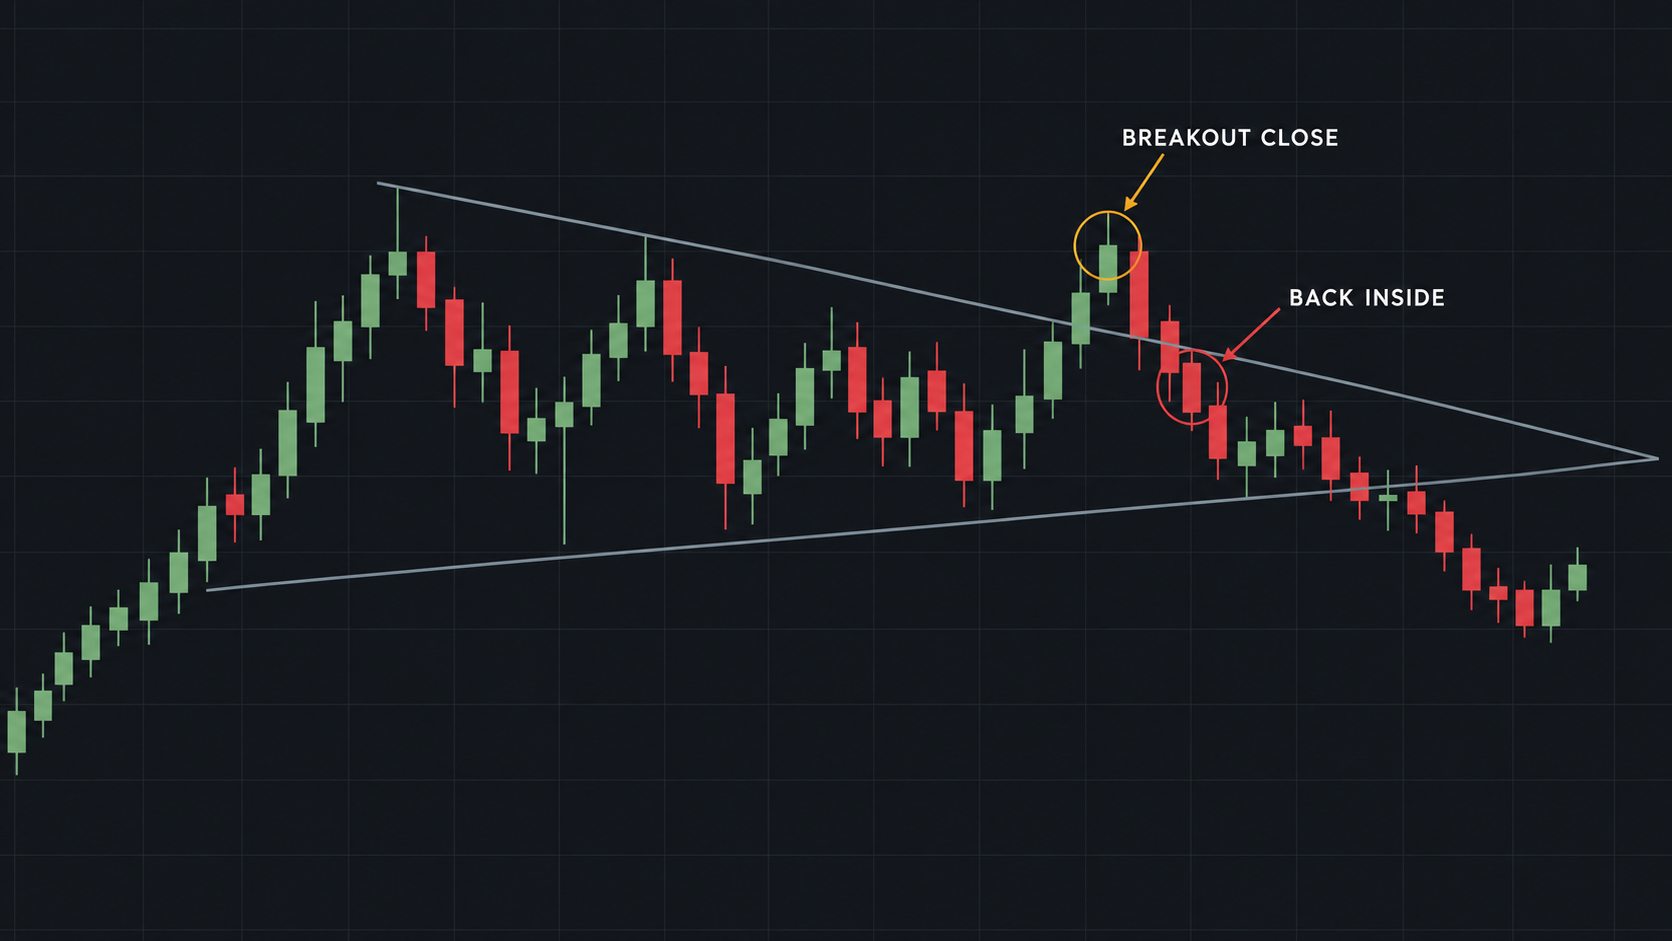
A breakout happens when price moves outside one of the two lines. Price can poke through a line and then fall back inside it. To filter some of these moves, wait for a full candle to close outside the line.
- A close above the upper line is an upward breakout.
- A close below the lower line is a downward breakout.
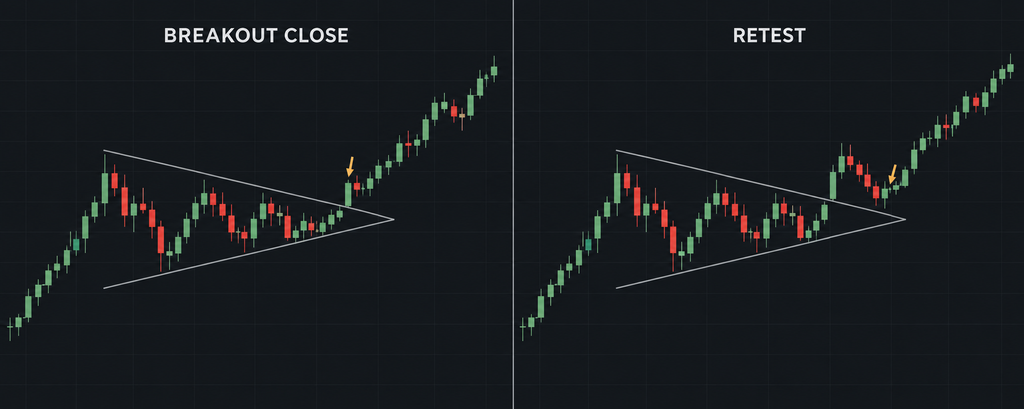
Entry Option 1: On the Breakout Close
You enter as soon as the breakout candle closes. You buy after a close above the upper line. You sell after a close below the lower line.
This entry gets you in early. The trade-off is that the breakout may still fail and price may return inside the pattern.
Entry Option 2: On a Retest
After a breakout, price sometimes moves back to touch the broken line. This is called a retest. You enter when price touches the line and then moves away from it in the breakout direction.
This entry can give you a closer stop loss. The trade-off is that price may never come back. If there is no retest, there is no trade.
Where to Place Your Stop Loss
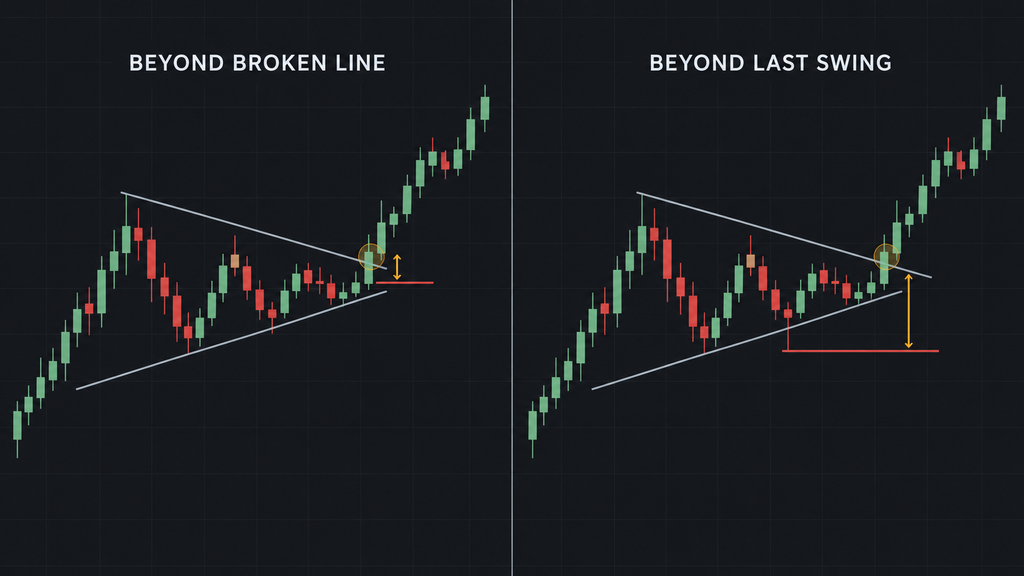
Place your stop loss where the breakout is proven wrong. Here are two places to put it. Learn the basics in Day Trading Stop Loss Explained.
- Beyond the broken line. On an upward breakout, place the stop loss below the upper line. On a downward breakout, place it above the lower line.
- Beyond the last swing point. On an upward breakout, place the stop loss below the last low inside the pattern. On a downward breakout, place it above the last high inside the pattern.
The second option gives the trade more room. It also means a larger loss if the stop loss is hit. Size your trade so that this loss fits your plan.
A Stop Loss Example
This example uses made-up prices.
- Price closes above the upper line at 1.1060.
- The last low inside the pattern is at 1.1030.
- You place your stop loss a little below that low, at 1.1025.
- Your stop distance is 35 pips.
You then choose a trade size that keeps a 35-pip loss inside your risk amount.
How to Set a Price Target
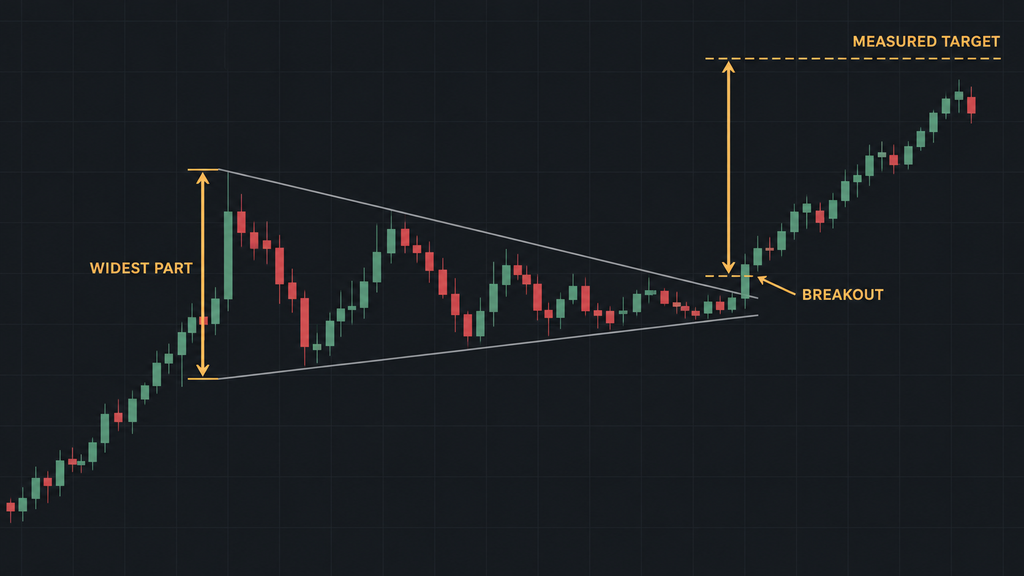
One way to set a target is the measured move. It uses the size of the pattern to estimate a target.
- Find the widest part of the pattern. This is at the start, where the first high and first low are.
- Measure the height of that part in pips.
- Add that height to the breakout price for an upward breakout. Subtract it for a downward breakout.
A Target Example
This example uses the same made-up prices.
- The first high is at 1.1100. The first low is at 1.1000.
- The height of the widest part is 100 pips.
- Price breaks out upward at 1.1060.
- The measured move target is 1.1060 plus 100 pips, which is 1.1160.
The measured move is a guide, not a promise. Price may stop before the target or move past it. You can also take part of the gain at a nearer level, such as a recent high.
False Breakouts and Other Risks
False Breakouts
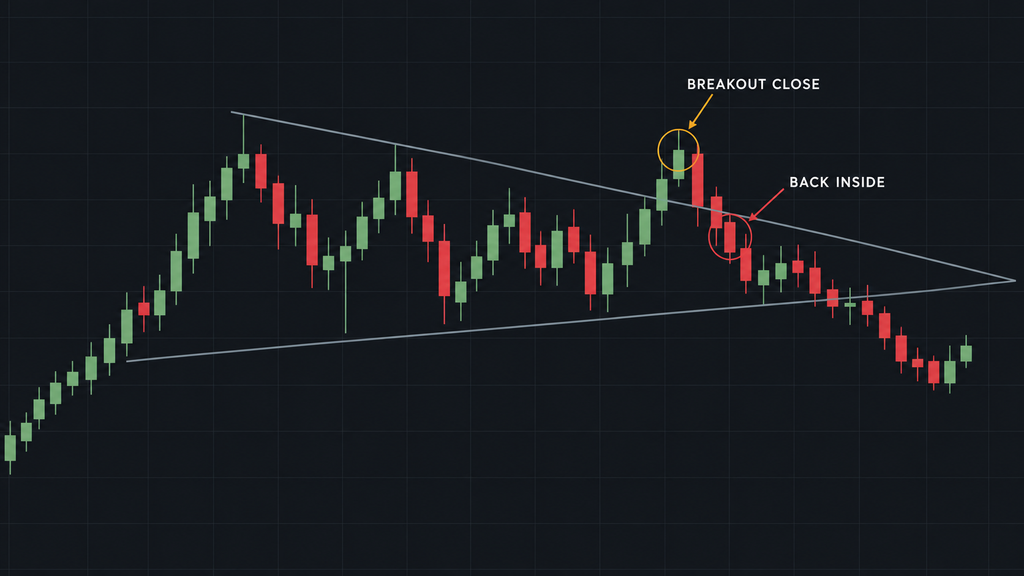
A false breakout happens when price closes outside the pattern and then moves back inside. Your trade can hit its stop loss soon after entry.
Waiting for a candle close filters some false breakouts, but not all. Your stop loss and trade size are what limit the loss when one happens.
Fast Price Moves
A breakout can be sharp. In fast markets, your entry or your stop loss may fill at a worse price than you planned. This gap is called slippage. Your loss can be larger than your planned stop distance.
Drawing the Lines Wrong
Two traders can draw the same pattern in slightly different places. A small change in a line can move your breakout level. Use clear highs and lows, and do not adjust your lines after the fact to fit a trade.
Symmetrical Wedge vs Other Patterns
This table compares the symmetrical wedge pattern with four similar shapes. For terms like trend and range, see Forex Trading Terminology: Key Terms Explained.
| Pattern | Upper line | Lower line |
|---|---|---|
| Symmetrical wedge (triangle) | Slopes down | Slopes up |
| Ascending triangle | Flat | Slopes up |
| Descending triangle | Slopes down | Flat |
| Rising wedge | Slopes up | Slopes up, more steeply |
| Falling wedge | Slopes down, more steeply | Slopes down |
In a symmetrical wedge, the two lines slope in opposite directions. In a rising or falling wedge, both lines slope the same way.
A Checklist Before You Trade the Pattern
Run through these steps each time you see the pattern. Write the answers in your trade journal.
- Check the shape. Are there at least two lower highs and two higher lows?
- Draw the lines. Do both lines touch clear highs and lows without forcing them?
- Wait for the close. Has a full candle closed outside one of the lines?
- Pick your entry. Will you enter on the breakout close or wait for a retest?
- Set your stop loss. Is it beyond the broken line or beyond the last swing point?
- Size the trade. Does the loss at your stop loss fit your risk amount?
- Set your target. Have you measured the widest part and projected it from the breakout?
If you cannot answer yes to each step, skip the trade. Another setup will form.
FAQ
Is a Symmetrical Wedge Bullish or Bearish?
Neither. The pattern shows a market that has not chosen a direction. It only becomes bullish or bearish once price breaks out and closes outside one of the lines.
What Timeframe Works for This Pattern?
The pattern can form on any timeframe, from a few minutes to a full day per candle. On short timeframes, the whole pattern can form and break within hours. On long timeframes, it can take weeks.
What If Price Reaches the Apex Without Breaking Out?
The lines get so close that the pattern loses its shape. You can treat the pattern as no longer useful. Wait for a new setup instead of forcing a trade.
Can I Use This Pattern on a Funded Account?
Yes, chart patterns can be part of your plan on any trading account. On a funded account, check that your stop loss and trade size keep each trade inside the account’s loss limits. Each FXIFY program lists its own limits on the FXIFY programs page.