Page background

Why ‘Set and Forget’ Trading Works (And When It Doesn’t)

Among the many trading strategies available, one method prioritising planning over constant monitoring is ‘Set and Forget’ trading — a method used worldwide to simplify execution. This strategy involves setting up a trade entry, stop-loss, and profit target, and then letting the market run its course without intervention. But is this Set and Forget strategy effective for forex traders, the stock market, and broader global financial markets?

This article explores the Set and Forget approach — its core concepts, pros, cons, and how it fits different trading strategies, including prop trading. This guide helps you decide if this strategy fits your trading plan.

What is ‘Set and Forget’ Trading?

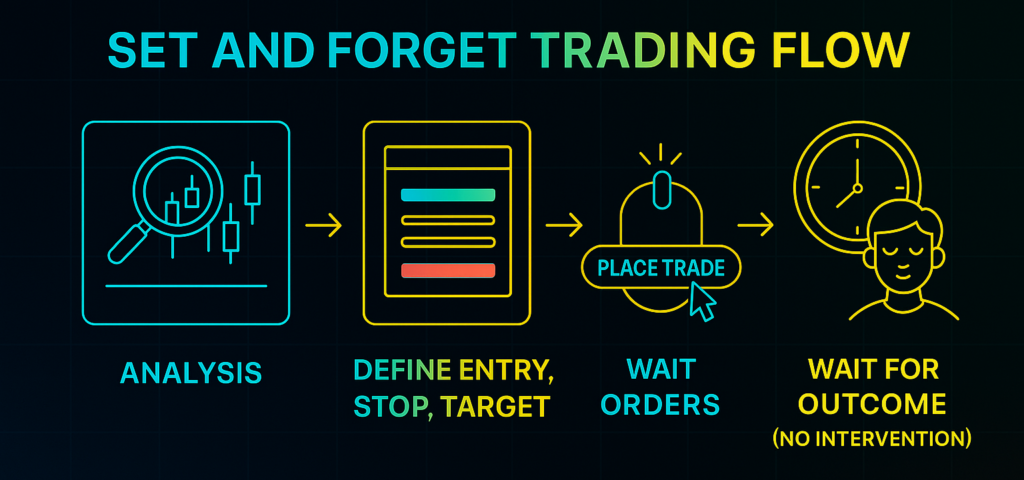
‘Set and Forget’ trading is a strategy where traders do all the analysis beforehand, and place orders with predefined entry, stop-loss, and take-profit levels. Once live, the trade runs independently.

The hallmark of this strategy is non-intervention. The trade will automatically close when either the stop-loss or take-profit target is hit. This detachment reduces emotional decisions and supports discipline and time efficiency.

This approach suits traders who want minimal trade management time and manage their stress levels. Once you set the trade, forget it and come back when it wins and loses. An important note: this approach is usually discretionary—that means entries and exits are based on a trader’s analysis, not purely algorithmic or automated systems.

Limit orders support this passive style by defining entries in advance. You establish the position, walk away, and let the market decide the outcome.

Key Principles of Set and Forget

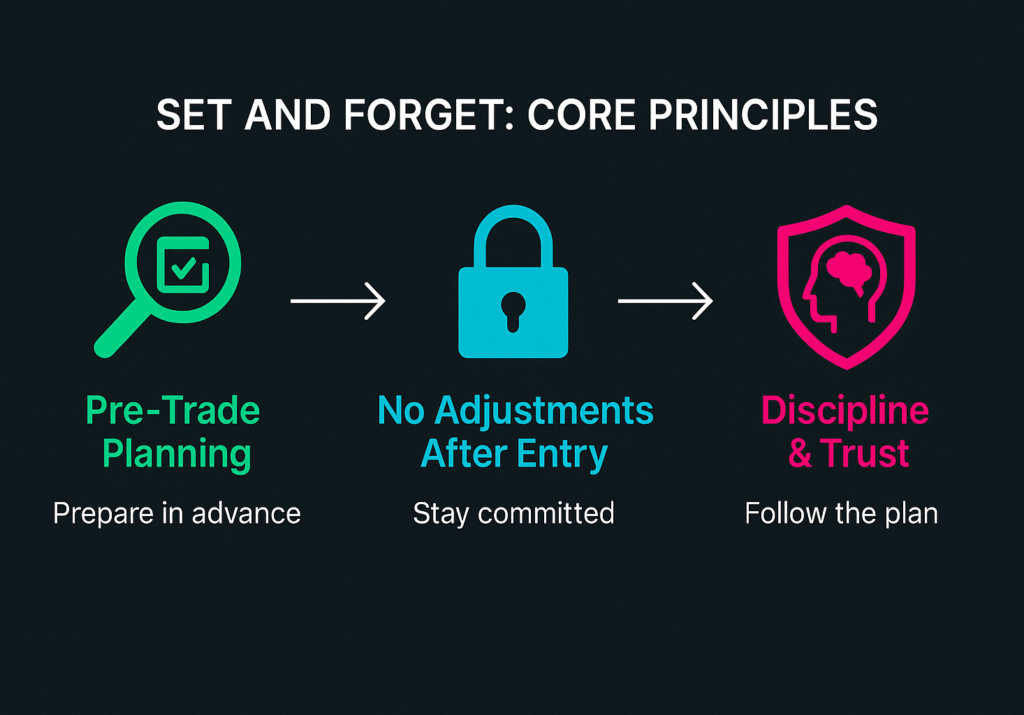
Three core principles define the Set and Forget trading approach:

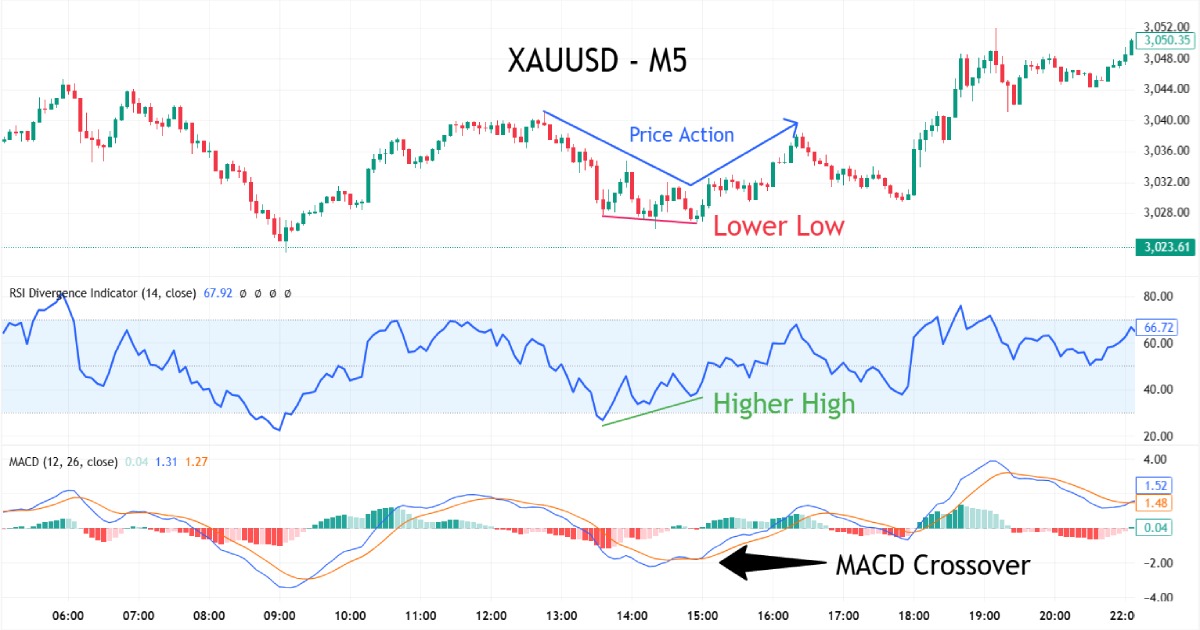
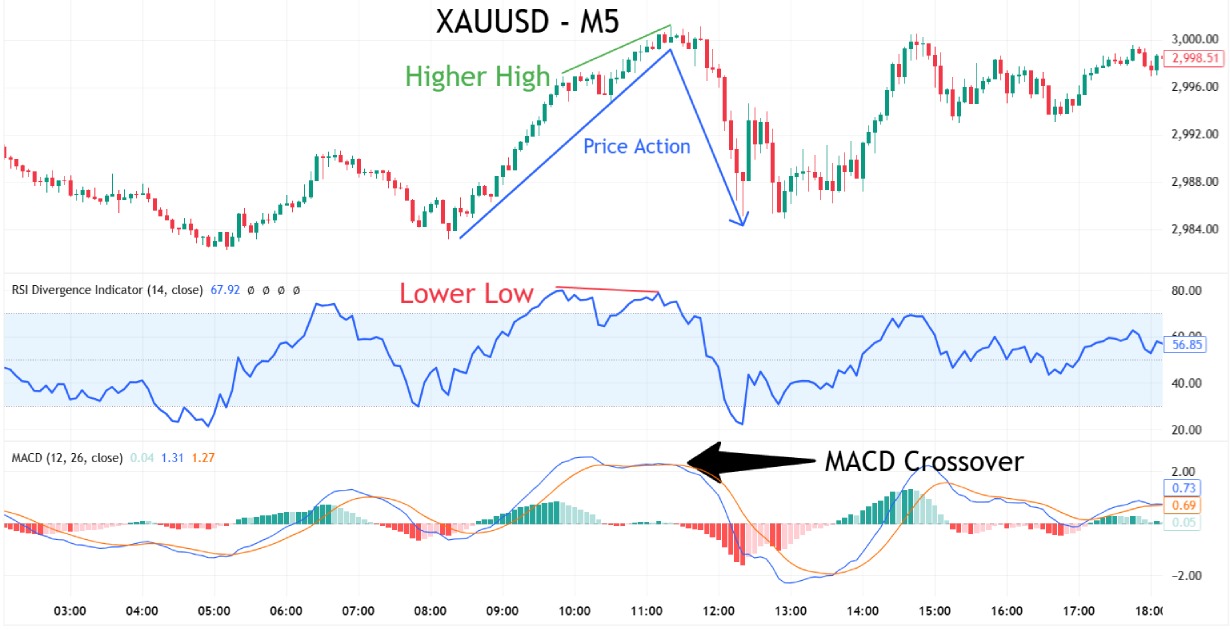
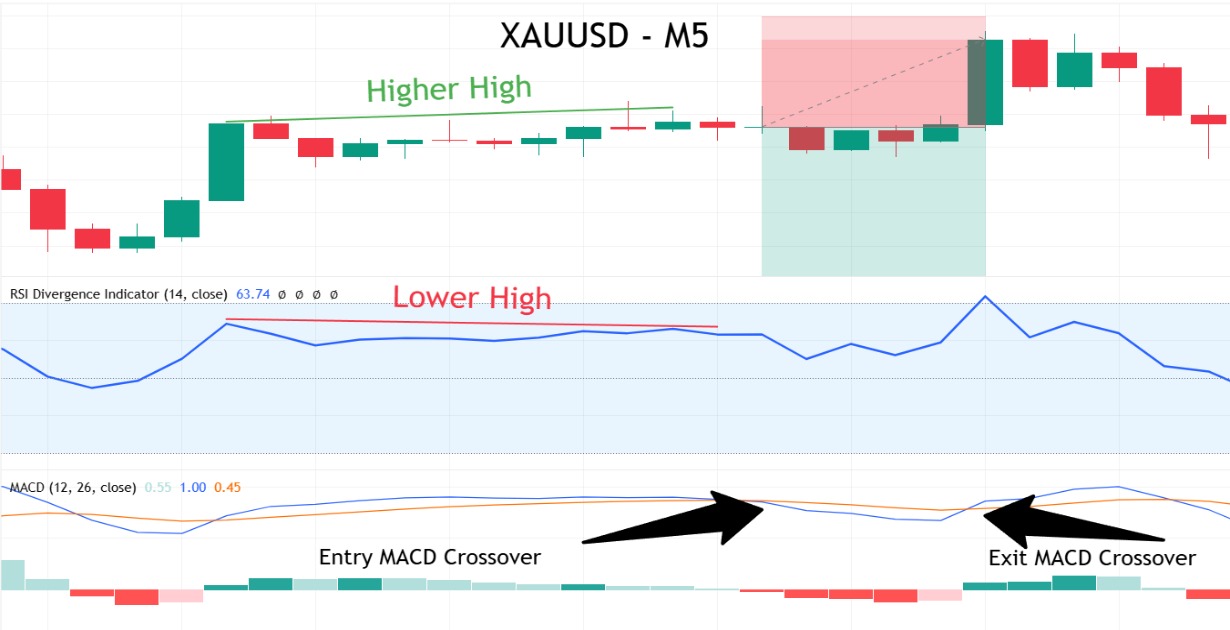
  1. Pre-Trade Planning: All trade parameters must be defined before execution. This includes detailed market analysis—primarily technical (support/resistance levels, trendlines, price action), and sometimes fundamental—to determine the exact entry, stop-loss (based on market structure), and a realistic take-profit target. This defines the full trade setup before execution.
  1. No Post-Execution Adjustment: Strict adherence is key. Once the trade is live, traders must resist the urge to adjust stop-loss or take-profit levels, regardless of market movement or emotional impulses. No reacting. No tweaking. Trust the plan.
  1. Emphasis on Discipline: Success depends on trusting the original trade setup, and avoiding emotional decisions during its operation. Let the setup play out without interference from fear or greed.

Why ‘Set and Forget’ Works: The Benefits

Sticking to these principles offers several advantages for this set and forget strategy:
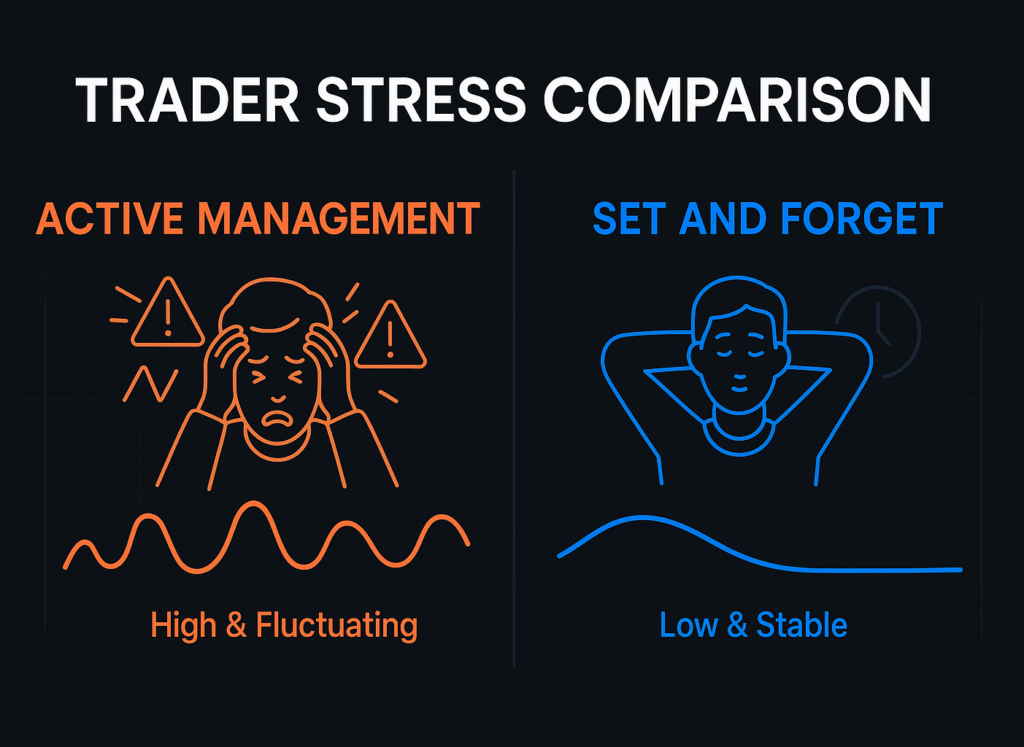
Emotional Control

Trading psychology is one of the biggest challenges that even a professional trader may face. This technique reduces the influence of fear, greed, and impulsiveness by removing the need to manage trades mid-flight. It reduces stress and discourages overtrading.

Time Efficiency

This strategy is ideal for traders who can’t spend much time at the screens or wonder how much time they need to trade effectively. Once a trade is placed, you can walk away — allowing more time for other commitments, strategic development, or simply avoiding screen fatigue.

Enhanced Objectivity

All decisions are made in advance and based on a clear price action analysis. This does not mean reacting emotionally or impulsively when the trade moves for or against you, but rather trusting your initial setup with good risk management. This builds discipline, strengthens trust in your process, and helps you stay consistent over time.

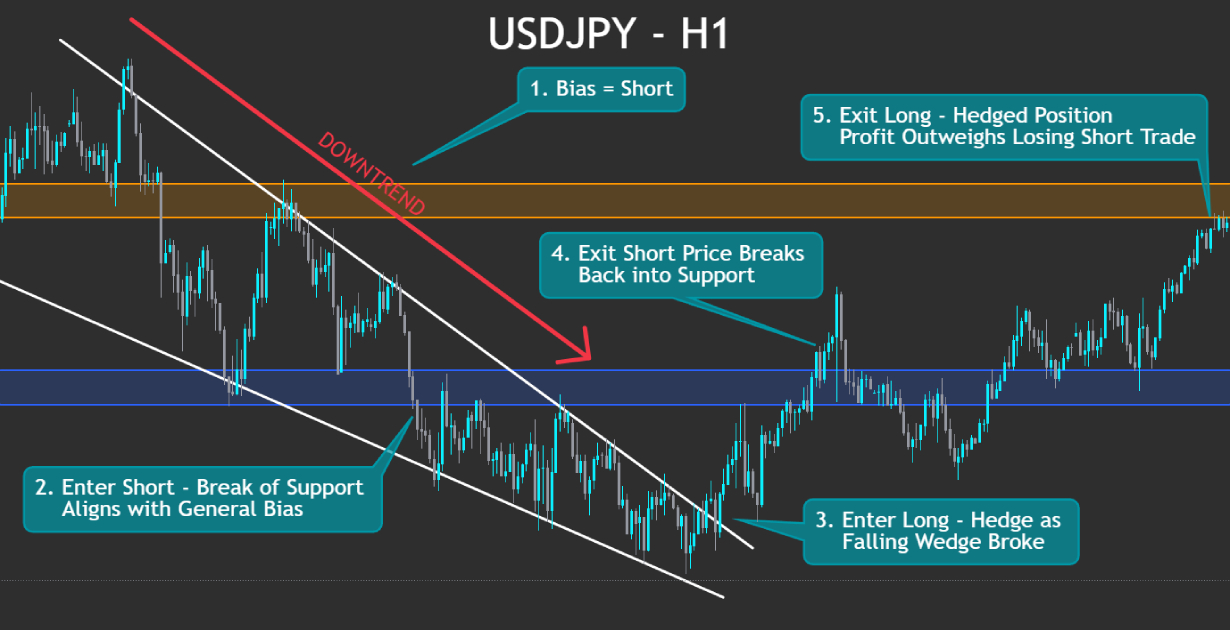
How Set and Forget Fits Different Trading Styles

The suitability of Set and Forget varies by trading timeframe and is not ideal for all trading strategies:

Trading StyleSuitabilityReason / Explanation
ScalpingLowRequires constant, rapid decisions incompatible with the passive nature of Set and Forget. This is one of the unsuitable short-term strategies.
Day TradingMediumCan work for specific setups (e.g., breakouts from key daily levels) but requires careful analysis within the day. A clear trade set with a stop loss and profit target is key.
Swing TradingHighAligns well with holding trades for days/weeks based on analysis of larger market trends (e.g., daily charts), and typically with wider stop loss. This works extremely well with the Set and Forget approach.
Position TradingHighIdeal for long-term trades (weeks/months) based on major market trends, where infrequent adjustments and focus on key levels match the Set and Forget ethos.

Practical Applications and Setups

Several technical strategies work naturally with a Set and Forget approach, especially those that rely on clean, rule-based setups rooted in price action.
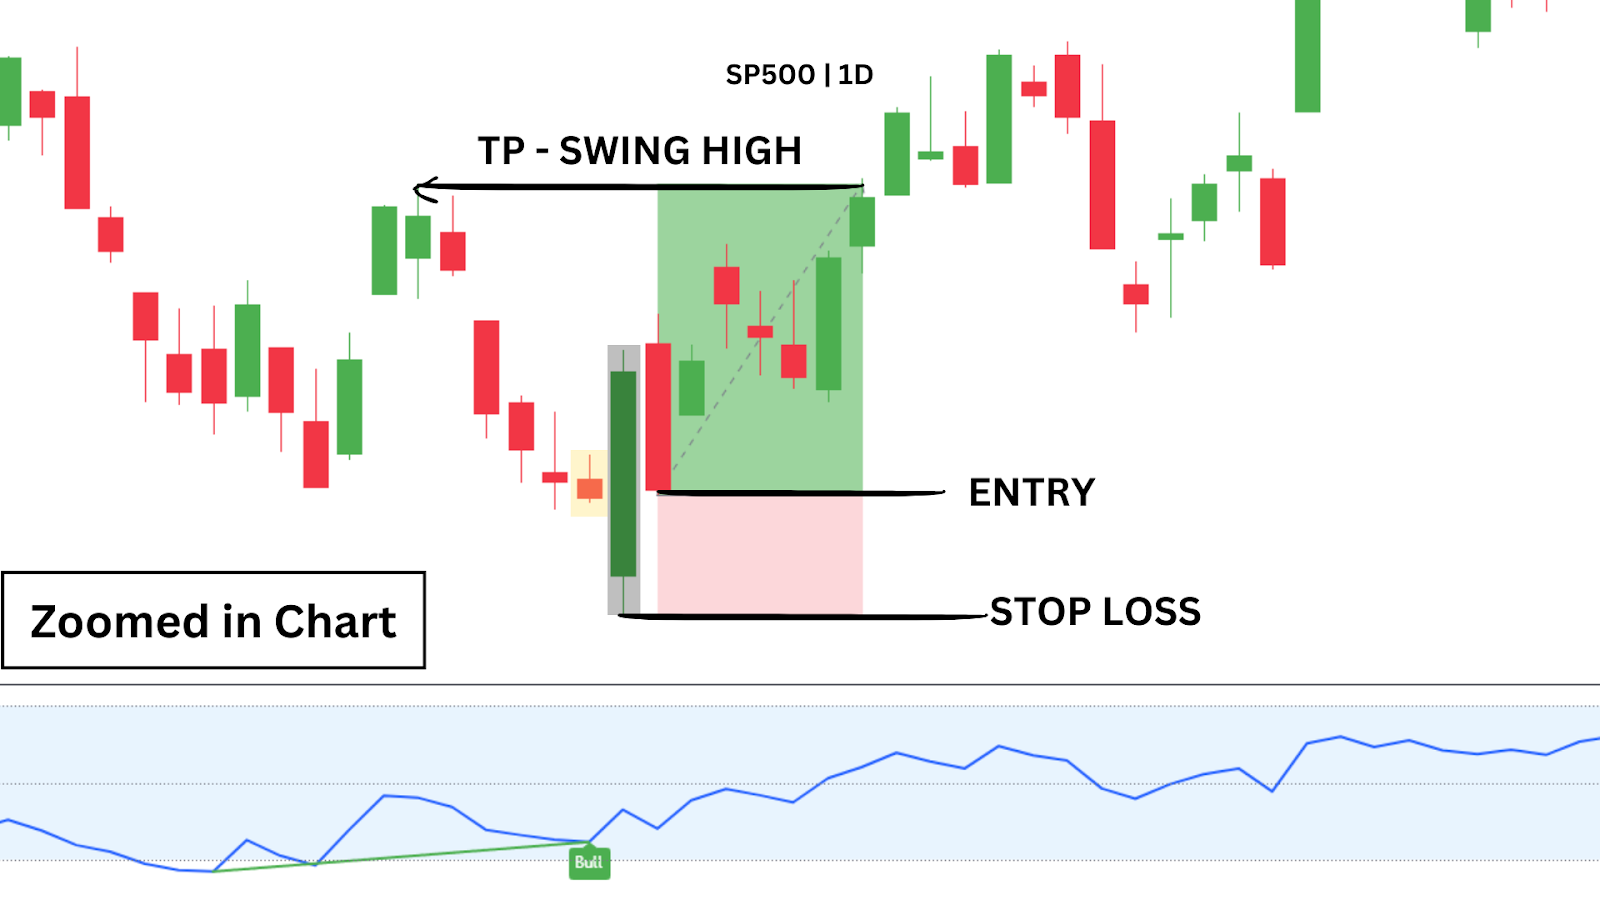
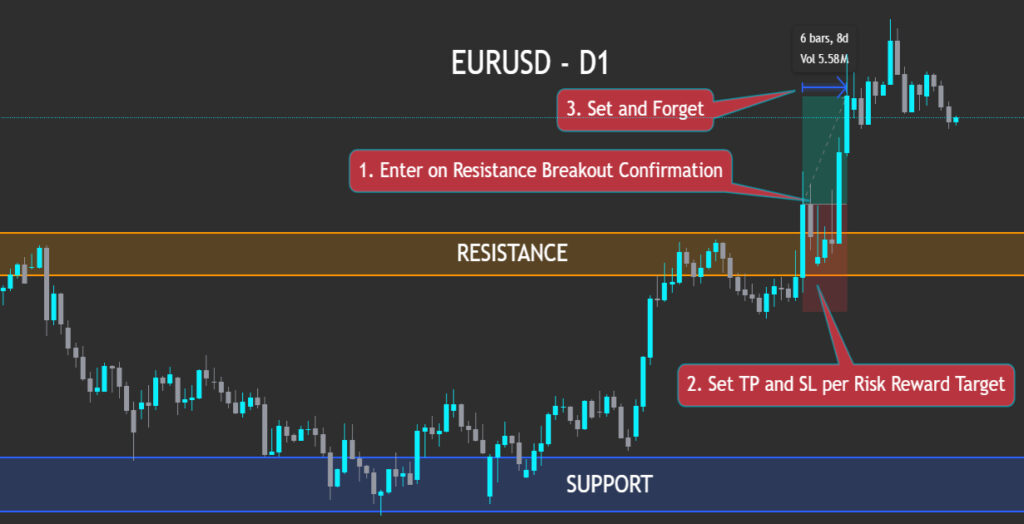
Breakout Trades

Look for a clear support or resistance level on the chart. Place a buy stop (or sell stop) just beyond the breakout level, a stop-loss on the opposite side, and a take-profit based on a measured move or prior market structure. Once live, step back and let the trade run.

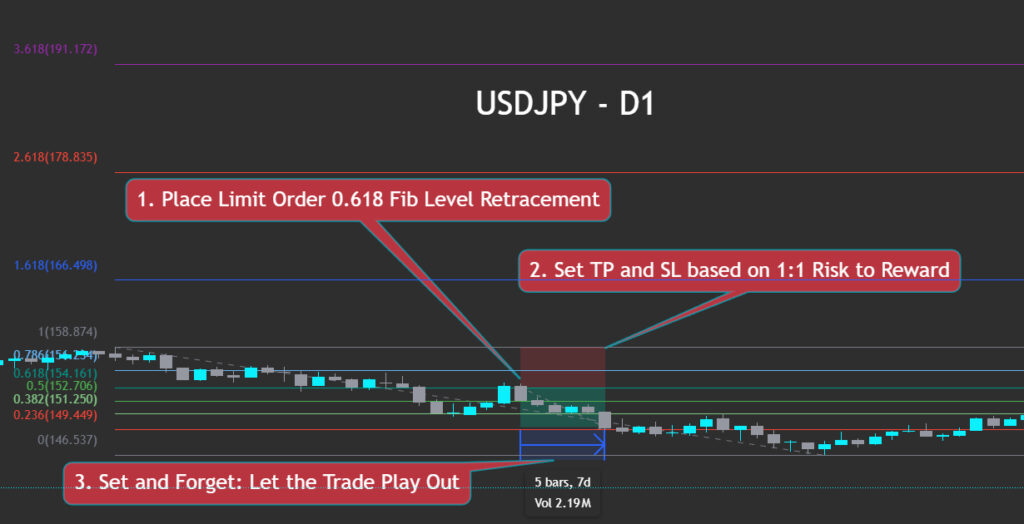
Fibonacci Retracements

Consider using Fibonacci levels or moving averages to identify likely pullback zones. Enter using a limit order, place your stop-loss beyond the previous swing, and set a target in the direction of the trend.
After entry, avoid adjusting — trust the setup to unfold.

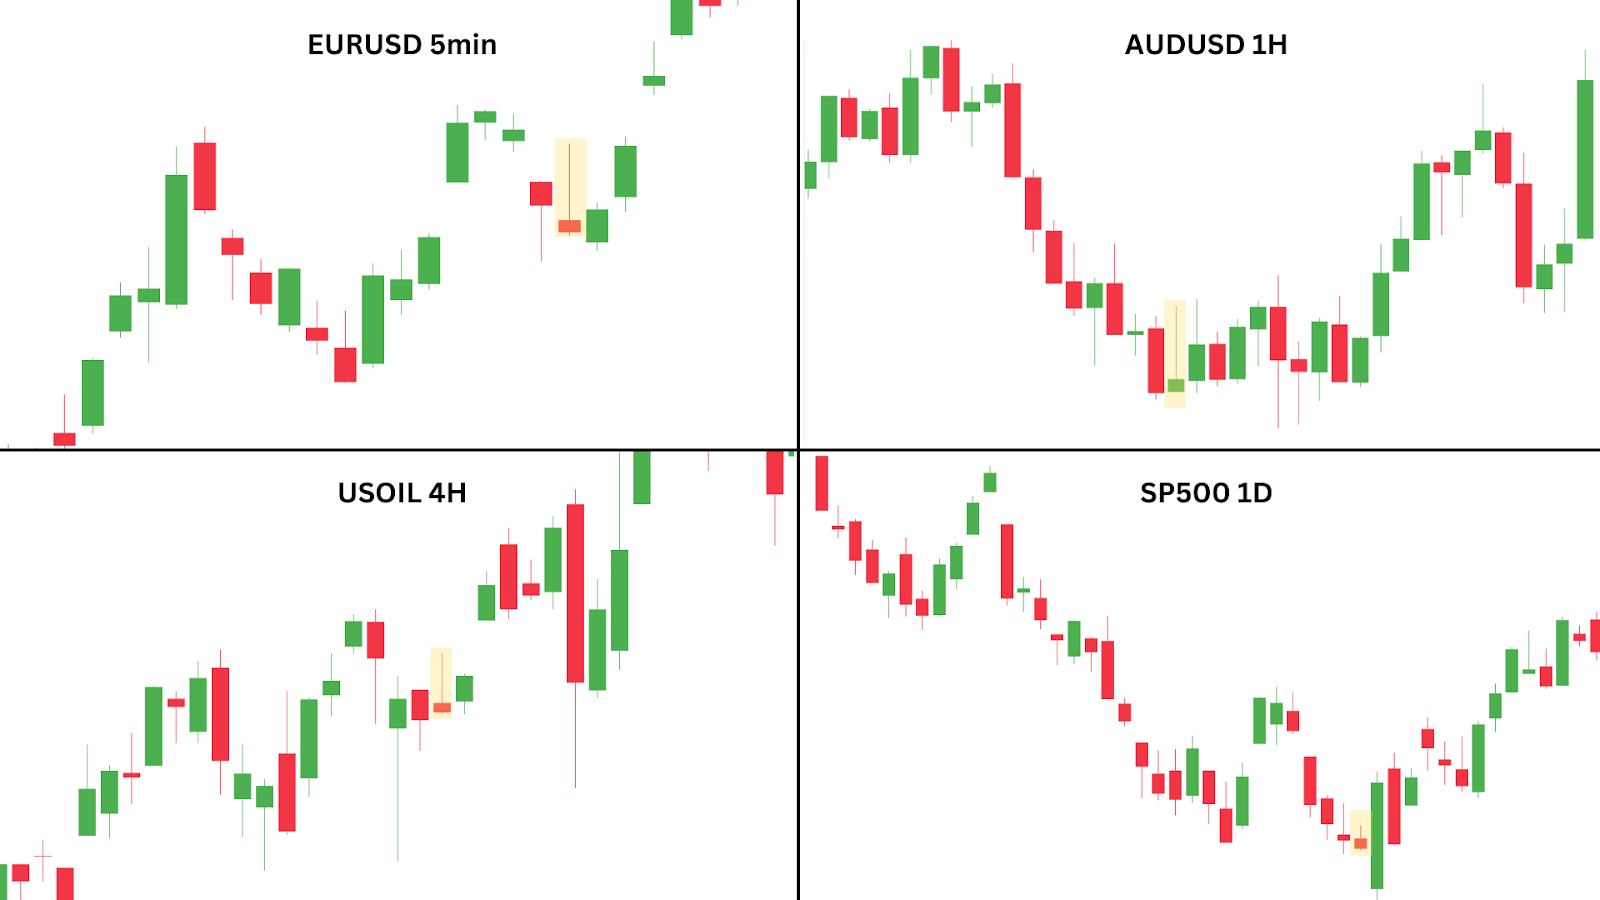
Trend-Following with Price Action

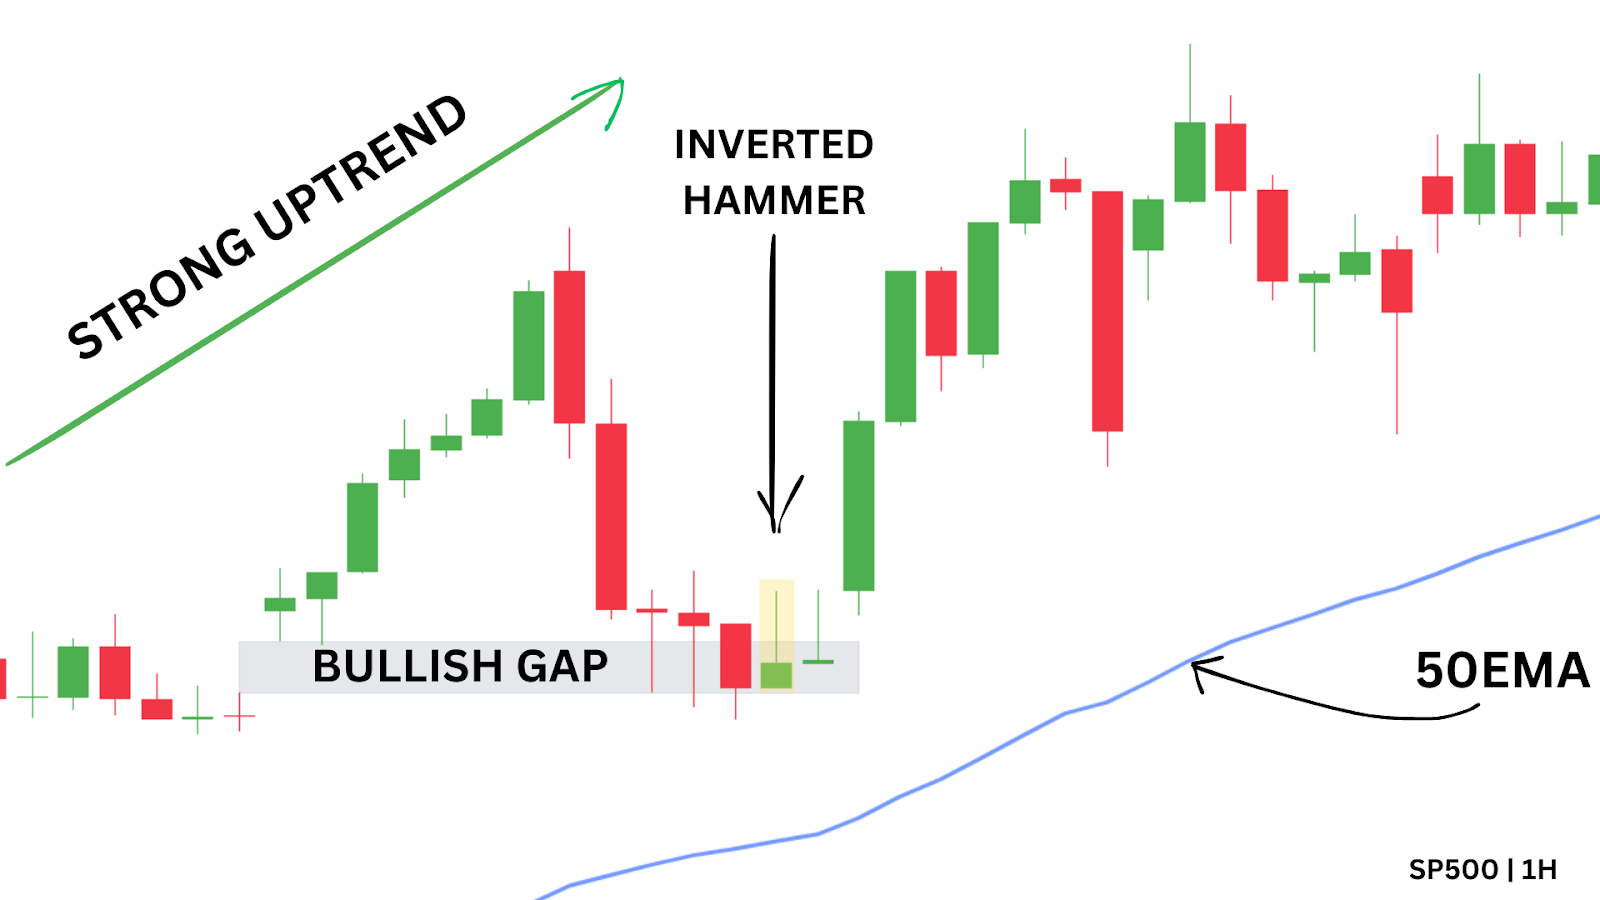
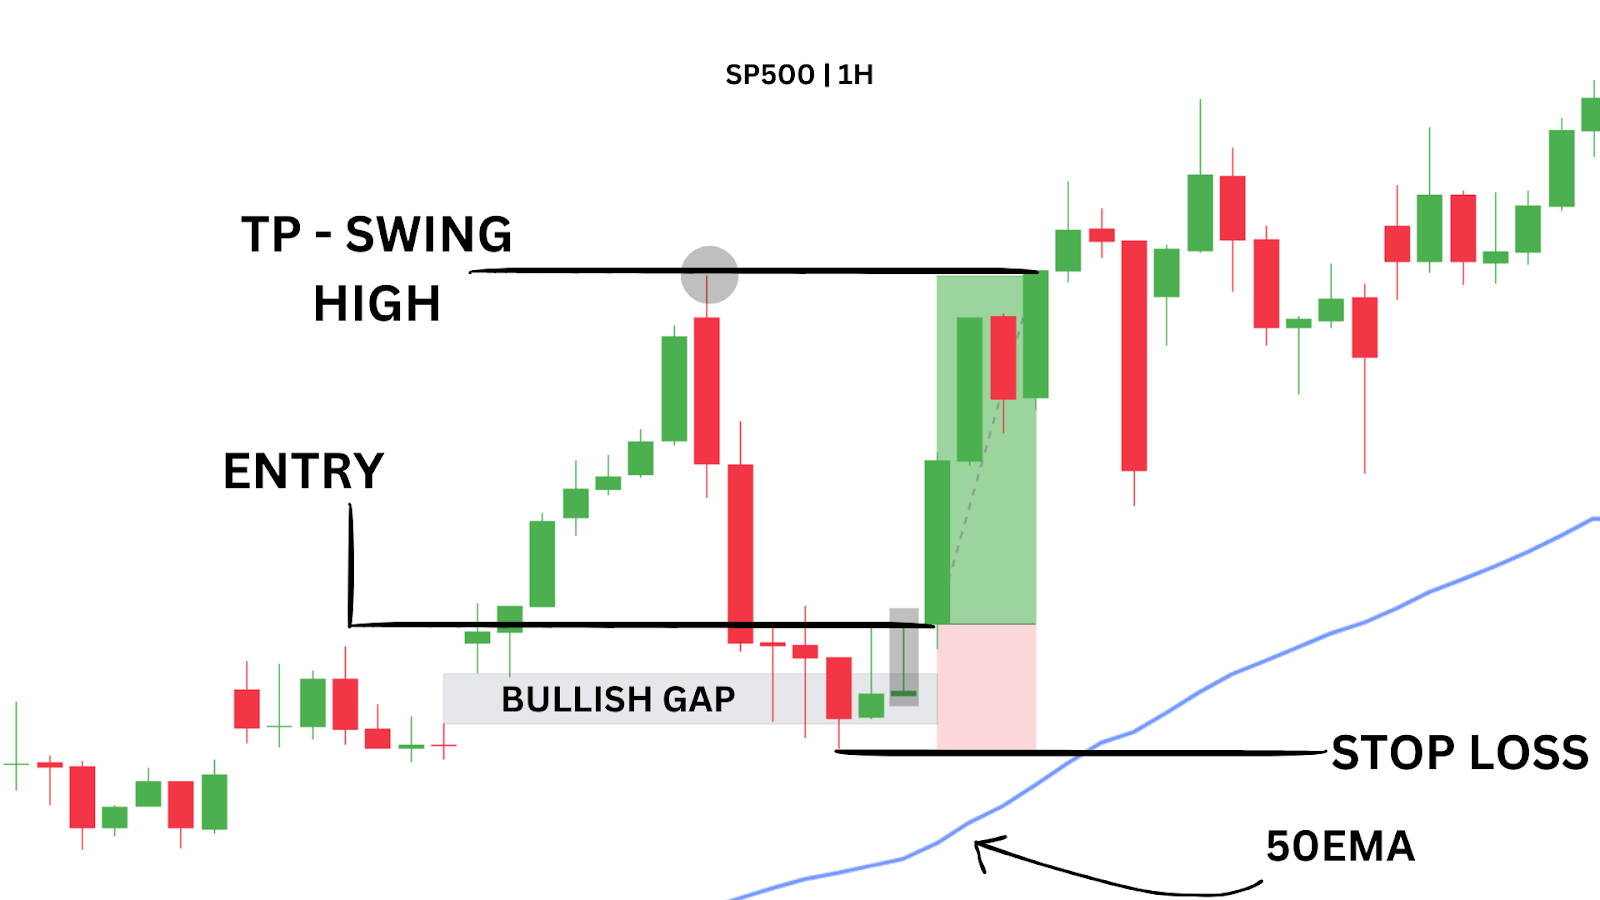
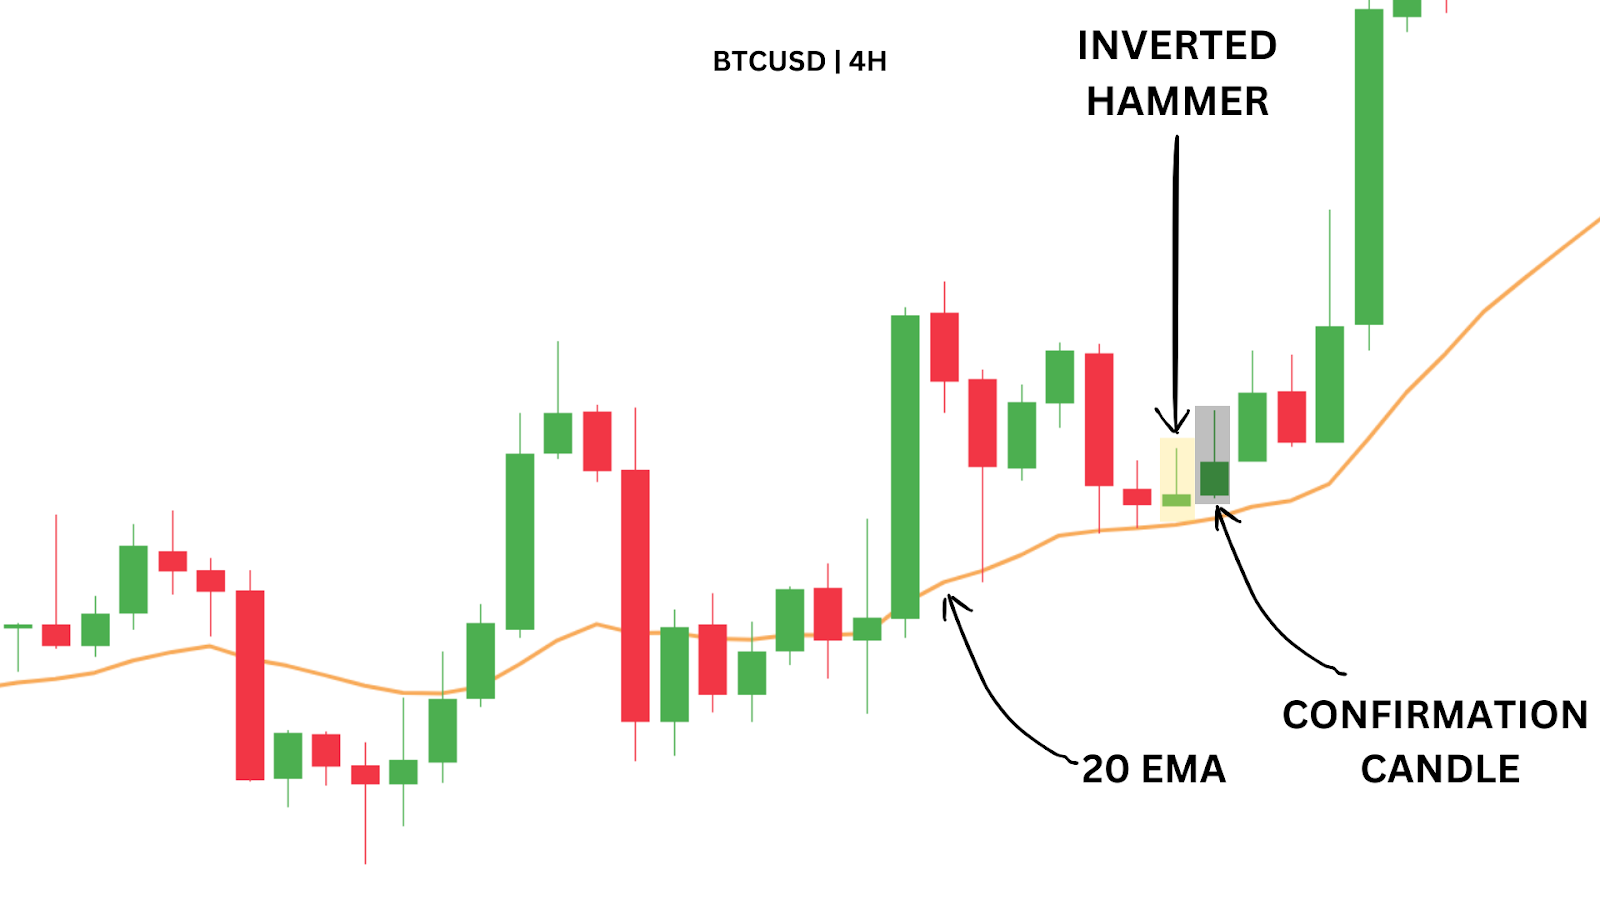
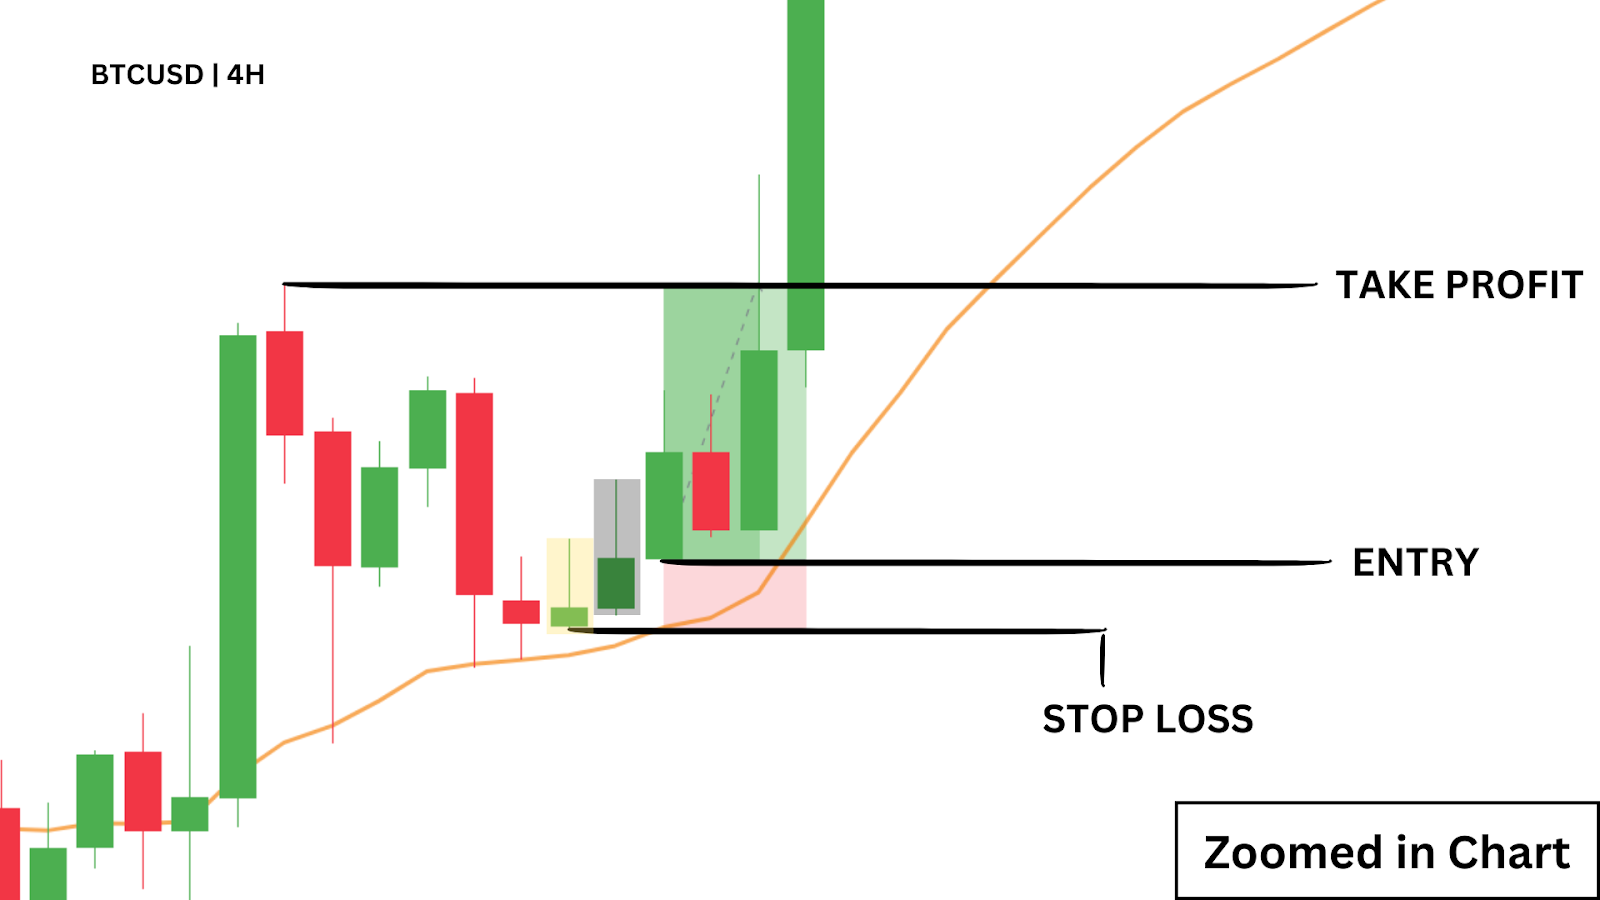
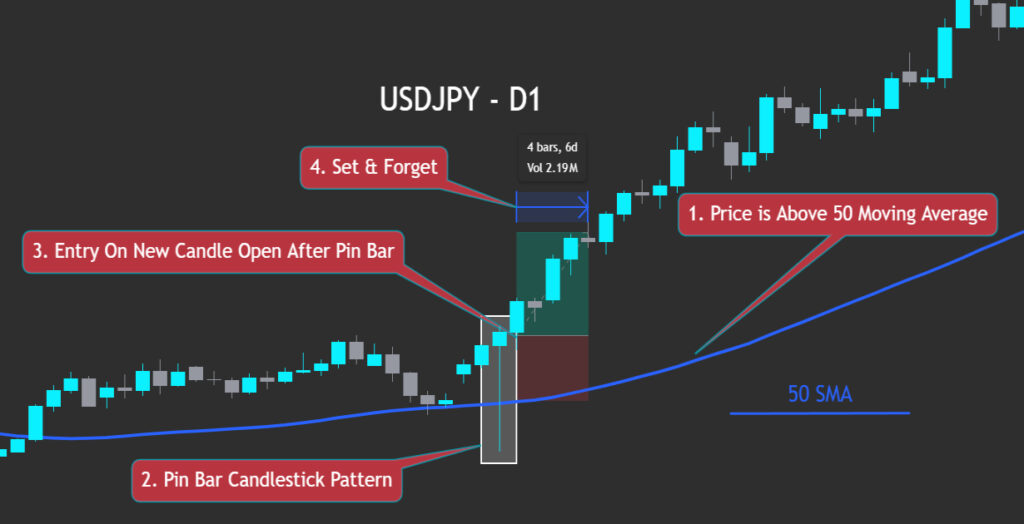
In a clear up‑trend—price above the 50 SMA—you might wait for a bullish pin‑bar or engulfing candle as a continuation signal. Buy on the next candle’s open, set your stop‑loss just below the 50 SMA, and define your take‑profit per your risk/reward plan. Then “set and forget”—let the trade run without mid‑trade edits.

Building Risk Control into Your ‘Set and Forget’ Trade

Effective risk management is critical in Set and Forget trading, especially since you’re not monitoring trades in real-time. Every decision must be precise and pre-planned.

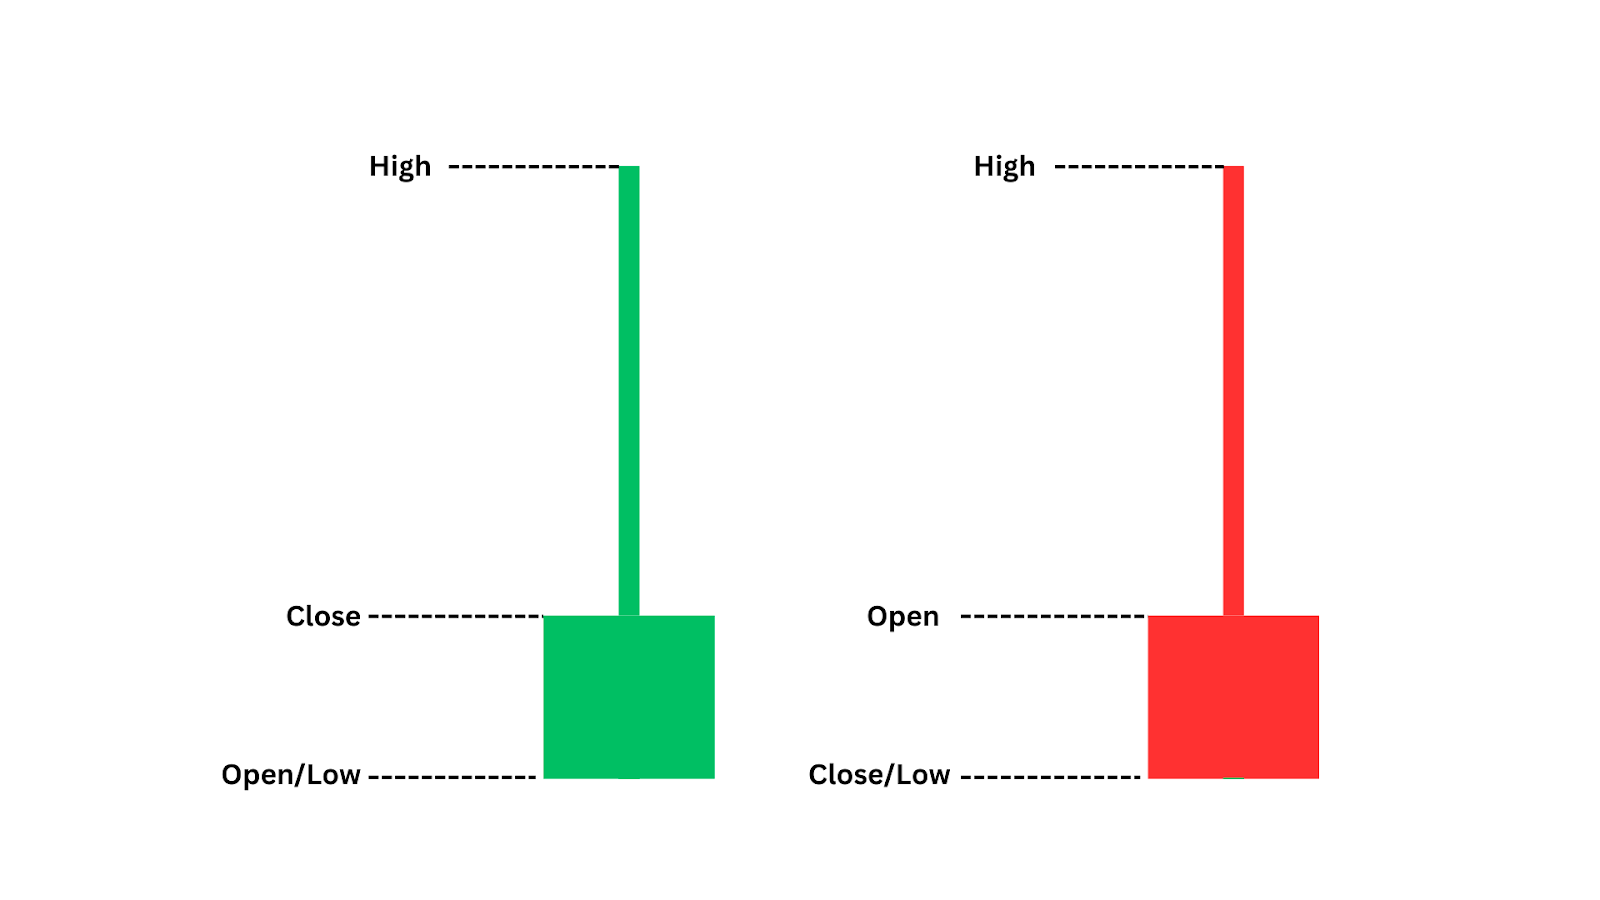
Stop-Loss and Take-Profit Placement

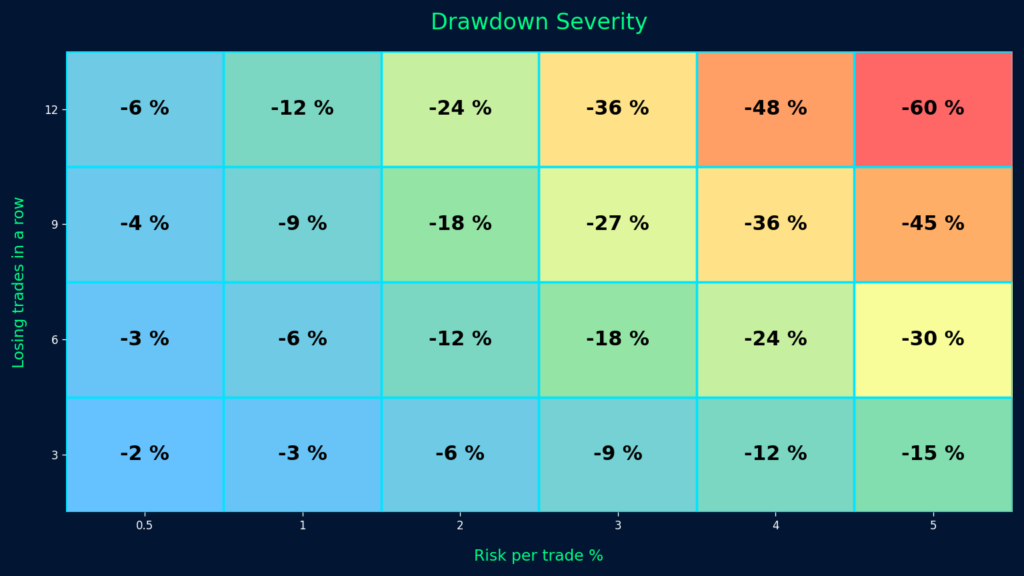
Your stop-loss and take-profit levels should be based on sound technical analysis — such as market structure, recent volatility, or key price zones. Avoid placing them based on emotion or arbitrary profit targets that ignore market conditions. Poorly placed exits can cause premature trade closures, large drawdowns, or even risk triggering a margin call in fast-moving conditions. Rule-based exits are essential.
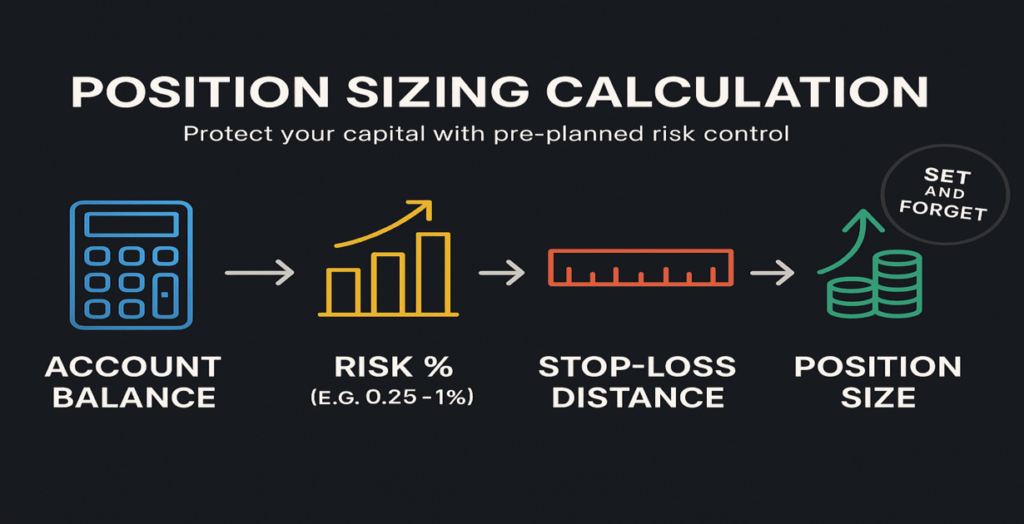
Position Sizing

Before placing a trade, calculate your position size to ensure the potential loss is only a small percentage of your equity, helping maintain long-term capital preservation.
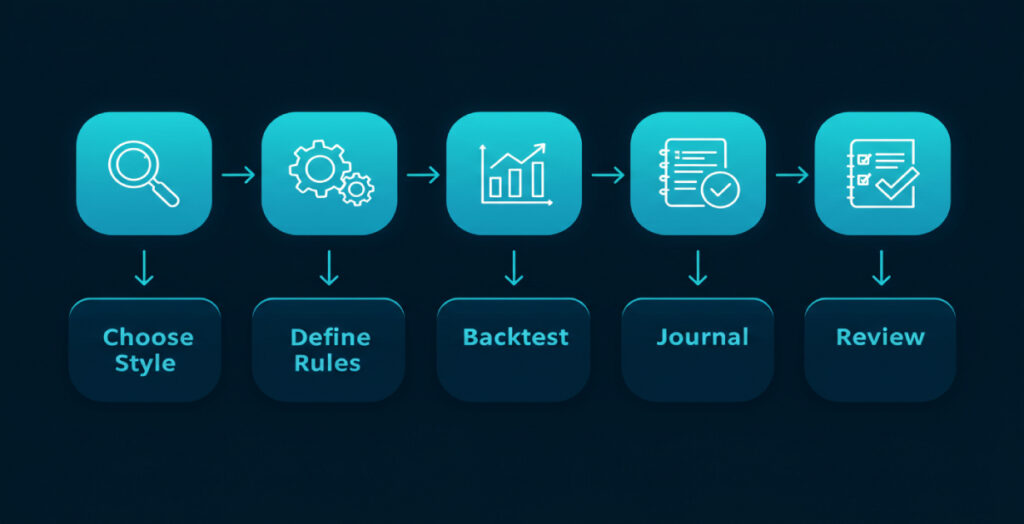
Backtesting

Always backtest your strategy before going live. This allows you to see how successful your strategy is across different market conditions and trading strategies. Set and Forget relies on trusting the plan — and that trust is built through data.

Market Suitability

Set and Forget works best in clean, trending environments — especially in the forex market, where structure and momentum can support clear setups.

It’s less effective in highly volatile, low-liquidity, or news-driven environments where sudden spikes or gaps can trigger stops unexpectedly. Always assess the trading environment before applying the strategy… adaptability matters just as much as discipline.

Limitations of Set and Forget Trading

While Set and Forget offers structure and discipline, it’s important to understand where it can fall short.

Rigidity

This strategy cannot adapt to real-time market developments. If major news or volatility hits after the trade is placed, the trade continues as planned, even if conditions have changed dramatically. This lack of flexibility is one of its key risks, especially in volatile stock or forex markets.

Missed Opportunities

A fixed take-profit like 1:2 RR means you might exit the trade while the move continues to trend higher. Additionally, if the market reverses just before reaching the take-profit, unrealised gains can disappear entirely. There’s no room to react once the trade is active.

All-or-Nothing Outcomes

Set and Forget trades usually reach either the stop-loss or the full target. Without options like scaling out or trailing stops, large potential gains can turn into full losses. The predefined setup controls the result — for better or worse.

Market Dependence

It performs best in directional markets. In choppy or low-volume conditions, small losses are common. Set and Forget requires the right market context to work effectively.

Optimising the Set and Forget Approach

While Set and Forget prioritises simplicity, you can enhance it without sacrificing core principles. Consider these predefined refinements to boost performance and flexibility:

  1. Flexible Rules (Pre-Planned):
    Establish dynamic management rules in advance, such as moving the stop-loss to breakeven after a certain risk-to-reward milestone (e.g., 1:1). This remains within the Set and Forget mindset.
  1. Trailing Stop-Loss:
    Define a trailing stop before trade execution. It automatically adjusts in your favour, locking in profits while capturing larger moves without manual intervention.
  1. Multiple Targets:
    Plan exits at several predefined levels. For instance, close half the trade at the first target, adjust stop-loss to breakeven and then let the remainder run to the next target.
  1. Contextual Analysis:
    Enhance entry accuracy using top-down analysis—from higher timeframes for broader trends to lower timeframes for precise entries—while preserving hands-off execution.
  1. Trade Alerts:
    Set up automated alerts that notify you as the price approaches key levels. This eliminates constant chart monitoring, aligning perfectly with the Set and Forget approach.

Set and Forget in Prop Trading

Prop firm challenges and funded accounts require strict adherence to predefined rules. Here’s how Set and Forget fits into that environment:

Master Market Level Identification:

Identify precise price levels for entries, stops, and take-profits. These must align with the structure, profit targets, and drawdown limits.

Plan Risk in Advance:

Calculate position size so a loss stays within firm drawdown limits. Avoid relying on manual intervention.

Use a Backtested Strategy with Edge:

Set and Forget only works in prop trading if it’s a proven, profitable strategy. Backtest rigorously to confirm your risk/reward aligns with firm rules and timelines.

Monitor Performance and Rule Compliance:

Track metrics like win rate and average risk-to-reward over time. Confirm that your strategy not only meets your trading edge but also complies with the firm’s rules at every stage — from challenge to funded account.

Trading During Economic News:

In a Nutshell…

Set and Forget trading is a structured approach that balances strategic planning with psychological discipline. Defining trade parameters before execution — including entry, stop-loss, and take-profit — and avoiding mid-trade adjustments, help reduce emotional errors and support time efficiency. For many forex traders, this simplicity and hands-off nature are highly appealing for taking advantage of structured trade setups.

That said, it’s not a universal solution. This method may not suit all traders, especially forex traders using reactive, high-frequency strategies, or market conditions, particularly in choppy or highly reactive environments. But in structured or trending markets — especially swing or position trading — it works well.

Its strengths lie in removing emotional interference, managing time constraints, and encouraging objective, rule-based execution. However, success depends on several key factors: trading skills, strong market analysis, well-calculated position sizing, disciplined risk management, and consistent review of trade outcomes.

When applied carefully, it supports a sustainable, logic-based trading process.

Mastering the Inverted Hammer: A Trader’s Guide to Spotting Reversals

Understanding candlestick patterns is crucial for traders who want to spot potential reversals and shifts. The Inverted Hammer, a powerful bullish reversal signal, can provide key insights at the end of a downtrend. Here’s what you need to know to recognise and trade it effectively.

What is an Inverted Hammer Candlestick?

An inverted hammer candlestick is a bullish reversal pattern that typically appears at the bottom of a downtrend, signalling potential upward movement. 

It has a small body at the lower end of the candle range and a long upper wick, which shows that buyers tried to push prices higher. This buying interest suggests a potential trend reversal, even in a bearish environment.

The inverted hammer reflects buyers testing higher prices, hinting at a possible shift in momentum.

Examples of Inverted Hammer Candlestick Patterns

Not all inverted hammers are equally reliable. The pattern’s strength varies based on timeframe and market conditions:

  • Higher Timeframes: Daily or weekly inverted hammers are more reliable than those on 15-minute or 1-hour charts.
  • Market Context: Patterns near strong support levels or after a defined downtrend hold more weight than those in choppy markets.
  • Additional Confirmations: Using other indicators (e.g., RSI divergence, moving average crossovers) can validate the signal.

Key characteristics that enhance the inverted hammer’s reversal potential include:

  • Appears at Key Support Levels – Indicates buyers stepping in at a critical point, increasing the chances of reversal.
  • Follows a Prolonged Downtrend – Signals potential exhaustion in bearish momentum, making the reversal more credible.
  • High Trading Volume – Shows stronger buying interest, reinforcing the likelihood of a trend reversal.
  • Confluence with Other Indicators – Aligning with bullish indicators like RSI adds credibility.
  • Minimal Lower Wick – Indicates that buyers quickly pushed prices higher with little initial selling pressure.

Let’s explore a real-life example of this pattern in action to see how it can be effectively utilised in trading setups.

Case Study: SP500 Inverted Hammer Candlestick Pattern

On July 11, 2024, the 1-hour SP500 chart provided an excellent example of an inverted hammer in action. After a strong bullish rally, price returned to fill a gap created by prior momentum. 

During this pullback, an inverted hammer formed, followed by another smaller inverted hammer. These candlesticks indicated that buyers were testing the waters and attempting to reclaim control.

With the price positioned above the 50 EMA which was still firmly angled upwards, bullish continuation is likely. The 50 EMA could also be a great place to put stop losses, as will be discussed in trading method one. 

The market then resumed its upward trajectory with a robust move, showcasing how this pattern can act as an early signal for a bullish reversal.

How Do You Trade Inverted Hammer Candlesticks?

The inverted hammer pattern offers versatile trading opportunities, especially when used with additional confluences. Here are three effective methods for trading it.

Method One: Buy at Support

One effective strategy for trading the inverted hammer is to look for it forming near a significant support level, especially when a previous resistance has flipped into support. This support is our bullish gap that was left behind by price action. 

This method leverages the strength of price action combined with the confirmation provided by the pattern itself. 

In our previously mentioned SP500 case study from July 11, 2024, the inverted hammer appeared during a pullback to a key support level at a bullish gap. Market gaps often act as pivotal support or resistance levels when revisited. Here, a confirmation candle – a bullish close following the inverted hammer—validated that buyers were stepping in. 

Traders can place their stop-loss below the most recent swing low (as shown in the image) or the 50 EMA for a more conservative approach, while targeting the most recent swing high for a 1:2.8 risk-to-reward ratio.

Trading Strategy Summary:

  • Entry Point: Market enter after a bullish confirmation candle forms after our inverted hammer.
  • Stop-Loss: Below the recent swing low or the 50 EMA for a more conservative trade.
  • Profit Target: Recent swing high.
PROS: Strong confluence with support levels, better risk management with tighter stop-losses.
CONS: Requires patience for confirmation, may miss opportunities in fast-moving markets.

Method Two: Buy During a Pullback with EMA

For this method, traders wait for the price to pull back to a key EMA (e.g., 20 or 50 EMA) and look for the formation of an inverted hammer as a bullish signal. For this method to work, price must be ABOVE the EMA – this approach combines the support provided by the EMA with the bullish reversal implications of the pattern. 

On August 23, 2024, the 4-hour Bitcoin chart showed an inverted hammer forming at the 20 EMA, which had recently flipped into support. 

After a bullish confirmation candle followed, traders could enter the market, set a stop-loss just below the inverted hammer’s low, and target the most recent swing high for a 1:4 risk-to-reward ratio trade. 

Trading Strategy Summary:

  • Entry Point: Enter after a bullish confirmation candle following the inverted hammer.
  • Stop-Loss: Below the inverted hammer’s low.
  • Profit Target: Recent swing high.
PROS: High-probability setups when combined with EMA support, effective in trending markets.
CONS: Relies on EMA support, which may not always hold in choppy markets.

Method Three: Inverted Hammer with Bullish RSI Divergence

Combining the inverted hammer pattern with RSI divergence can strengthen the reversal signal.

RSI divergence occurs when the price makes a new low, but the RSI fails to do the same, indicating weakening bearish momentum. 

On October 12, 2022, the SP500 daily chart featured bullish RSI divergence along with an inverted hammer at the bottom of a downtrend. 

This combination was confirmed by a subsequent bullish engulfing candle, providing a confirmation of a strong incoming bullish reversal. Here in our example, since the bullish engulfing candle was such an impulsive move, it’s likely that price would experience some sort of a retracement.

Notice how the retracement does not close under the closing price of the inverted hammer, which allows us to enter a comfortable trade with 1.27 reward-to-risk ratio.

Trading Strategy Summary:

  • Entry Point: Market enter after a confirmation candle has followed our inverted hammer, which in this case was our bullish engulfing candlestick. You can choose to wait for a retracement or directly enter.
  • Stop-Loss: Below the recent low.
  • Profit Target: Recent swing high.
PROS:  Provides additional confirmation through RSI, reducing false signals, reliable high-probability setups.
CONS: Requires understanding of RSI analysis, setups can be less frequent.

Advantages and Disadvantages of Trading the Inverted Hammer Pattern

The inverted hammer candlestick pattern is a valuable tool for traders, especially when identifying potential bullish reversals. However, like any trading pattern, it has its strengths and limitations. Here’s a breakdown of what makes this pattern useful – and where it can fall short.

Advantages:

  • High Probability Reversal Signal: When it appears in the right context, such as near a key support level after a prolonged downtrend, the inverted hammer can serve as a reliable signal for a potential bullish reversal.
  • Versatility Across Timeframes: The inverted hammer pattern works well on various timeframes, from intraday charts to weekly and monthly charts, making it accessible for both short-term and long-term traders.
  • Clear Visual Pattern: With its unique shape—a small body with a long upper shadow and little to no lower wick—the inverted hammer is easy for traders to spot on the charts, even for beginners.

Disadvantages:

  • Prone to False Signals in Choppy Markets: In markets that lack a clear trend, the inverted hammer can produce misleading signals, leading to potential losses if not confirmed by other indicators.
  • Requires Additional Confirmation: While it can indicate a potential reversal, the inverted hammer pattern often needs confirmation from other indicators, such as volume, RSI divergence, or EMAs, to improve accuracy and avoid premature entries.

Closing Thoughts and Key Notes

The inverted hammer candlestick pattern is a powerful tool for identifying potential bullish reversals, especially when it appears after a sustained downtrend or at a key support level. Its unique shape—a small body with a long upper shadow – signals that buyers are attempting to push prices higher, hinting at a possible shift in market sentiment.

While the inverted hammer is an effective pattern, it’s most reliable when combined with additional indicators, like RSI, moving averages, or support levels, to confirm the trend reversal. Practising good risk management, such as setting appropriate stop-loss levels, will further enhance the effectiveness of this pattern. Take advantage of our Max Lot Size Calculator today to improve your risk management.

Get Funded with FXIFY Today

At FXIFY™, we believe in empowering traders with the capital and resources they need to succeed. With our variety of evaluation phases and funding levels, you have the opportunity to access up to $400K in starting capital. Our performance splits go up to 90%, and we offer flexible add-ons to support your trading journey.

Join FXIFY™ today and put your trading knowledge to work with a funded account. Start with a challenge, prove your skills, and get instant access to your gains on demand—no delays, no hidden terms. 

Trade smart. Trade with FXIFY.

Purchase a challenge today!

FAQs

What is the Difference Between an Inverted Hammer and a Shooting Star?

The inverted hammer is a bullish reversal pattern that appears after a downtrend, while the shooting star is a bearish reversal pattern that appears after an uptrend. Both patterns have similar shapes but serve opposite functions based on their position within the trend.

Can the Inverted Hammer Pattern be Used on All Timeframes?

Yes, the inverted hammer pattern can be used across various timeframes, but it’s generally more reliable on higher timeframes like daily or weekly charts. Lower timeframes may produce more false signals due to market noise.

How Do I Confirm an Inverted Hammer Pattern?

Look for additional confirmation from other indicators or technical analysis tools. For example, a nearby support level, volume increase, or bullish indicators like RSI divergence can help confirm the pattern and improve its reliability.

Is the Inverted Hammer Pattern Reliable on Its Own?

While it can provide a strong reversal signal, the inverted hammer is best used with other forms of technical analysis to improve accuracy. Confirmation from indicators like moving averages, volume, or support levels can strengthen the signal and reduce the likelihood of false entries.

What Are Common Mistakes When Trading the Inverted Hammer Pattern?

Common mistakes include trading the pattern in isolation without confirmation, ignoring market context, and using it in choppy or range-bound markets where false signals are more likely. To enhance accuracy, always look for confluence with other indicators and set appropriate stop-loss levels.

Why Most Traders Fail (And How to Avoid Their Mistakes)

While trading offers the dream of financial freedom and the excitement of testing your ideas against the markets (stocks, forex, futures), the reality is often challenging. Understanding why most traders fail, especially when starting out, is the critical first step towards success.

However, the hard truth is that most traders fail to achieve consistent profits. Understanding why most traders fail is the crucial first step to improving your chances. Many traders lose money when they start trading. 

This article explores the common saying that “90% of traders fail,” breaks down the key common pitfalls and same mistakes that cause traders to lose money, and provides practical steps you can take. Whether you are a new or experienced trader, these lessons can help you trade better and longer.

90% of Traders Fail: Myth or Fact?

You often hear that nine out of ten traders lose money. Recent official data show just how steep the odds can be:

  • A July 2024 press release from India’s Securities and Exchange Board (SEBI) found that 70 % of individual intraday traders in the equity cash segment incurred net losses in FY 2022 (SEBI press release 13/2024).
  • An updated SEBI analysis published in September 2024 revealed that 93 % of individual traders in the equity futures & options segment suffered losses between FY 2022 and FY 2024 (SEBI press release 22/2024).

Even if the exact percentages vary by market and product, the clear message from multiple regulators is that the majority of retail participants do not turn a profit.

Although 90% is an estimate, the evidence is clear: the vast majority of retail traders do lose money. This is often why traders fail. For prop firm candidates aiming to pass challenges, these statistics are even more important. Passing requires consistency and discipline that many retail traders don’t maintain.

It’s also vital to know that success in trading isn’t instant. Even profitable traders face periods without gains or periods where their account value drops (drawdowns). The key difference is how successful traders manage these challenges.

So, why do traders fail so often? The reasons usually fall into five main categories.

Top Reasons Traders Fail and Lose Money

1. Unrealistic Goals

One of the biggest common pitfalls for a new trader is believing trading is a fast way to make money or get rich quickly with little effort. Social media often shows exaggerated success stories, creating unrealistic expectations. This tempts new traders (and sometimes even experienced traders) to use position sizes that are too large or chase daily profit targets that even professional traders would find difficult to manage.

Overconfidence leads to taking too much risk. When a losing streak inevitably happens, the trading account might not survive. These unrealistic expectations are a primary reason why most traders fail.

“The goal of a successful trader is to make the best trades. Money is secondary.” 
– Dr. Alexander Elder

How to manage expectations:

  • Redefine success: Focus on steady growth month after month, not a risky goal like “doubling my money quickly.” Aim for consistent profits over time.
  • Use a trading journal: Focus on how well you followed your trading plan. Did you stick to your rules? Was your position sizing correct?
  • Set sensible benchmarks: Many professional traders aim for single-digit percentage returns per month with low risk. If that’s good enough for them, it should be for you too.

Remember, successful trading builds over time. Focus on creating good habits rather than chasing huge short-term gains. This builds a foundation for potential long-term rewards.

2. Poor Risk Management

Risk management is your set of rules to protect your capital when the market goes against you. Ignoring this principle is the fastest way to join the 90% of traders who lose money. Managing risk well is essential for survival.

  • The 1% rule: Never risk more than 1% of your trading capital on any single trade. This prevents a few losing trades from causing substantial losses.
  • Position sizing: Calculate your trade size based on your stop-loss distance and the percentage of risk you’ve chosen per trade, not just a feeling. Proper position sizing should always reflect both your account balance and your risk tolerance.
  • Stop-loss orders: Decide your exit point before you enter a trade. This removes emotional guesswork when under pressure. This should be part of every trading plan.

Prop firms place a strong emphasis on risk management — and for good reason. Their evaluation models are designed to protect both the firm’s capital and help traders develop discipline. At FXIFY, the daily and maximum drawdown limits act as structured safeguards, similar to those used in institutional trading environments.

Rather than being obstacles, these limits are best viewed as built-in accountability tools. They encourage traders to manage risk proactively and stay within the boundaries of a sound plan. Traders who succeed long-term typically operate well inside these limits — developing strong trading habits in the long run.

While all prop firms implement risk controls, FXIFY’s specific structure reflects a broader commitment to helping traders build professional habits. If you’re not yet familiar with how daily and overall drawdowns differ — and why they matter — it’s worth reviewing our guide on the different types of drawdowns in prop trading.

3. Lack of a Solid Trading Strategy and Plan

A trading strategy defines your edge—what you trade, why you trade it (e.g., based on technical or fundamental analysis), and the general conditions for entry/exit. A trading plan details the exact rules for executing your trading strategy: entry signals, exit signals (stop-loss and take-profit), position sizing, and risk management rules.

Many beginners jump between different indicators and trading methods every week, often without doing their research. Without enough trades (sample size) using one strategy, they can’t tell if their results are due to luck or a real edge. This leads to frustration and losses, another reason traders fail.

Build or adopt one core trading strategy and master its execution through a detailed trading plan:

  • Choose a trading style that fits your personality and schedule (e.g., scalping, day trading, swing trading, position trading). Suitable for stocks, forex, etc.
  • Define clear entry rules in your trading plan (e.g., trend alignment + specific price pattern).
  • Test your trading strategy using historical data (back-testing) or a demo account (forward-testing).
  • Record every trade in your trading journal and review your performance regularly.

Commit to one strategy and refine your trading plan. This builds the confidence needed for disciplined trading decisions under real market conditions.

4. Emotional Trading Decisions

Markets trigger strong human emotions: fear, greed, hope, and disbelief. Trading psychology plays a huge role. Making trading decisions based on these emotions leads to common errors and is a major reason traders fail.

  • Fear: Closing winning trades too early because you fear giving back profits.
  • Greed: Adding to trades without a good reason, or risking more money after a winning streak.
  • Revenge trading: Increasing trade size to try and recover from losing trades quickly. This often leads to bigger losses.
  • Confirmation bias: Only looking for information that supports your current trade, ignoring warning signs.

Keeping a trading journal that notes your emotional state alongside your trades helps identify these destructive patterns. Reviewing your journal helps build self-awareness and change bad habits, improving your trading psychology. Comparing your results to other traders isn’t helpful; focus on your process. Avoid making the same mistakes repeatedly.

Prop firm evaluations add pressure. Using tools like FXIFY’s dashboard to track performance objectively helps you stay grounded when emotions rise, leading to better trading decisions.

Managing emotions isn’t about feeling nothing; it’s about recognising emotions and having pre-set rules in your trading plan to prevent impulsive actions. Acting emotionally can have a strong negative effect.

5. Ignoring Transaction Costs and Market Conditions

Transaction costs – spreads, commissions, and slippage (price differences in execution) – reduce your returns. Active traders, especially day traders scalping for small profits, are heavily affected by transaction costs on every trade. Swing traders, on the other hand, would feel these costs less. Understanding why spreads and commissions matter in forex trading is crucial here.

Also, market conditions change. A strategy designed for quiet, range-bound markets will likely fail during strong trends or high volatility. News events can cause sudden market changes that hit stop-losses. There are many variables to consider.

Practical tips:

  • Know your total transaction cost per trade.
  • Trade during the most liquid market sessions for your chosen instrument (like stocks or forex pairs) to get tighter spreads.
  • Adjust your position size or don’t trade if current market conditions don’t suit your trading strategy.

FXIFY offers RAW trading accounts (0.0 spread + round-turn commissions) and All-In trading accounts (tight spread with no commissions). This lets traders choose the transaction cost structure that best fits their trading method.

Successful traders adapt to market changes and manage transaction costs. They don’t stubbornly trade setups that aren’t working in the current market conditions.

How Trading with a Prop Firm Can Help You Manage Risk & Emotions

A good prop firm provides a structure that helps improve risk management and emotional discipline, boosting a trader’s ability:

  • Clear risk rules: FXIFY’s drawdown limits and leverage settings foster proper risk management and prevent the kind of major losses that end trading careers.
  • Capital access: Starting with funded accounts of up to US $400,000, traders are incentivised to target realistic percentage returns, rather than overrisking on small personal accounts to make money. Exploring the differences between funded trading and retail trading can help clarify which path is suitable.
  • Unlimited trading days: Removes the time pressure that causes many traders to take poor trades.
  • Performance data: The FXIFY dashboard provides objective feedback on your trading, helping manage trading psychology.

Trading with a firm like FXIFY also connects you with other traders, resources, and a professional environment, helping you become a good trader and eventually a successful trader. It encourages treating trading like a business.

If you can succeed within this structured environment, moving towards becoming a full-time professional trader is a more achievable goal.

Key Takeaways: Avoiding Why Most Traders Fail

  • Most traders fail due to poor risk management, inconsistent trading strategies/trading plans, and emotional trading decisions. These are key reasons traders lose money.
  • Set realistic goals: Judge success by following your trading plan, not just by profits.
  • Manage risk carefully: Use appropriate risk and stop-losses, and calculated position sizing in your trading plan. Avoid overleveraging.
  • Use a trading journal: Track your progress and mistakes to refine your trading edge.
  • Adapt: Adjust for transaction costs and changing market conditions. Choose account types and trading styles wisely.
  • Consider prop firms: Consider prop firms: Firms like FXIFY provide structure and access to capital, removing the emotional pressure to overleverage. With funded accounts, even modest risk can lead to meaningful returns — helping traders stay rational, not reckless.

Remember, trading is more like long-term investing in your skills than a get-rich-quickly scheme. Build sustainable habits.

Conclusion

Trading can be rewarding, but success requires more than strategy. Most traders fail due to poor risk control, emotional decisions, and unrealistic goals. By focusing on discipline, a clear plan, and adapting to changing conditions, you give yourself the best chance to succeed.

Approach trading like a long-term skill, not a quick win. Track your performance, manage risk, and stay focused on process over outcome. With the right habits and structure — including support from a prop firm — consistent progress is possible.

MACD and RSI Divergence Strategy to Trade Forex and Gold

Have you ever thought about how you could improve the quality of your trades? This guide aims to empower traders with a comprehensive strategy that uses the MACD and RSI divergence to help you anticipate and confirm the likelihood of a market reversal.

As opposed to fundamental trading strategies that rely on economic data or revenue growth reports. This approach focuses on technical analysis by examining price trends and signals directly on the price chart. This method is simple to use, even for manual traders, and works well with other tools or automated systems.

Overview of the Strategy

This strategy builds on the complementary strengths of MACD and RSI to anticipate market reversals with precision. While MACD highlights momentum and trend direction, RSI excels at spotting overbought and oversold conditions, especially when divergence appears between price and indicator.

By combining these tools, traders can detect potential turning points before they become obvious in price action. RSI divergence acts as an early signal that a reversal may be underway, while MACD confirms the broader momentum shift.

This layered confirmation increases the probability of accurate entries and reduces the chances of false signals, making it a powerful tool in both Forex and Gold markets.

The Logic Behind the Strategy

This strategy leverages RSI divergence and MACD momentum shifts to anticipate market reversals before or as they occur. When the RSI indicates divergence, and then the MACD line crosses the signal line, this confluence creates a high-probability trading signal. 

This approach contrasts with other technical indicators and fundamental analysis, providing a balanced view that captures both historical price action and current market sentiment.

Indicators Settings

IndicatorComponentDescription
MACDMACD LineDifference between 12-period EMA and 26-period EMA
Signal Line9-period EMA of the MACD Line
HistogramVisual representation of the distance between MACD Line and Signal Line
RSIRSI ValueMomentum indicator scaled from 0 to 100
OverboughtRSI > 70, may signal a potential reversal or pullback
OversoldRSI < 30, may indicate a potential rebound or trend shift
DivergenceWhen price and RSI move in opposite directions, signaling possible reversal

The combination of these indicators can produce useful trading signals, offering a structured approach that doesn’t rely on complex modelling techniques.

Best Assets to Trade

This strategy shines on:

  • Gold (XAU/USD)
  • Major Forex pairs such as EUR/USD, GBP/USD, and USD/JPY

These financial instruments frequently exhibit clear price trends and volatility, ideal for spotting divergence patterns that may signal a downward trend reversal or a burst of buying momentum.

Trading Approach & Timeframes

  • Scalping: Ideal for short-term trades on the 5-minute to 15-minute charts.
  • Day Trading: Best applied on 1-hour to 4-hour charts.
  • Swing Trading: Suitable for longer-term positions on daily to weekly charts.

This flexible approach complements both technical trading and fundamental analysis, although it primarily focuses on capturing short- to medium-term price trends.

What is the MACD Indicator?

The MACD is a lagging indicator that captures momentum by comparing two exponential moving averages. Its visual simplicity is enhanced by the two lines—the MACD line and the Signal line—which help traders quickly identify changes in trend direction.

Key Components of MACD

  • MACD Line: The difference between the 12 EMA and the 26 EMA. It indicates the direction of the trend and provides early warnings when the momentum shifts.
  • Signal Line: A 9-period EMA of the MACD Line. Crosses between the MACD line and the Signal line—often referred to as MACD line crossover—are key signals for trade entries and exits.
  • Histogram: Represents the gap between the MACD Line and the Signal Line. A widening histogram can suggest strengthening trends, while a narrowing one might indicate a reversal is imminent.
  • Zero Line: A central reference point indicating neutral momentum. When the MACD Line or histogram is above, it signals bullish momentum is present. When they’re below, bearish momentum is dominant.

How We Use MACD

MACD crossovers serve as key confirmation signals to validate potential trend reversals.

  • MACD Line Crossovers: When the MACD Line crosses above the Signal Line, it can confirm a bullish shift in momentum. A cross below the Signal Line, on the other hand, may confirm a bearish move.
  • Zero Line Crossovers: A crossover above the Zero Line reinforces bullish momentum, while a move below it can signal a strengthening bearish trend.

These crossovers add conviction to the trade setup, especially when they align with RSI divergence.

What is the RSI Indicator?

The RSI is a momentum oscillator that measures the speed and magnitude of recent price movements. While it is technically a lagging indicator, traders often use it in a predictive way to identify overbought or oversold conditions that may signal potential trend reversals.

RSI chart with key levels labelled (30, 50, 70)

Key Components of RSI

  • Overbought or Oversold Conditions: The RSI typically fluctuates between 0 and 100. Readings above 70 suggest overbought conditions, while those below 30 indicate oversold conditions.
  • Divergence: Divergence occurs when the price chart and RSI do not align—this can be an early warning of a trend reversal, often seen in both bullish and bearish setups.

Divergence Cheat Sheet:

How We Use RSI

We primarily rely on identifying regular RSI divergences as our main signal for anticipating potential reversals.

Regular divergences occur when the price and RSI move in opposite directions, highlighting a weakening momentum that often precedes trend reversals.

  • Trade Confirmation: Regular RSI divergence, coupled with MACD crossovers or a weakening MACD histogram, significantly enhances the reliability of trade signals.
  • Precision in Entries: When regular RSI divergence is detected in overbought or oversold territories (RSI above 70 or below 30), it provides additional confirmation, helping to reduce false signals. This nuance distinguishes our approach from strategies that rely solely on other technical indicators.

Strategy Breakdown

This section provides a detailed breakdown of how to combine MACD and RSI divergence for effective trade setups.

What to Look For

  1. RSI Divergence: Look for mismatches between the price chart and the MACD/RSI indicators. For example, if the price forms a new low but the RSI forms a higher low, it could be a sign of bullish divergence.
  2. MACD Confirmation: A crossover where the MACD line crosses above the Signal line, or even crosses the zero line, confirms the reversal.
  3. RSI Confirmation: Checking that RSI is near or below 30 for long setups—or above 70 for shorts—can strengthen the signal generated by the MACD, potentially increasing the probability of a reversal signal.

These steps ensure that the trading signals produced are robust, minimising the risk of a sudden decline that can occur in volatile markets.

Entry and Exit Rules

A disciplined approach is key to successful trading. Below are the detailed entry and exit rules that form the backbone of this strategy.

Entry Rules

Long Trade Setup:

  1. Price Action: The price forms a new low while the RSI forms higher lows — a classic regular bullish divergence.
  2. RSI Confirmation (Optional): RSI being in oversold territory (below 30) can add confidence to the setup but isn’t required.
  3. MACD Signal: A bullish MACD crossover (MACD line crossing above the signal line) confirms the potential reversal.
  4. Additional Checks: Look for supporting candlestick patterns (e.g., bullish engulfing or hammer) or other technical confirmations, such as trendline breaks or volume spikes, to strengthen the setup.

Example Bullish Entry:

Short Trade Setup:

  1. Price Action: The price forms a new high while the RSI and MACD form lower highs — regular bearish divergence.
  2. RSI Confirmation (Optional): RSI being in overbought territory (above 70) may strengthen the case for a reversal but isn’t essential.
  3. MACD Signal: A bearish MACD crossover (MACD line crossing below the signal line) supports the short setup.
    Additional Checks: Watch for bearish candlestick patterns (e.g., shooting star or bearish engulfing) or other technical confirmations like resistance zones or trendline rejections to validate the short idea.

Example Bearish Entry:

Exit Rules

Exiting a trade is just as important as entering — but how and when you exit can vary based on your trading style and objectives. Here are a few common methods traders use to manage exits:

  • MACD Crossover Against Trade Direction: Some traders choose to exit when the MACD crosses in the opposite direction, signalling a potential momentum shift.
  • RSI Levels as Profit Targets: For long trades, reaching overbought levels (above 70) can suggest it’s time to take profit; for shorts, an oversold reading (below 30) may prompt an exit.
  • Trailing Stop-Loss: Adjusting your stop-loss as the trade moves in your favour can help lock in gains while allowing room for the trade to develop.

Example Bearish Exit:

Note: In this example, we minimised losses by promptly closing the trade at the MACD exit crossover signal, rather than waiting for the stop-loss to be triggered. 

These techniques can be used individually or in combination, depending on your risk tolerance and strategy. The key is to have a clear exit plan that aligns with your trade goals, helping you avoid emotional decisions or overtrading.

Additional Strategy Considerations

While the core of the strategy is robust, there are additional points to note for optimal implementation.

Best Trading Sessions

  • Forex: The London–New York overlap offers high liquidity and frequent price movements, making it ideal for trend-based strategies.
  • Gold: The New York session brings heightened volatility, creating favourable conditions for spotting divergence signals.

When NOT to Apply This Strategy

  • Low Volatility Periods: The indicators may produce false signals in markets lacking sufficient momentum.
  • Choppy, Range-bound Markets: In such scenarios, relying on historical price action may lead to misinterpreting divergence signals.
  • Overreliance on Other Technical Indicators: While integrating other technical indicators can be beneficial, ensure they complement rather than conflict with MACD and RSI signals.

For traders using automated trading systems or advanced computer modelling techniques, these considerations ensure the strategy remains effective and adaptable.

Benefits of This Strategy

There are several key benefits to incorporating the MACD and RSI divergence strategy into your trading plan:

  • High Probability Signals: Combining divergence from both MACD and RSI enhances the reliability of entry and exit signals.
  • Multiple Setups: The strategy is well-suited for a variety of timeframes, allowing for multiple setups per week. This is particularly advantageous for those seeking to capitalise on price trends in volatile financial markets.
  • Favourable Risk-to-Reward Ratios: With a targeted risk-to-reward ratio of at least 1:2, traders can maximise profits while keeping losses manageable.
  • Versatility Across Instruments: Whether trading Forex pairs or Gold, this strategy has broad applicability.
  • Support for Both Discretionary and Automated Trading: The clear rules allow for a fixed plan in discretionary trading while also lending themselves to coding in automated trading systems.

By adhering to a strict trading plan that incorporates these benefits, traders can experience steady revenue growth over time.

Common Mistakes to Avoid

While the strategy is powerful, some pitfalls can undermine its effectiveness:

  • Not Considering Higher Timeframes: Always consider the long-term trend to avoid being misled by short-term fluctuations.
  • Entering Trades Without Indicator Alignment: Ensure that both MACD and RSI agree. Failure to do so may result in taking trades based on misleading signals.
  • Neglecting Stop-Loss Orders: A critical component of risk management is placing stop-loss orders to protect your account balance. This discipline prevents significant drawdowns.
  • Misinterpreting Divergence: Not every divergence is a reversal. Confirm divergence with additional evidence, such as MACD crossovers or significant shifts in buying momentum.

Adhering to these guidelines will help you avoid common errors and maintain a consistent trading style that aligns with both your risk tolerance and your broker’s requirements.

Prop Trading Position Sizing & Risk Management

For prop traders, risk management is not just a guideline—it’s a necessity. The following guidelines are not just recommendations but are intended to serve as a framework when developing your trading plan.

Risk Per Trade

Aim to risk between 0.25% and 0.50% of your account balance on each trade. For example, if you are trading on a prop challenge with a maximum drawdown limit of 6%, you must calculate how many consecutive losses you can sustain before risking your account. This strategy emphasises managing risk meticulously, ensuring that even a series of losing trades will not compromise your overall trading capital.

Stop-Loss Placement

  • Long Trades: Place your stop-loss just below the recent swing low.
  • Short Trades: Set your stop-loss just above the recent swing high.

Take-Profit Targets

Aim for a minimum 1:2 risk-to-reward ratio. This ratio helps ensure that even if not all trades hit their targets, the profitable ones will provide a net gain.

Risk Management Table

Account SizeXAU/USD Lot SizeUSD/JPY Lot Size
5,0000.050.25
10,0000.100.50
25,0000.251.25
50,0000.502.50
100,0001.005.00
200,0002.0010.00
400,0004.0020.00

The table above illustrates approximate position sizes for XAU/USD and USD/JPY pairs based on a 0.5% risk per trade and a 50-pip stop loss. These figures provide a practical baseline for aligning trade size with account equity while staying within common prop firm risk parameters.

Summary

The MACD and RSI divergence strategy offers a robust approach to spotting market reversals and executing profitable trades. Here are the key takeaways:

  • Risk Management is Paramount: Always adhere to a strict risk tolerance by risking only a small fraction of your account balance per trade. This is especially vital for prop traders where the rules are rigid and every trading decision counts.
  • Adaptability: Whether you are involved in manual trading or prefer automated trading, this strategy is applicable for both approaches.
  • Practice Makes Perfect: Before applying this strategy to a live account, it is essential to test it in a demo environment. 

By following this structured approach, FXIFY traders and others in the financial markets can refine their entry and exit rules, leading to more precise and profitable trading decisions. The method’s simplicity combined with its powerful divergence signals makes it one of the most effective technical trading strategies available today.

In conclusion, while no trading strategy can guarantee success, the MACD and RSI divergence technique is a valuable addition to your arsenal. It encourages a disciplined trading plan to capture market reversals before they fully unfold. As always, remain aware of the inherent risks, continue to educate yourself on trading signals and price trends, and ensure that your trading decisions align with your overall financial goals and risk tolerance.

Remember, consistency and discipline are the hallmarks of successful trading. The best trading strategy is the one you understand easily, fit into your routine, and execute with great risk management.

Hedging in Forex: Definition and Strategies

Hedging is a core technique in the foreign exchange market, primarily used for risk management. Understanding various Forex hedging strategies is crucial for managing this risk effectively. Forex traders must understand that its main purpose is to minimise the potential to lose money from adverse currency movements, rather than to generate profit.

What is Forex Hedging?

Think of hedging as insurance. You pay a premium (the cost of the hedge) to protect yourself against a potentially larger loss. For instance, you might pay for car insurance to avoid the financial burden of a major accident. Similarly, when trading forex, the cost of a hedge provides protection if a position moves against you, helping to reduce potential losses.

A stylized 3D illustration shows a dark blue house with a glowing insurance document inside a protective dome against threats like rain and fire, all rendered in a neon blue aesthetic against a dark background.

How Does Hedging Work?

Now that we’ve explained what hedging is, let’s look at how it works in the forex market.

Hedging works by offsetting the risk of a trade in one foreign currency pair with another trade that benefits from movement in the opposite direction.

For example, taking a trade on EUR/USD that benefits from Euro strength, and taking a short on EUR/JPY that benefits from Euro weakness. The goal isn’t to make a guaranteed profit; it’s to reduce the impact of adverse price movements in the market; in other words, offsetting your risk.

Effective Forex hedging strategies require a good understanding of market correlations. You need to know how different currency pairs tend to move in relation to each other. Hedging isn’t a magic bullet; it’s a tool that must be used strategically and carefully.

In the United States, holding two opposing positions (“direct hedging”) in the same currency pair within a single retail forex account is prohibited under the National Futures Association (NFA) rules, specifically due to the FIFO (First In, First Out) rule. Hedging itself is not illegal, and traders often use permissible alternatives to manage risk. 

While direct hedging is restricted in the US, traders may manage risk using alternative Forex hedging strategies, such as trading correlated currency pairs that tend to move predictably relative to each other.

Disclaimer: While opening multiple accounts to facilitate direct hedging in the U.S. isn’t explicitly prohibited by NFA or CFTC rules, using multiple accounts to direct hedge is a violation of compliance standards. Many brokers explicitly prohibit this practice. Traders should review broker-specific terms carefully and ensure their activities comply with applicable regulations and broker guidelines.

In the UK, hedging is generally permitted. There are fewer restrictions compared to the US, but it’s always wise to check with your broker’s specific policies.

Hedge Example:

For instance, if you’re long USD/JPY (betting on USD strength against JPY), you might hedge against the strength of that particular currency (JPY) specifically by taking a short position in EUR/JPY.

Alternatively, to hedge against USD weakness broadly while remaining compliant with U.S. trading regulations, traders can minimise risk by going long EUR/USD, as this currency pair typically rises when the USD weakens overall. This method allows traders to effectively hedge currency risk despite restrictions on direct hedging.

FXIFY™ Policies: Hedging between different accounts is prohibited. For a detailed explanation of prohibited trading strategies, please refer to our guidelines.

Forex Hedging Strategies

Hedging strategies are popular in forex trading because they help traders manage risk and limit losses. However, these strategies require a deeper understanding of market dynamics and aren’t ‘set and forget’ solutions.

Correlation Hedging

A well-known hedging strategy that involves using currency pairs that are inversely correlated. This means that when one pair goes up, the other tends to go down.

For example, if you’re long AUD/USD (expecting the USD to weaken against AUD), you might hedge by going long USD/CHF (positioning to benefit if the USD strengthens against CHF). This setup balances your exposure to USD movements — if the USD weakens, your AUD/USD long benefits; if the USD strengthens, your USD/CHF long can offset losses.

A practical tip is to study historical correlations between currency pairs using one of the many correlation matrices available online. Here’s a table of some commonly inversely correlated currency pairs:

Currency PairInversely Correlated PairNotes
EUR/USDUSD/CHFVery strong and consistent inverse correlation (-0.80 to -0.95).
GBP/USDUSD/CHFModerate inverse correlation; less stable than EUR/USD.
AUD/USDUSD/JPYSometimes inverse, but weaker; correlation varies with risk sentiment.
NZD/USDUSD/JPYWeak to moderate inverse correlation at times; not highly reliable.

This H4 chart illustrates the inverse correlation between EUR/USD (blue) and USD/CHF (red) plotted against percentage change. Notice how, generally, when one pair’s percentage change rises, the other’s falls.

Direct Hedging

This is a strategy that involves decisions to buy or sell simultaneously, holding both long and short positions on the same currency pair.

This USDJPY chart illustrates how a hedge can be used to manage the uncertainty of a potential trend reversal after a short trade.

Multiple Currency Hedging

This forex strategy uses multiple related currency pairs to construct a hedge aimed at neutralising overall exposure to exchange rate fluctuations. It’s important to distinguish this hedging technique from Triangular Arbitrage. While both may use a similar structure of trade involving three currencies, their objectives are fundamentally different. Arbitrage seeks to exploit temporary price discrepancies between the pairs for a risk-free profit. In contrast, this hedging strategy assumes relatively efficient pricing and focuses purely on risk management.

Example Scenario: Triangular Currency Hedge for Risk Neutralisation

Consider a structure involving positions designed to balance exposure across EUR, GBP, and USD:

Currency PairPositionAction TakenReason for Trade
EUR/USDLongEUR ↑ USD ↓Profit if EUR strengthens against USD
EUR/GBPShortEUR ↓ GBP ↑Protects against EUR weakness; profits if GBP strengthens vs EUR
GBP/USDShortGBP ↓ USD ↑Protects against GBP weakness vs USD; balances USD exposure

How it Works for Neutralisation:

By simultaneously holding these positions:

  • You are long EUR (via EUR/USD Long) and short EUR (via EUR/GBP Short).
  • You are long USD (via GBP/USD Short) and short USD (via EUR/USD Long).
  • You are long GBP (via EUR/GBP Short) and short GBP (via GBP/USD Short).

Structure for a Triangular Currency Hedge: Combining Long EUR/USD, Short GBP/USD, and Short EUR/GBP to neutralise risk across three currencies, potentially.

Essentially, you are both buying and selling each currency involved through different pairs. This creates a closed loop designed to significantly reduce (though not necessarily completely neutralise) the net impact of exchange rate movements.. The goal isn’t to profit from the hedge itself but to offset potential losses from adverse currency movements. By neutralising potential losses, this strategy also inherently neutralises potential gains that would have arisen from favourable movements.

The aim is a highly controlled, potentially near-neutral exposure, relying on the correlations and interrelationships between the currencies to achieve balance. This strategy requires a deep understanding of currency correlations, precise position sizing, and active management, distinguishing it clearly from the opportunistic nature of arbitrage.

Swap Hedging

In Forex trading, brokers charge or pay swap fees based on the interest rate differential between the two currencies in a pair:

  • A positive swap means you earn interest for being in a trade.
  • A negative swap means you pay interest instead.

Swap hedging involves holding one position that earns positive swap interest to help offset the cost of another that incurs a negative swap. The aim is to reduce financing costs over time, or potentially generate a small net gain if the positive swap outweighs the negative.

For example, a trader might go long AUD/JPY to earn a positive swap, while also holding a short position on GBP/CHF, which has a negative swap. In this case, the AUD/JPY position isn’t about price speculation—it’s simply used to reduce the overnight cost of holding the GBP/CHF trade.

This approach focuses on the interest rate differential, not on the price correlation between the two positions. However, traders still need to manage the risk of price movements, as a strong adverse move can easily offset any swap benefit.

Swap hedging is typically used by experienced traders operating with their capital or through brokers that pass on swap earnings.

Perfect Hedge vs Imperfect Hedge

A perfect hedge eliminates risk—and thus profit potential—as long as both positions remain active simultaneously. However, when you close the losing side and allow the profitable side to continue, you reopen the potential for gains (and risk). In other words, a perfect hedge removes risk but also removes the chance to profit while active.

Imperfect hedging, on the other hand, reduces risk without removing it completely. This can be done in a few ways:

  • Using correlated assets, such as hedging a long EUR/USD position with a long GBP/USD position. Because these pairs tend to move in the same direction, gains in one can partially offset losses in the other if their movements are not perfectly synchronised.
  • Reducing size, such as hedging only part of the exposure—e.g., long 1 lot EUR/USD, hedged with a 0.5 lot short.
    Using different instruments, such as pairing a spot position with a derivative like a futures contract.

The benefit of an imperfect hedge is that it still leaves some room for the upside while dampening the downside. However, it requires more analysis to get right and doesn’t fully eliminate risk.

The table and charts below highlight how perfect and imperfect hedges behave in practice:

Two side-by-side line graphs titled "Perfect Hedge" and "Imperfect Hedge" compare the profit and loss of an initial position, its hedge, and the combined result over time, with the perfect hedge showing a flat combined line and the imperfect hedge showing reduced volatility.

Notice the black line on both charts, which represents overall P/L (profit & loss). A perfect hedge completely neutralises P/L changes while active, thus resulting in a flat, horizontal line. An imperfect hedge dampens P/L volatility but does not eliminate it, resulting in a P/L line that trails after the initial position’s profits.

Hedge TypeProsCons
Perfect HedgeComplete risk elimination while active.No profit potential while the hedge is active. Often incurs extra trading fees.
Imperfect HedgeReduces risk; allows for some profit potential. Often cheaper or more accessible to implement.Doesn’t fully eliminate risk; the potential for loss remains. Requires careful correlation analysis.

Choosing between perfect and imperfect Forex hedging strategies depends on the trader’s specific objectives and risk tolerance.

Is Hedging Suitable for Prop Traders?

Many prop traders ask what is hedging and how it can help them stay within risk limits during high volatility. The answer lies in understanding its true purpose…

Hedging primarily safeguards capital, making it vital for prop traders managing drawdown. Proper execution of hedging can reduce stress, especially when holding trades overnight, albeit at the cost of potential profits. Like paying for insurance, you lose out on some cash, but benefit overall from the safety and peace of mind.

The deployment of a hedge can help prop traders offset their equity drawdown, which reduces the likelihood of an account breach and increases the likelihood of passing an evaluation (or maintaining a funded account).

FXIFY’s real-time performance dashboard and comprehensive economic calendar empower traders to identify optimal moments for deploying hedging strategies. These tools provide timely market insights, helping prop traders strategically manage exposure by determining when market conditions are favourable for risk reduction through hedging.

Disclaimer

Remember, hedging is fundamentally a risk management strategy, not a profit guarantee. It demands knowledge and planning. Prop traders aiming to protect capital can explore these techniques further on FXIFY’s platform.

If you’ve ever wondered what is hedging and whether it fits your trading style, FXIFY’s tools and resources can help you implement these strategies more confidently.