How to Day Trade Indices: A Step-by-Step Guide
To day trade indices, you open and close trades on a stock index within the same trading day, using a CFD. This guide explains how…
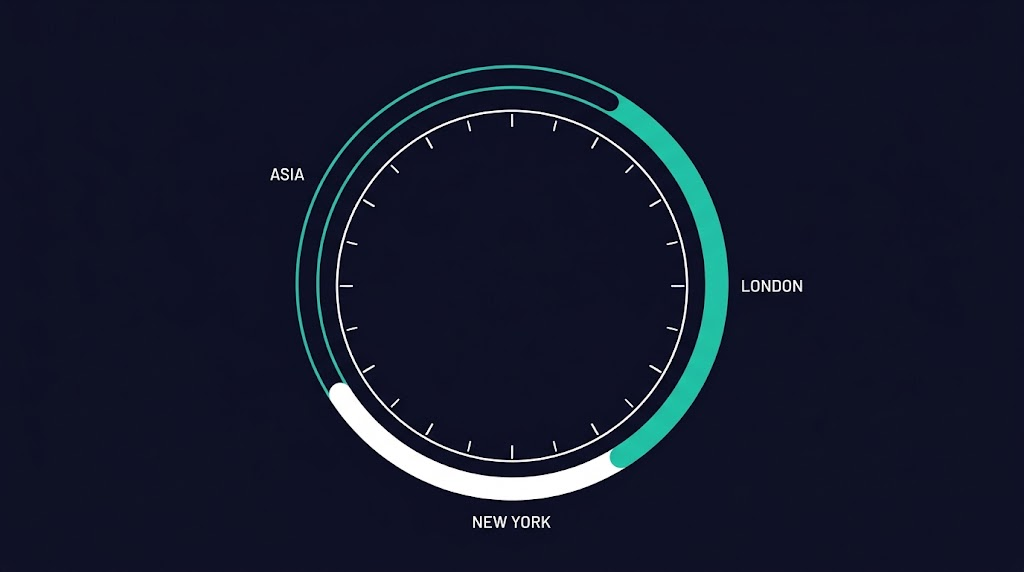
To day trade indices, you open and close trades on a stock index within the same trading day, using a CFD. This guide explains how index prices work, when indices move and how to plan each trade step by step.
What a Stock Index Is
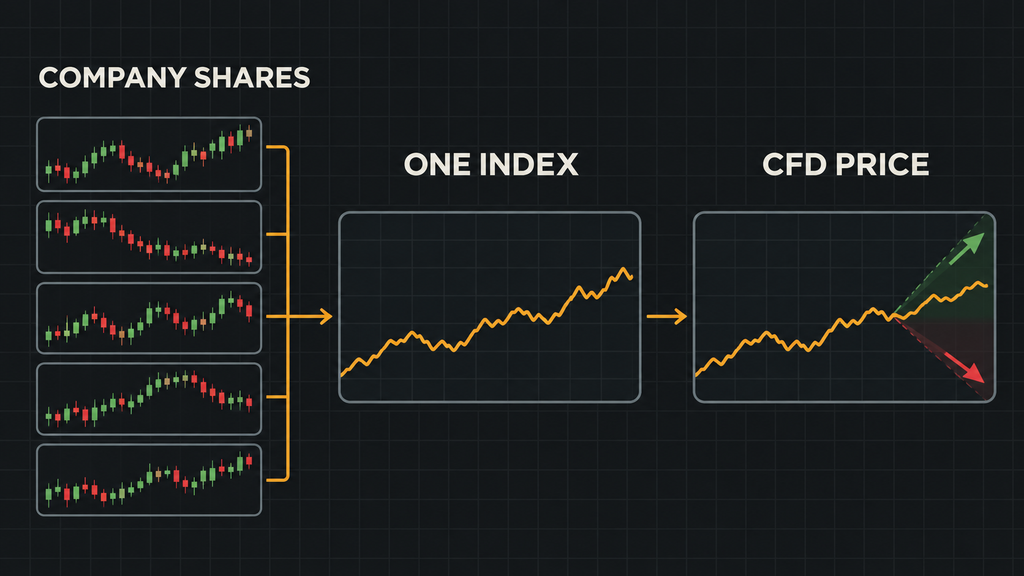
A stock index is one number that tracks the share prices of a group of companies. When the shares in the group rise, the index rises. When they fall, the index falls.
You cannot buy an index directly. With an index CFD, you trade the price of the index without owning any shares. You can trade on the price going up or going down.
Major Stock Indices
The table below shows six stock indices you may see on trading platforms. These are the index names. Your platform may use a shorter symbol for each one.
| Index | Country | What it tracks |
|---|---|---|
| S&P 500 | United States | 500 large US companies |
| Nasdaq 100 | United States | 100 large non-financial companies listed on the Nasdaq exchange |
| Dow Jones Industrial Average | United States | 30 large US companies |
| DAX 40 | Germany | 40 large German companies |
| FTSE 100 | United Kingdom | 100 large UK companies |
| Nikkei 225 | Japan | 225 large Japanese companies |
Each index has its own way of moving. Some move in larger steps than others. Learn one index well before you add another.
How Index Points and Trade Size Work
Points, Not Pips
Forex prices move in pips. Index prices move in points. If an index moves from 18,000 to 18,010, it has moved 10 points.
The Value of One Point
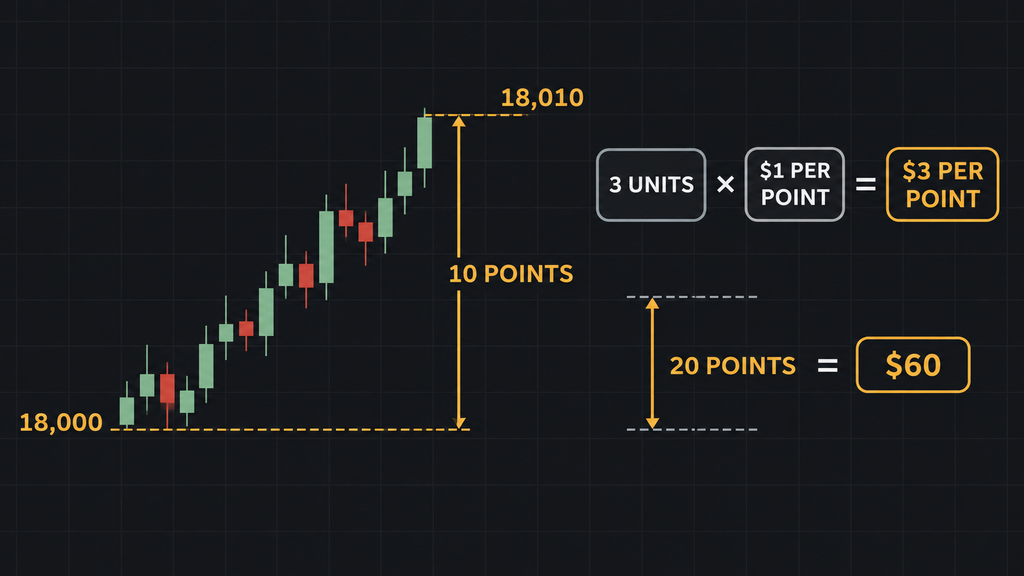
The money you gain or lose for each point depends on your contract and your trade size. This is different on each platform and for each index.
Here is an example with made-up numbers:
- One unit of an index CFD gains or loses $1 for each point.
- You trade 3 units.
- Each point of movement is worth $3 to you.
- If price moves 20 points in your favour, you gain $60. If it moves 20 points against you, you lose $60.
Check the contract details for each index on your own platform before you trade. For terms like CFD, spread and swap, see Forex Trading Terminology: Key Terms Explained.
When Indices Move
The Home Market Open
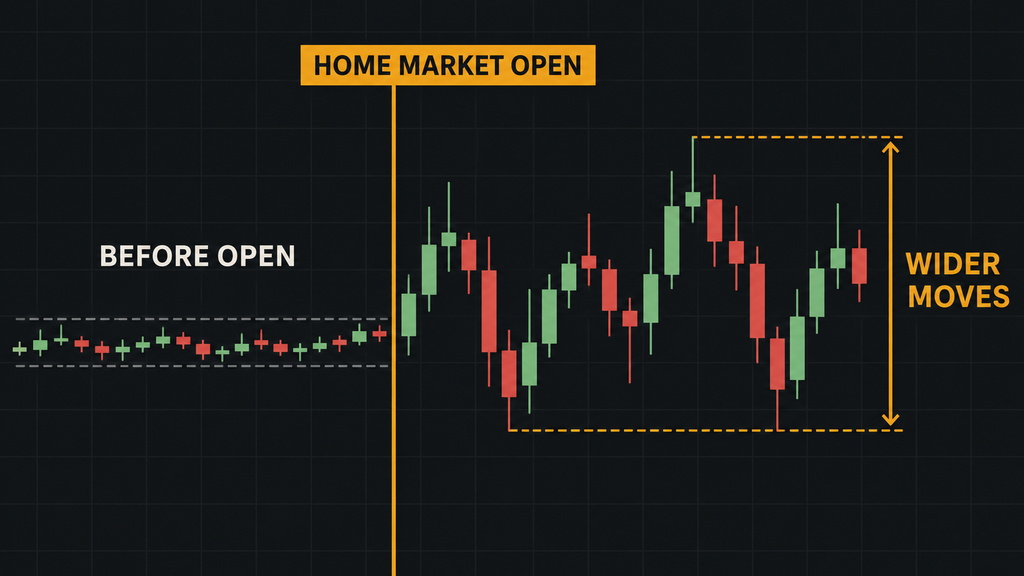
Each index is built from shares that trade on a home stock exchange. When that exchange opens, many shares start trading at once. Price moves in the index can be larger around this time.
| Index | Home market opening hours (local time) |
|---|---|
| S&P 500, Nasdaq 100, Dow Jones | 9:30 to 16:00, New York time |
| DAX 40 | 9:00 to 17:30, Frankfurt time |
| FTSE 100 | 8:00 to 16:30, London time |
| Nikkei 225 | 9:00 to 15:30, Tokyo time |
These are the main hours of each home exchange. Holidays and early closes can change them. Index CFDs can trade outside these hours, depending on your platform. Check the trading hours shown on your platform for each index.
Gaps
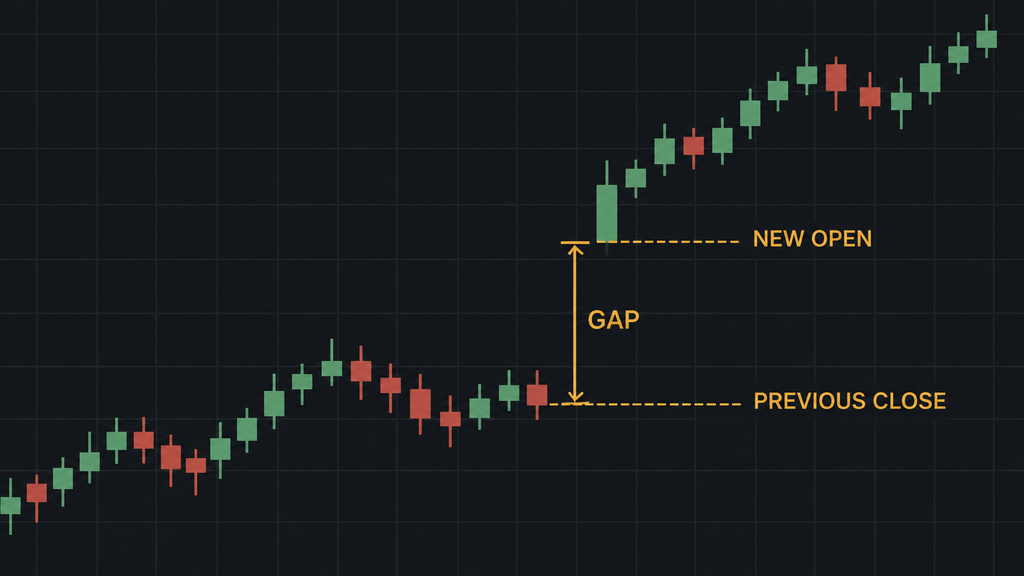
A gap is when price jumps from one level to another with no trades in between. Gaps can appear after the weekend or when trading starts again after a break.
If you hold a trade through a gap, it can close at a price far from your stop loss. This is one reason a day trader closes all trades before the end of the day.
How to Day Trade Indices, Step by Step
Step 1: Pick One Index
Start with one index. Watch how far it moves in a normal day. Note when it moves more and when it is quiet.
Trading one index lets you learn its habits. Switching between indices every day makes that harder.
Step 2: Mark the Previous Day’s High, Low and Close
Draw lines at yesterday’s high and low. Note where yesterday’s candle closed. These levels can act as areas where price pauses or turns.
Step 3: Set Your Bias and Your Cancel Level
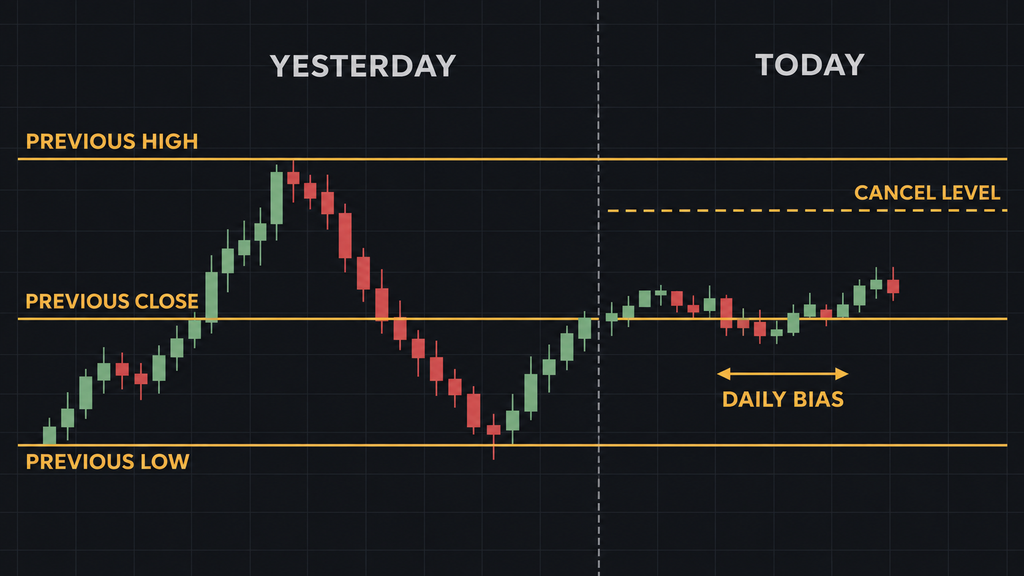
Use the daily chart to choose a direction for the day: bullish, bearish, or none. Write down the price that would cancel your bias. Learn the full method in Daily Bias Trading Explained.
Step 4: Mark the Opening Range
The opening range is the high and the low of a set period after the home market opens. For example, you can use the first 15 or 30 minutes.
Wait for that period to end. Then draw a line at its high and a line at its low. These two lines form your opening range.
Step 5: Choose Your Entry
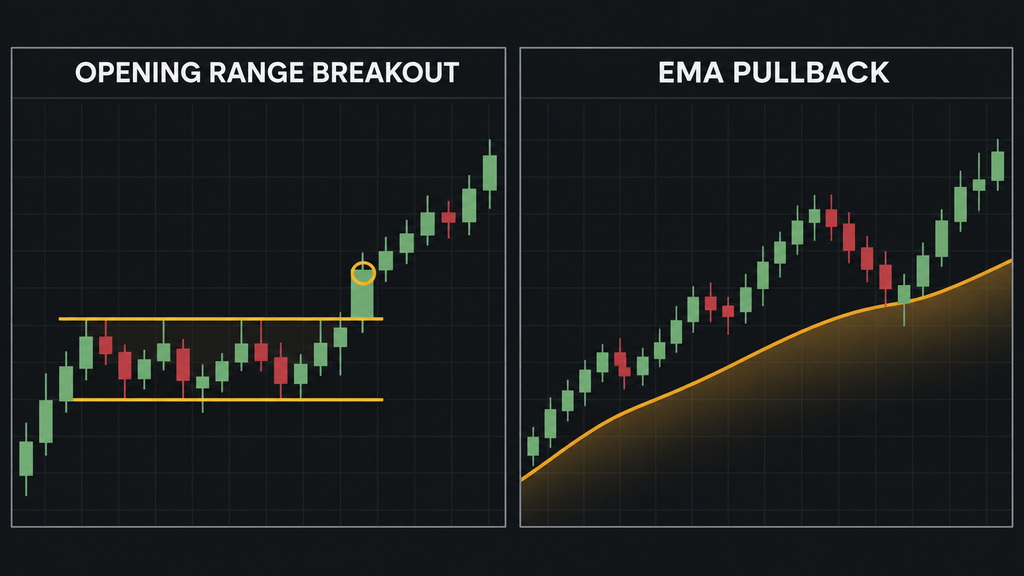
Here are two ways to enter. Pick one and use it the same way each time.
- Opening range breakout: Wait for a candle to close outside the opening range, in the direction of your bias. Enter after that close.
- Pullback to an EMA: Wait for price to move in the direction of your bias, then pull back to an EMA. Enter when price turns away from the EMA. See EMA for Day Trading: How to Choose Your Settings.
Step 6: Set Your Stop Loss and Trade Size
Place your stop loss where your trade idea is proven wrong. Measure the distance in points. Then choose a trade size so that the loss at your stop loss fits your risk amount. Learn more in Day Trading Stop Loss Explained.
An Opening Range Example
This example uses made-up prices.
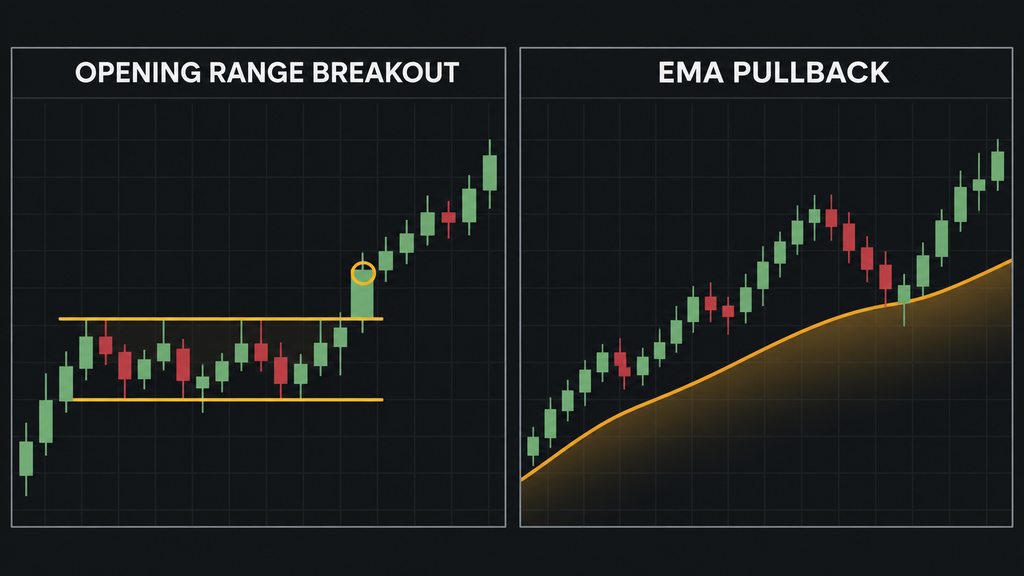
Your plan: Your bias for the day is bullish. You use a 15-minute opening range.
The opening range: In the first 15 minutes after the home market opens, the index trades between 18,010 and 18,050.
The breakout: A 5-minute candle closes at 18,055, above the range high. This matches your bullish bias, so you buy at 18,055.
The stop loss: You place it at 18,025, below the middle of the range. Your stop distance is 30 points.
The trade size: You decide to risk $90 on this trade. One unit gains or loses $1 per point, so each unit risks $30 at your stop loss. You trade 3 units.
The target: You set your target at twice your stop distance, which is 60 points. Your target is 18,115.
If price reaches 18,115, you gain $180. If price falls to 18,025, you lose $90. If slippage happens, the loss can be larger.
Risks When You Day Trade Indices
Fast Moves at the Open
Price can move quickly in the first minutes after the home market opens. Your entry or stop loss may fill at a worse price than you planned. This gap is called slippage.
Too Many Trades at the Open
Fast moves can make every candle look like a chance. Taking trade after trade at the open adds up costs and losses. Set a limit on how many trades you take each day, and write it in your plan.
The Same Trade Three Times
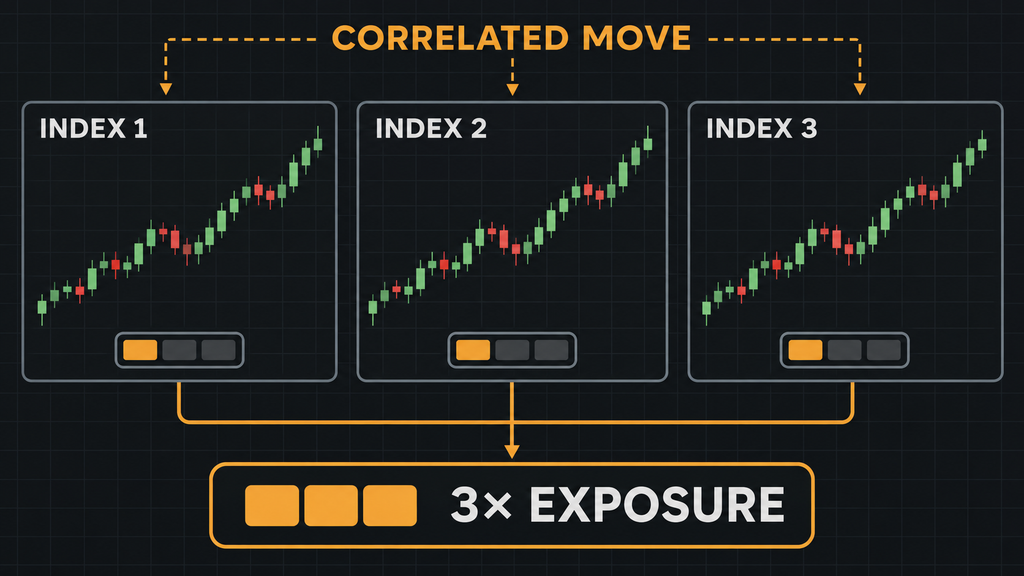
The S&P 500, the Nasdaq 100 and the Dow Jones all track large US companies. Some companies appear in more than one of them. These indices can move in the same direction at the same time.
If you buy all three at once, you may be placing close to the same trade three times. Your total risk is then about three times larger than you think.
Trading Costs Add Up
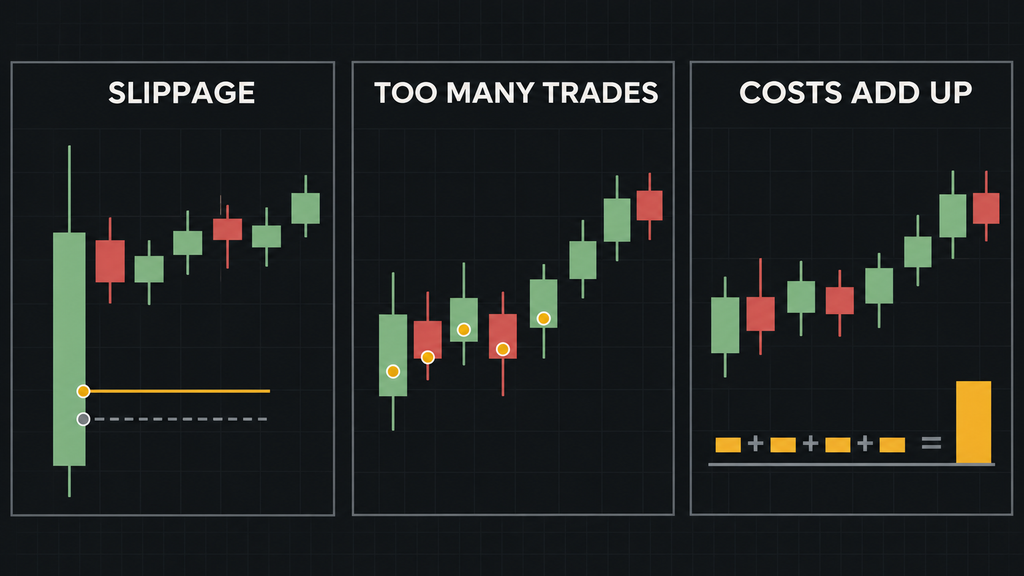
Each trade has a cost. You pay the spread, and on some accounts a commission too. Ten small trades in a morning means ten sets of costs. Check the costs for each index on your platform.
Holding Past the Close
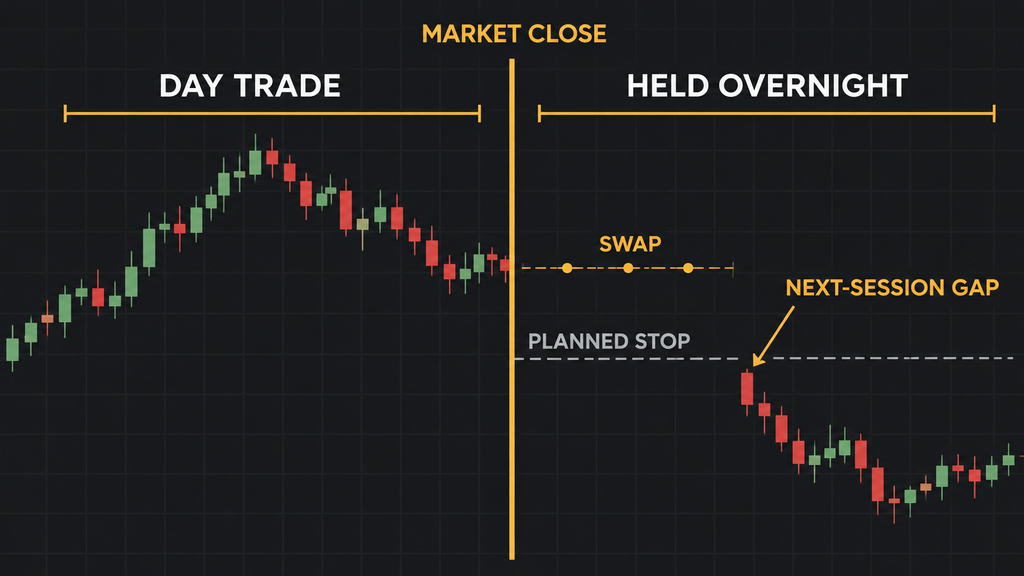
A day trade is closed on the same day. If you hold a trade overnight, you may pay a swap. You also take on the risk of a gap before the next trading day.
Trading Index CFDs on a Funded Account
FXIFY offers funded accounts for forex and CFD trading. If you plan to trade indices on a funded account, check two things first.
First, check which indices your account offers. Open your platform and look at the list of symbols. Second, check the contract details for each index, so you know your loss per point before you size a trade.
Index points can add up fast. A plan that sets your stop loss in points and your trade size in advance helps keep each loss to the amount you planned. Each FXIFY program lists its own loss limits on the FXIFY programs page.
FAQ
Which Index Should a Beginner Start With?
There is no single right index for every trader. Choose one whose home market hours fit your free time. Then check how many points it moves in a normal day, and make sure your trade size fits that movement.
What Time of Day Do Indices Move?
Price moves can be larger around the home market open. A US index can move more after 9:30 New York time. A German index can move more after 9:00 Frankfurt time. Watch your chosen index to learn its own pattern.
Can I Hold an Index Trade Overnight?
You can, but it is no longer a day trade. Holding overnight can mean paying a swap. You also face the risk of a gap before trading starts again.
How Much Should I Risk on One Index Trade?
There is no single right amount. Choose a fixed amount per trade that you can afford to lose. On a funded account, also make sure it fits inside your program’s loss limits. Then size each trade so the loss at your stop loss matches that amount.
How Are Indices Different From Forex Pairs?
A forex pair compares two currencies. An index tracks a group of company shares. Forex moves in pips, while indices move in points. Each index also follows the hours of its home stock exchange.