EMA for Day Trading: How to Choose Your Settings
An EMA for day trading is a moving average line that helps you see the direction of price on short timeframes. There is no single…
An EMA for day trading is a moving average line that helps you see the direction of price on short timeframes. There is no single right EMA setting for every trader. This guide explains what each length shows and how to test which one fits your trading.
What an EMA Is
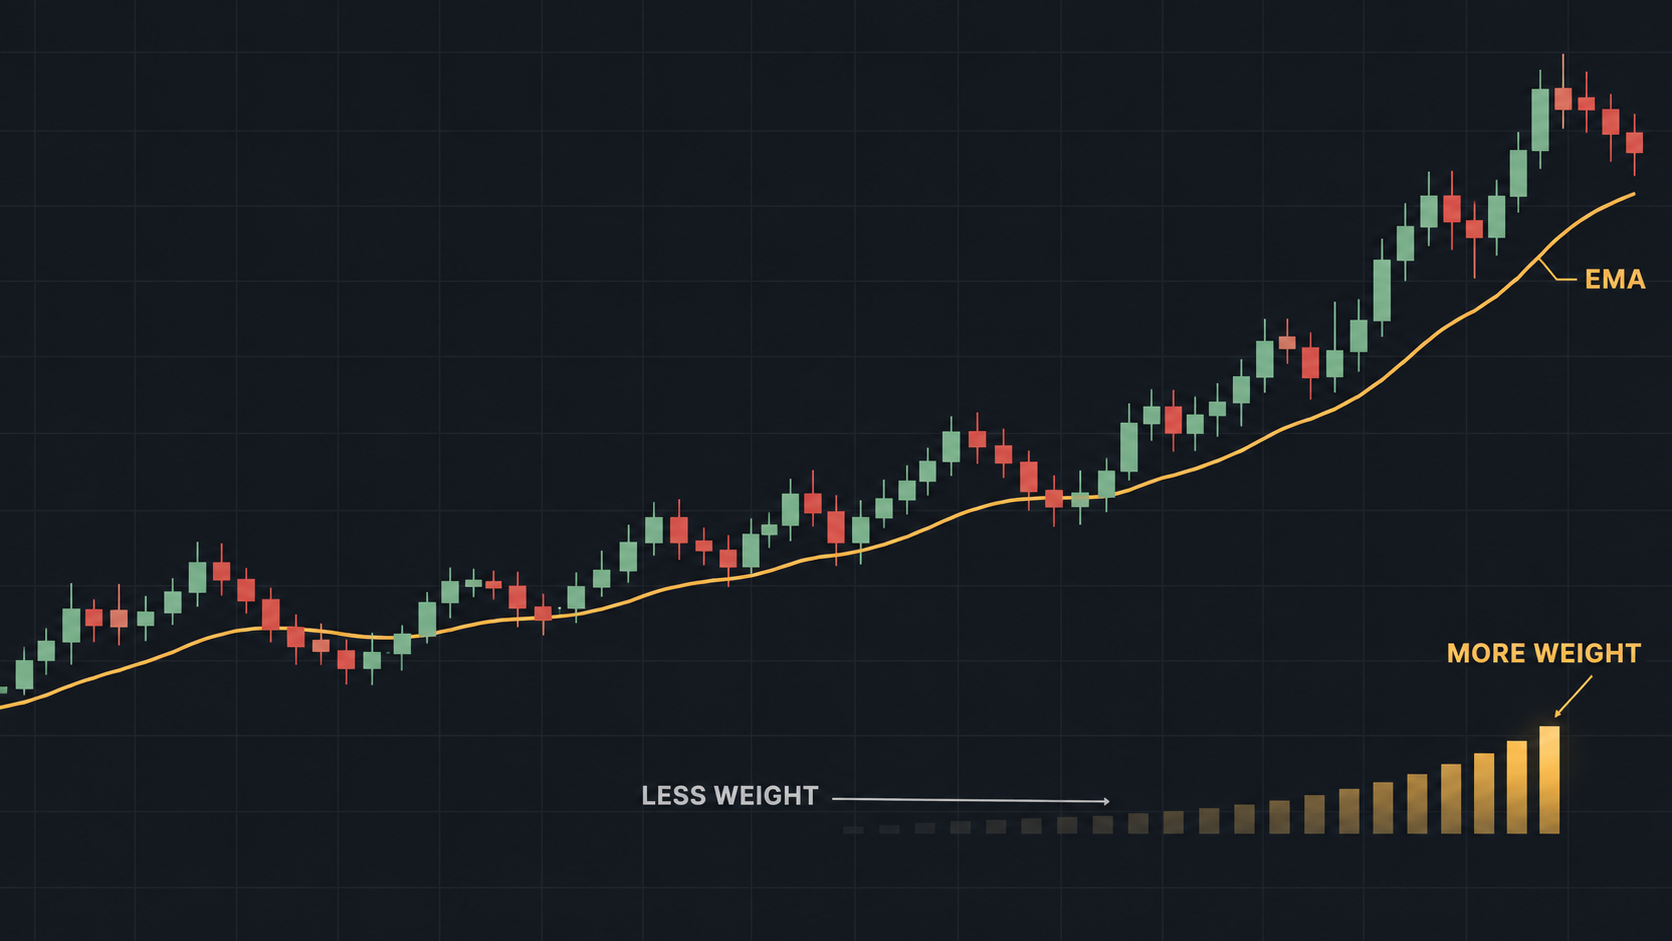
EMA stands for exponential moving average. It is a line on your chart that shows the average price over a set number of candles. It gives more weight to the newest prices.
The number you choose is the length of the EMA. A 20 EMA uses the last 20 candles. A 200 EMA uses the last 200 candles.
How the Weighting Works
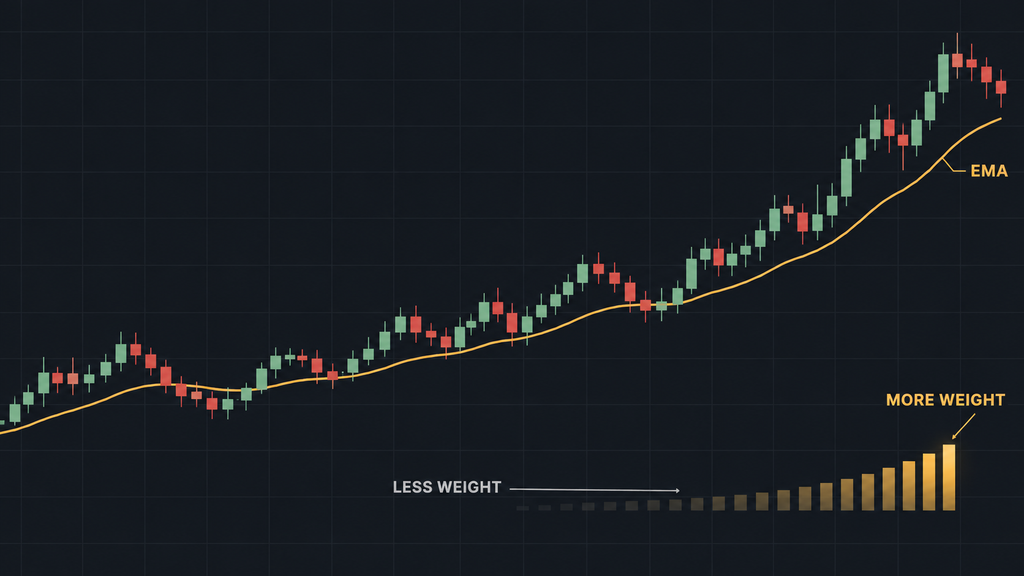
Each new candle gets a fixed share of the weight. The share is 2 divided by the length plus 1.
- On a 9 EMA, the newest price gets 20% of the weight.
- On a 20 EMA, the newest price gets about 9.5% of the weight.
The longer the EMA, the less one new price can move the line.
EMA vs SMA
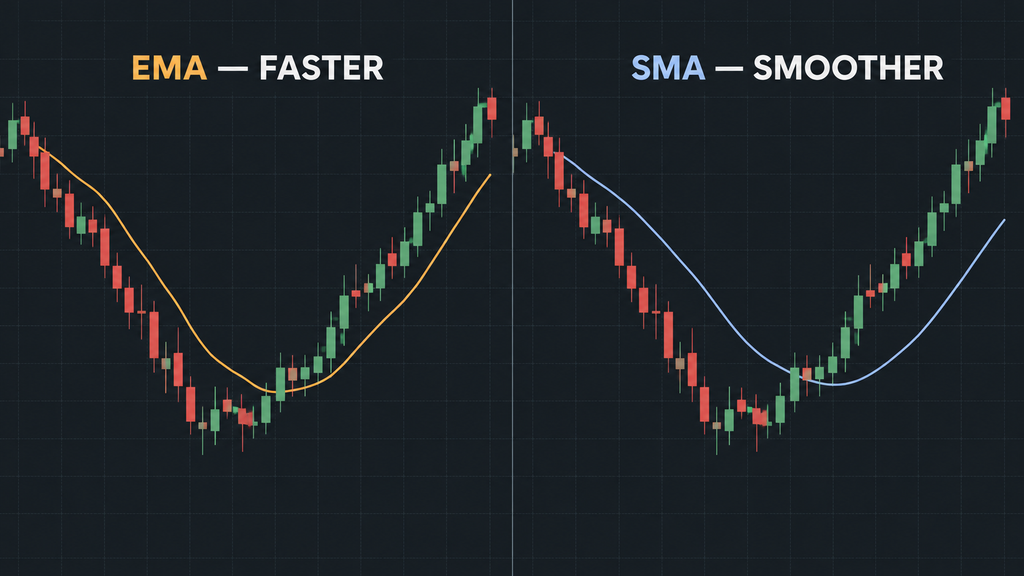
The SMA is a moving average that gives the same weight to every price in its length. The EMA gives more weight to recent prices. This means the EMA reacts faster when price changes direction.
For day trading, this faster reaction can help you see a change sooner. It also means the EMA can react to small moves that do not last.
How the EMA Length Changes What You See
Short EMAs
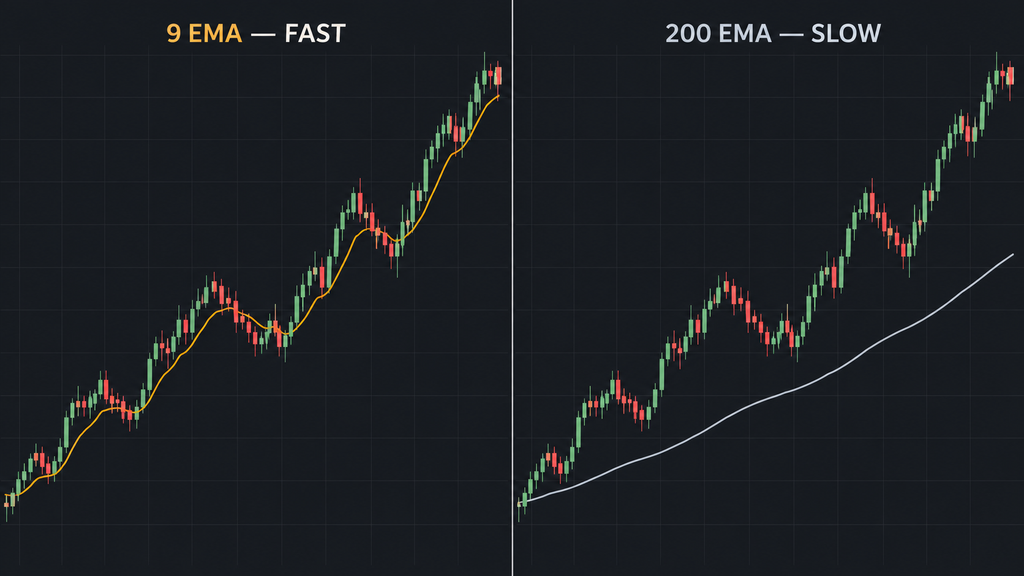
A short EMA, such as a 9 EMA, stays close to price. It turns quickly when price turns.
The trade-off is noise. A short EMA reacts to small moves that may not become a new trend. This can give you more false signals.
Long EMAs
A long EMA, such as a 200 EMA, moves slowly. It shows the larger direction of price over a longer period.
The trade-off is delay. A long EMA reacts late. By the time it turns, price may already have moved a long way.
The Length Counts Candles, Not Time
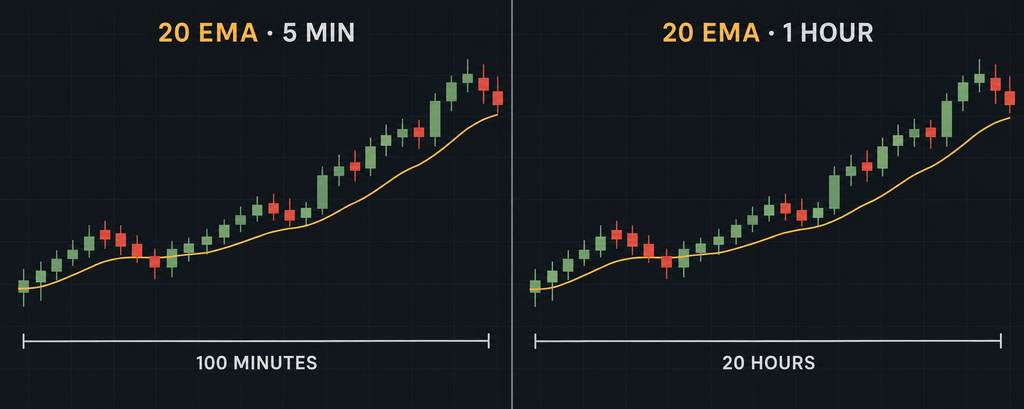
An EMA length is a number of candles. The time it covers depends on your chart timeframe.
- A 20 EMA on a 5-minute chart covers 100 minutes.
- A 20 EMA on a 1-hour chart covers 20 hours.
The same setting shows very different things on different timeframes. Always read an EMA together with the timeframe of your chart.
EMA Lengths You Will See on Day Trading Charts
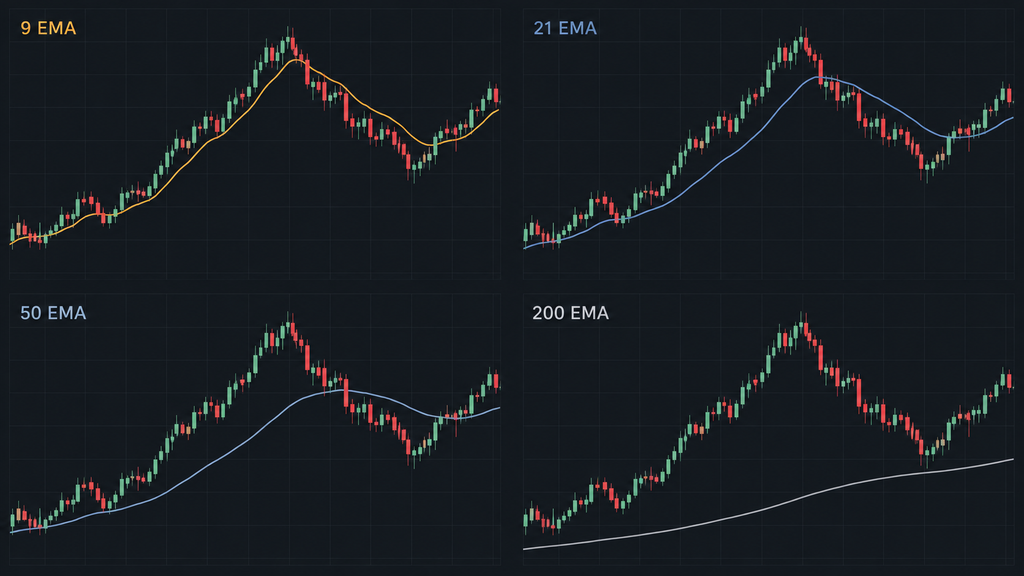
This section covers four lengths you may see on day trading charts. Each one shows something different. None of them is the right choice for every trader.
The 9 EMA
The 9 EMA follows price very closely. You can use it to see short moves and changes in momentum. It reacts sooner than the other three lengths. It also gives more false signals than they do.
The 20 or 21 EMA
The 20 and 21 EMA sit between fast and slow. They follow the short-term trend without reacting to every small move. On a trending chart, price may pull back toward this line and then continue.
The 50 EMA
The 50 EMA shows a wider view of the trend. On a 5-minute chart, it covers a little over four hours of price. It reacts more slowly than the 20 EMA but filters more noise.
The 200 EMA
The 200 EMA shows the long-term direction. On day trading charts, it can help you see if price is above or below its longer average. It turns very slowly, so it is not used for timing entries on its own.
How to Use an EMA for Day Trading
As a Trend Filter
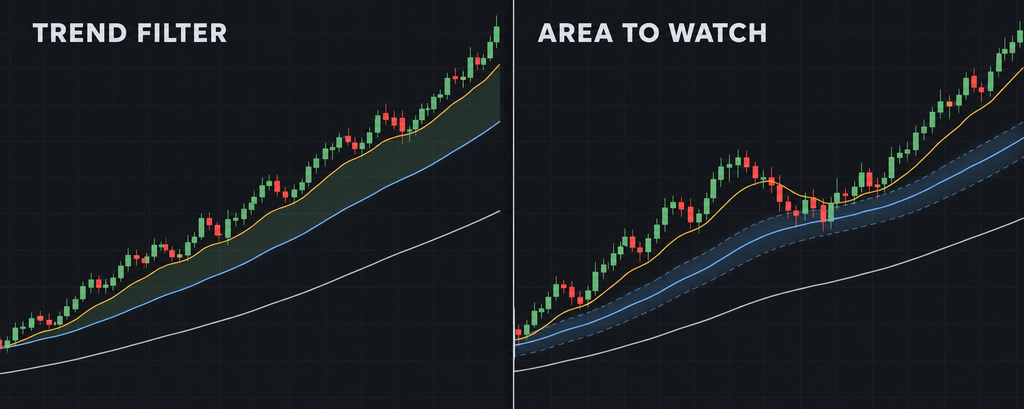
A trend filter helps you choose which direction to trade. You only look for buy trades when price is above your EMA. You only look for sell trades when price is below it.
This does not tell you when to enter. It helps you avoid trading against the direction the EMA shows.
As an Area Where Price May Pause
In a trend, price sometimes pulls back to an EMA and then moves on. Some traders watch for this pullback as a possible entry area.
Price does not always respect the line. It can pass through an EMA without stopping. Treat the EMA as an area to watch, not a fixed level.
EMA Crossovers
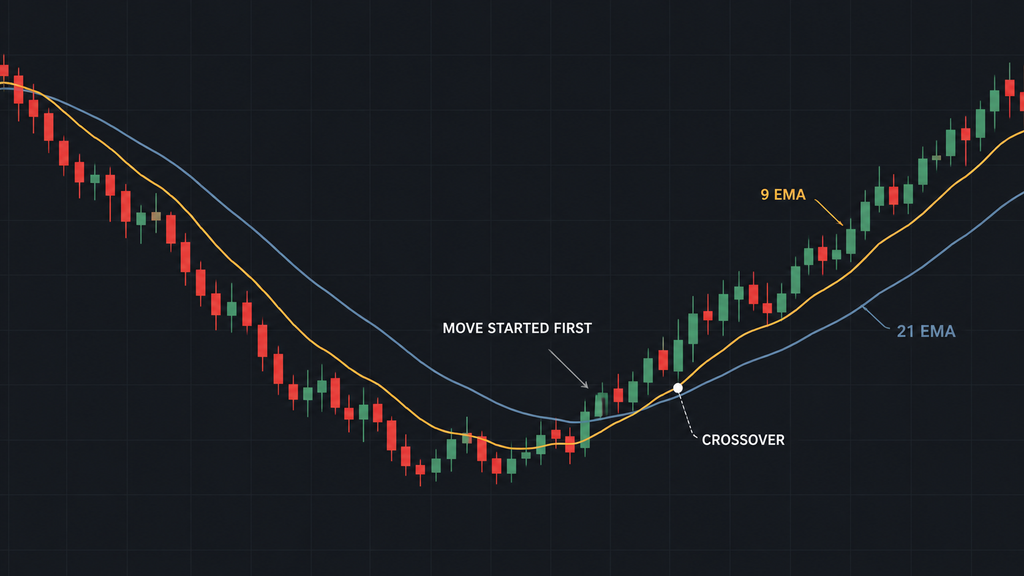
A crossover uses two EMAs, one short and one long. A crossover happens when the short EMA crosses the long EMA.
- When the short EMA crosses above the long EMA, the short-term trend may be turning up.
- When the short EMA crosses below the long EMA, the short-term trend may be turning down.
Example with made-up prices: You use a 9 EMA and a 21 EMA on a 15-minute chart. EUR/USD has been falling. The 9 EMA crosses above the 21 EMA near 1.1020. This can be a sign that the fall is losing strength.
A crossover is a signal to look closer, not a reason to enter on its own. Because EMAs use past prices, a crossover always comes after the move has started.
How to Choose and Test Your EMA Settings
Match the Length to How You Trade
Think about how long you hold your trades. If you hold trades for minutes, a short EMA on a short timeframe shows the moves you trade. If you hold trades for several hours, a longer EMA may fit better.
Pick one or two lengths to start. Do not test five at once.
Test on Past Charts First
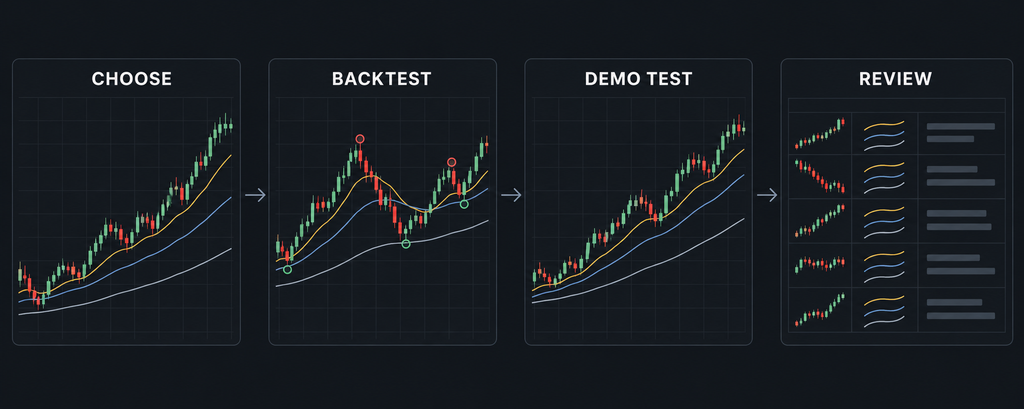
Scroll back on your chart and mark where your EMA rules would have given a trade. Write down the entry, the stop loss and the result. This shows you how the setting behaves before you risk money.
Test on a Demo Account
Next, trade your EMA rules on a demo account. Record every trade in your trade journal. Keep the same EMA setting for the whole test.
Keep the Setting Fixed
If you change your EMA after every loss, you never learn what the setting does. Choose a test period in advance. Review your results only at the end of it.
EMA Mistakes to Avoid
Using an EMA Alone
An EMA shows past prices in a smoothed line. It does not tell you where to place a stop loss or how much to risk. Combine it with your chart levels, your stop loss and your trade size. Learn more in Day Trading Stop Loss Explained.
Changing Settings After Every Loss
Losses happen with every setting. Changing your EMA after each loss means you never test any setting long enough to judge it.
Too Many Lines on the Chart
Four or five EMAs on one chart can make price hard to read. Each line gives a different signal. Start with one or two.
Using Crossovers in a Sideways Market
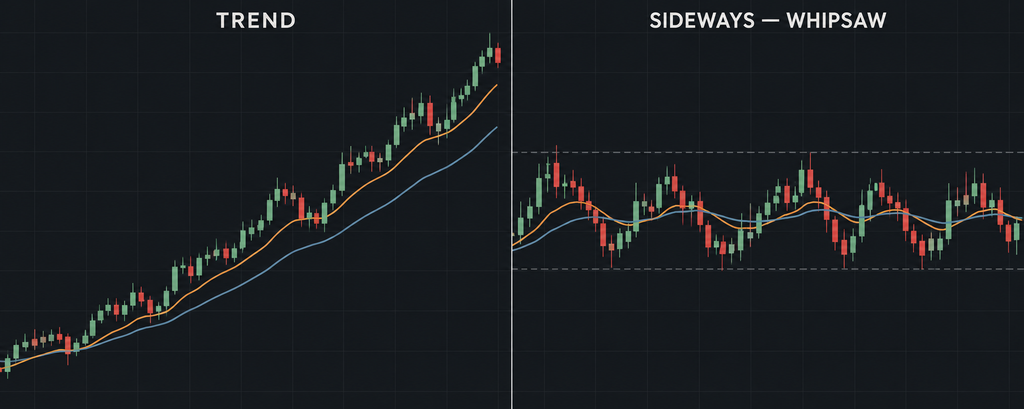
When price moves sideways, short and long EMAs cross back and forth. Each cross can look like a signal. In a range, these signals can lead to many small losses. For terms like trend and range, see Forex Trading Terminology: Key Terms Explained.
Using EMAs on a Funded Account
An EMA can be part of your trading plan on any account, including a funded account. FXIFY offers funded forex and CFD accounts.
Your EMA helps you choose trades. Your stop loss and trade size keep each trade inside your plan and inside the account’s loss limits. Each FXIFY program lists its own limits on the FXIFY programs page.
FAQ
Is One EMA Right for Every Day Trader?
No. Each length trades speed against noise. A short EMA reacts fast but gives more false signals. A long EMA filters noise but reacts late. Choose a length that fits your timeframe, then test it.
Is an EMA or an SMA Better for Day Trading?
Neither is better in every case. The EMA reacts faster to new prices, which can help on short timeframes. The SMA moves more smoothly. Test both on your own charts and compare the results.
Which Timeframe Should I Use With an EMA?
Use the timeframe your trading plan is built on. Then remember that the EMA length counts candles. A 20 EMA on a 1-minute chart covers 20 minutes. On a 15-minute chart, it covers 5 hours.
Do EMAs Work When the Market Moves Sideways?
EMAs show direction, so they help more when price is trending than when it moves sideways. In a sideways market, price crosses back and forth over the EMA. Crossover signals can fail again and again in these conditions.