Hammer Candlestick Pattern Cheatsheet: 4 Patterns Traders Often Confuse
You have seen the shape before. A tiny body, a long wick, sitting somewhere on your chart after a run of red or green candles….

You have seen the shape before. A tiny body, a long wick, sitting somewhere on your chart after a run of red or green candles. The question is always the same: is this a signal, or is it noise? A hammer candlestick pattern is one of four shapes that share this look. Mixing them up is an easy way to read a chart wrong. Here is how to tell them apart.
Why These Four Patterns Belong Together
A hammer only exists as one half of a pair. Its exact shape appears twice, once as a bullish signal and once as a bearish one, depending on the trend behind it. The same is true for its upside-down twin.
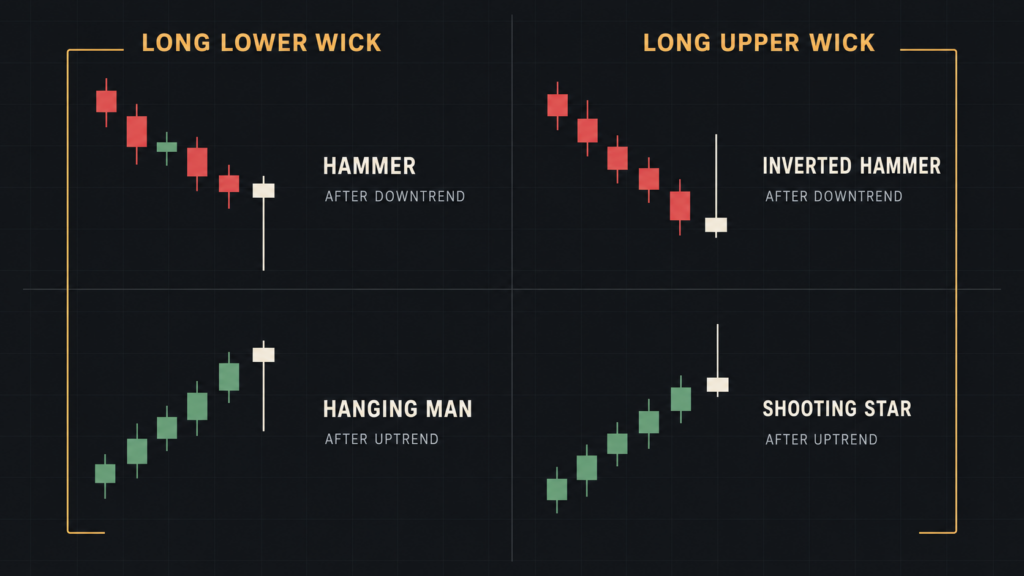
Two shapes cover all four patterns. A small body with a long lower wick is either a hammer or a hanging man. A small body with a long upper wick is either an inverted hammer or a shooting star. The shape never tells you which one you have. The trend does.
That is why this cheat sheet covers all four together. Learning the hammer without learning its look-alikes leaves a gap. You could read a hanging man as a hammer and treat a bearish warning as a buy signal.
What Is a Hammer Candlestick Pattern
Picture a price that has been sliding for a while. During this one candle, it slides further still, then something changes. Buyers step in, and by the close, price has climbed back near where it opened.
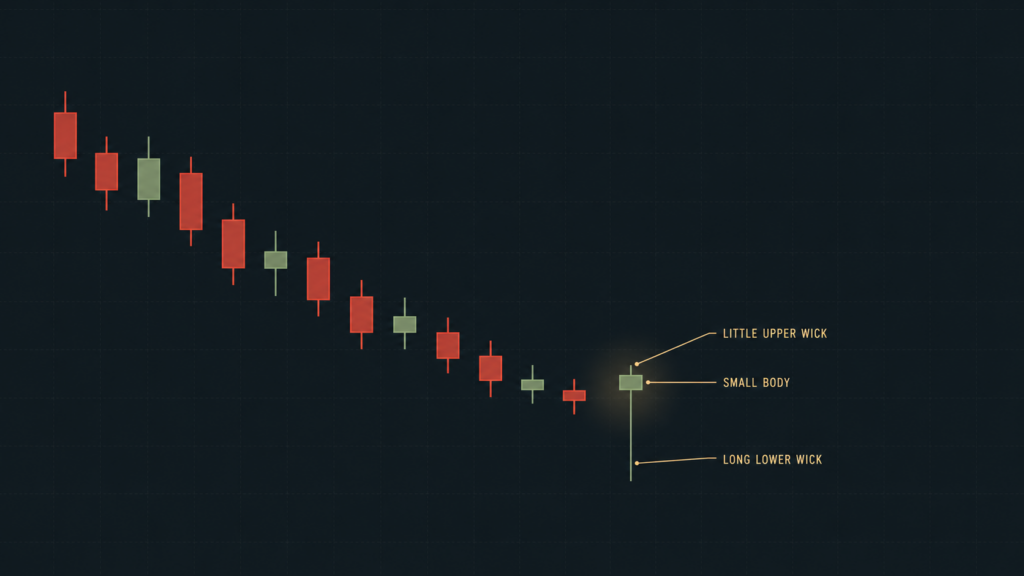
That is a hammer. Three things give it away:
- The body sits near the top of the candle and stays small.
- The lower wick runs long, usually at least twice the length of the body.
- The upper wick barely shows, if it shows at all.
Sellers had control early in the candle and pushed price down hard. Buyers pushed back and pulled price up before the close. That shift matters, but one candle never tells the whole story on its own.
Confirming a Hammer Before You Act
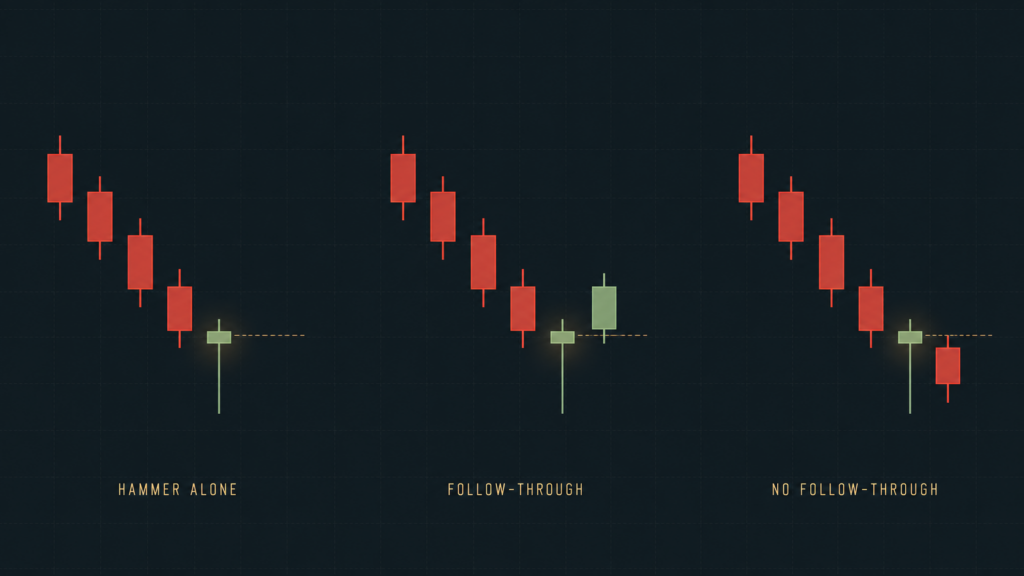
Here is the part traders skip, and it costs them. A hammer does not promise a reversal. Price can turn around and keep falling right after it forms.
Wait for the next candle to close above the hammer’s close. That next candle carries the answer. It tells you the buying did not fade the moment the hammer closed. It kept going.
Jump in on the hammer alone, before that confirmation shows up, and you are trading a guess, not a signal.
Inverted Hammer
Same setup, flipped shape. An inverted hammer also shows up after price has been falling.
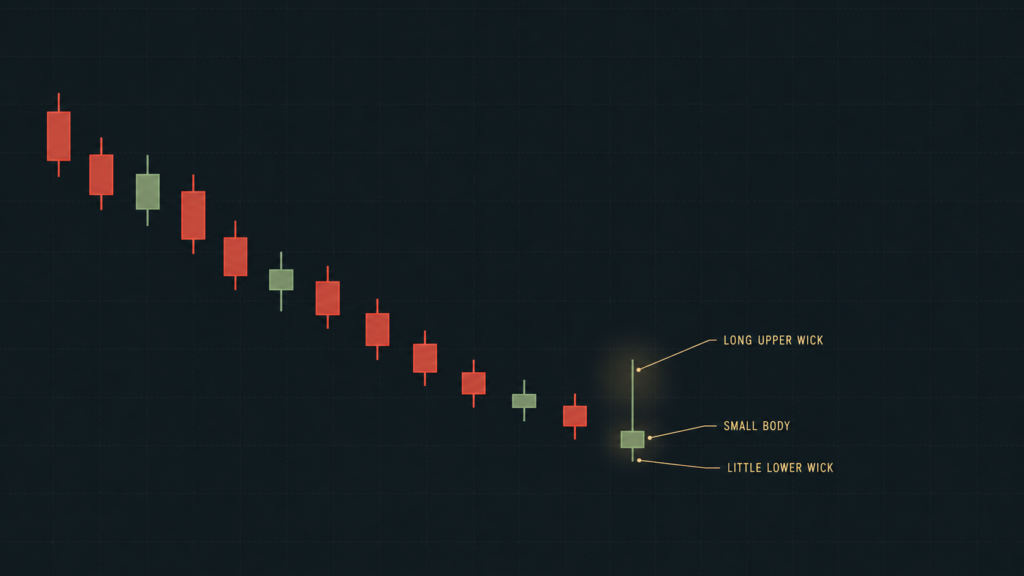
- The body sits near the bottom of the candle and stays small.
- The upper wick runs long, usually at least twice the body.
- The lower wick barely shows, if at all.
Buyers tried to push price up during the candle. They did not fully hold that ground by the close, but the attempt still counts as bullish. Same rules apply here too. You need a downtrend behind it, and you need the next candle to confirm before you treat it as a signal.
Hanging Man
Now here is where charts get tricky. A hanging man looks exactly like a hammer. Small body, long lower wick, almost no upper wick. Put the two side by side and you cannot tell them apart by shape alone.
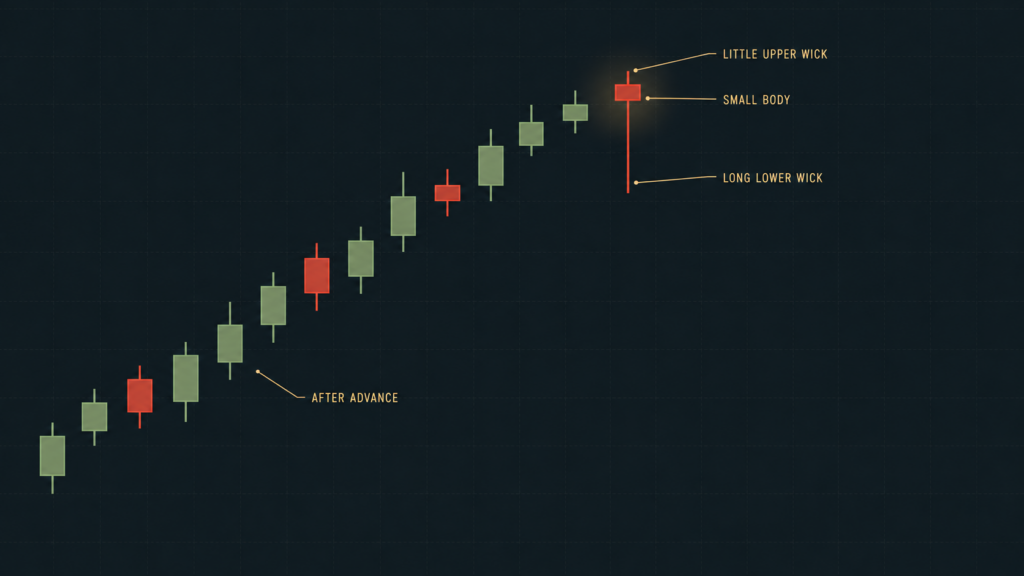
What separates them is where they show up. A hanging man forms after price has been climbing, not falling. In that spot, the exact same shape flips meaning and turns bearish. Sellers showed up during the candle and pushed price down before buyers pulled it back. That is the first sign of selling pressure inside an uptrend, and it is worth paying attention to.
This is the mix-up traders make most. Do not judge the candle on shape. Judge it on where it sits.
Shooting Star
One more pair to know. A shooting star looks exactly like an inverted hammer. Small body, long upper wick, almost no lower wick.
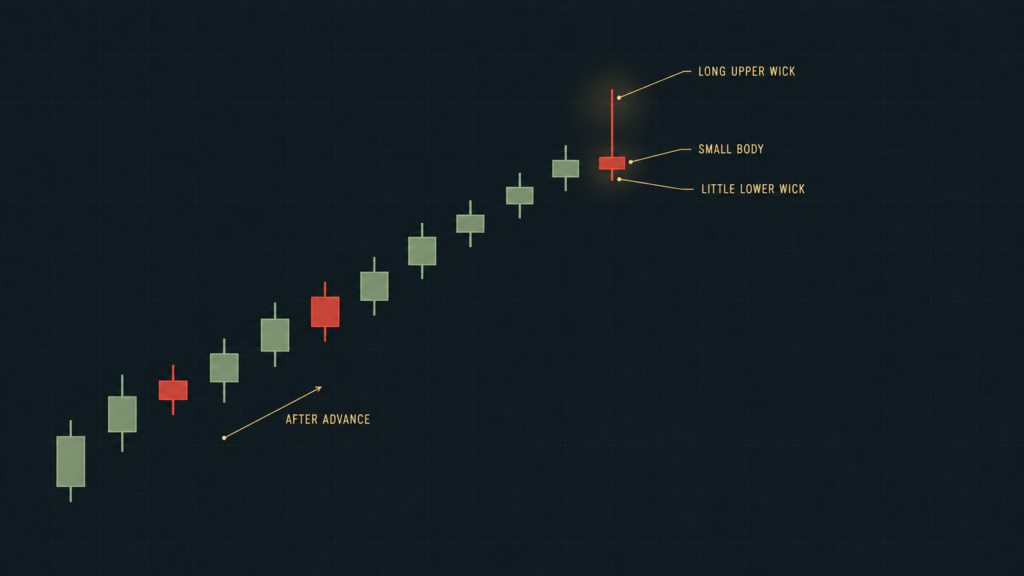
It shows up after a price has been climbing. Buyers push price higher during the candle, then sellers take control and drag price back down near the open by the close. That is a bearish signal. Like the other three, you want a confirming candle behind it before you treat it as more than a warning.
Cheatsheet: Telling Them Apart
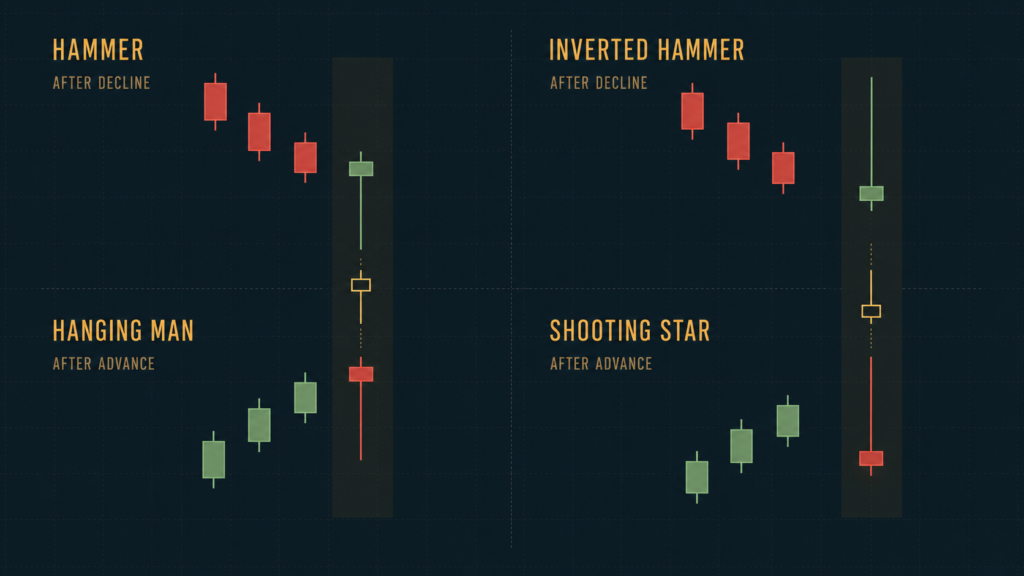
Four patterns, two shapes. What changes the signal is the trend sitting behind the candle.
| Pattern | Shape | Appears After | Signal |
| Hammer | Small body, long lower wick | Downtrend | Bullish |
| Inverted Hammer | Small body, long upper wick | Downtrend | Bullish |
| Hanging Man | Small body, long lower wick | Uptrend | Bearish |
| Shooting Star | Small body, long upper wick | Uptrend | Bearish |
One thing to remember from this table. The shape tells you which pair you are looking at. The trend tells you which one it actually is.
Common Mistakes to Avoid
- Reading the shape and skipping the trend. A hammer and a hanging man are the same candle wearing a different context. Check the trend first.
- Skipping confirmation. Every pattern here gets more reliable once the next candle backs it up. Acting early raises the chance of trading a false signal.
- Ignoring the wick. A short wick does not carry the same weight. If it is not clearly longer than the body, treat the signal as weaker.
- Treating any of this as a sure thing. None of these patterns guarantee a reversal. Price can keep moving the way it was already moving, right through the pattern.
Put It Into Practice
These four patterns are a starting point, not a full strategy. Pair them with support and resistance, or another tool, before you act on what you see.
Shape tells you the pair. Trend tells you the pattern. Confirmation tells you when to act. Practice spotting all three on a live CFD chart before you trade them for real.
When you are ready to put these patterns to work, explore FXIFY programs.