





Fibonacci Retracement Tool: How to Draw and Use It
Fibonacci retracement is a drawing tool that measures how far price pulls back after a move. You draw it from one end of a move…

Fibonacci retracement is a drawing tool that measures how far price pulls back after a move. You draw it from one end of a move to the other, and it marks lines at set percentages of that move. You can use those lines to plan where a pullback might stop and the trend might carry on.
What Is Fibonacci Retracement?
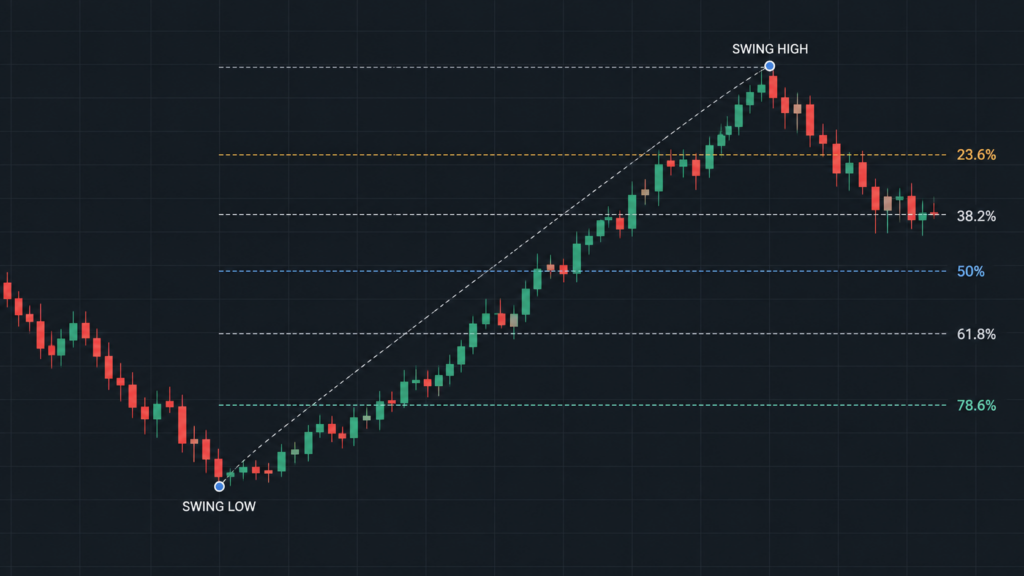
Price moves in waves. After a move up, it can drop back part of the way before it rises again. That drop is called a retracement, or pullback.
The Fibonacci retracement tool splits the move into levels. The standard levels are 23.6%, 38.2%, 50%, 61.8% and 78.6%. Each one shows how much of the move price has given back.
A 38.2% retracement means price has given back 38.2% of the move. A 61.8% retracement is a deeper pullback. At 100%, price has given back the whole move.
The tool does not predict where price will turn. It gives you a fixed way to measure pullbacks, so you plan every trade the same way.
Where the Levels Come From
The Fibonacci sequence is a row of numbers. Each number is the sum of the two before it: 1, 1, 2, 3, 5, 8, 13, 21, 34, 55, 89 and so on. The levels come from dividing numbers in this row by each other.
- 61.8%: Divide a number by the next one. For example, 55 ÷ 89 = 0.618.
- 38.2%: Divide a number by the one two places after it. For example, 34 ÷ 89 = 0.382.
- 23.6%: Divide a number by the one three places after it. For example, 21 ÷ 89 = 0.236.
- 78.6%: This is the square root of 0.618, which is about 0.786.
Early in the row, the results jump around. For example, 2 ÷ 3 = 0.667. Further along, each division gives almost the same answer, so the tool uses those fixed values.
Why 50% Is on the Tool
The 50% level is not a Fibonacci ratio. It marks the point where price has given back exactly half the move. MT5 includes it in its default levels.
How to Draw Fibonacci Retracement
The tool needs two points: the start of the move and the end of the move. Which way you draw it depends on the trend.
In an Uptrend: Swing Low to Swing High
Click the swing low where the move started. Drag to the swing high where the move ended.
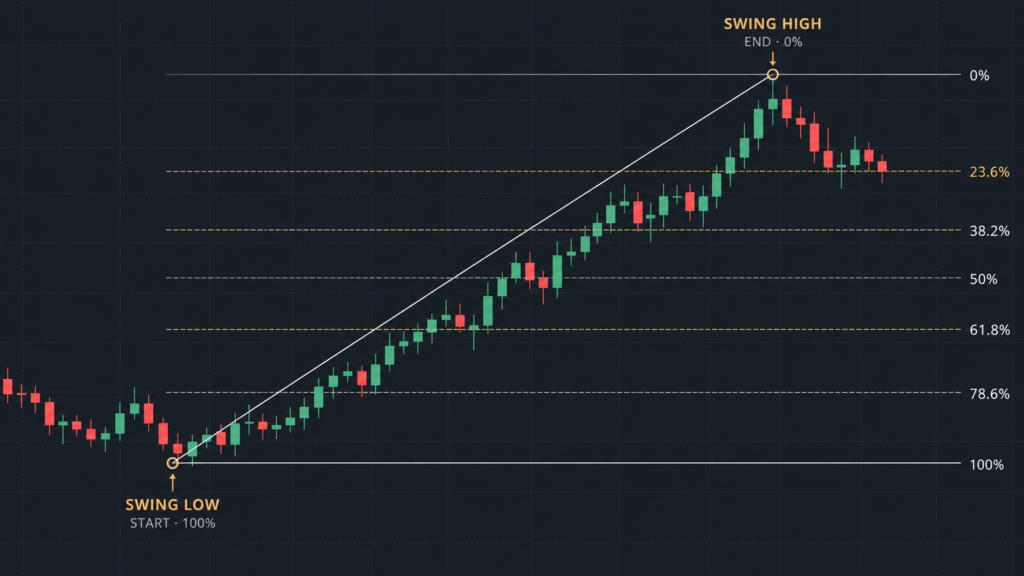
The 0% level sits at the high, and the 100% level sits at the low. The levels in between are where a pullback might stop.
In a Downtrend: Swing High to Swing Low
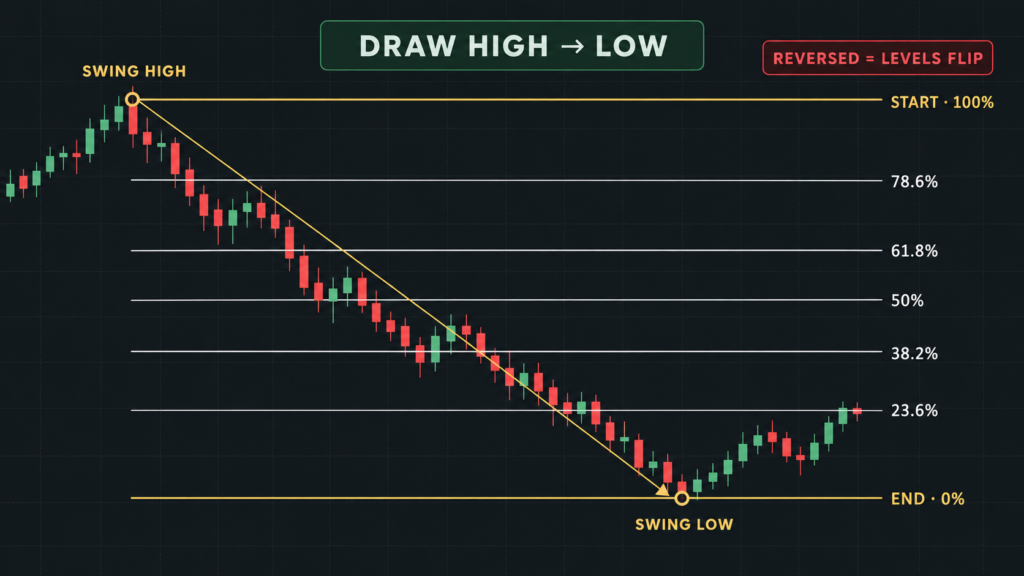
Click the swing high where the move started. Drag to the swing low where it ended. The 0% level sits at the low and the 100% level at the high. The levels in between are where a bounce might stop.
If you draw it the wrong way round, the levels flip. Your 61.8% line lands where 38.2% should be. The same happens in TradingView if the Reverse setting is switched on. Check that 0% sits at the end of the move every time.
How to Pick the Right Swing
Choose a clear move that stands out on the chart. The start and end should be obvious swing points, not small wiggles inside the move.
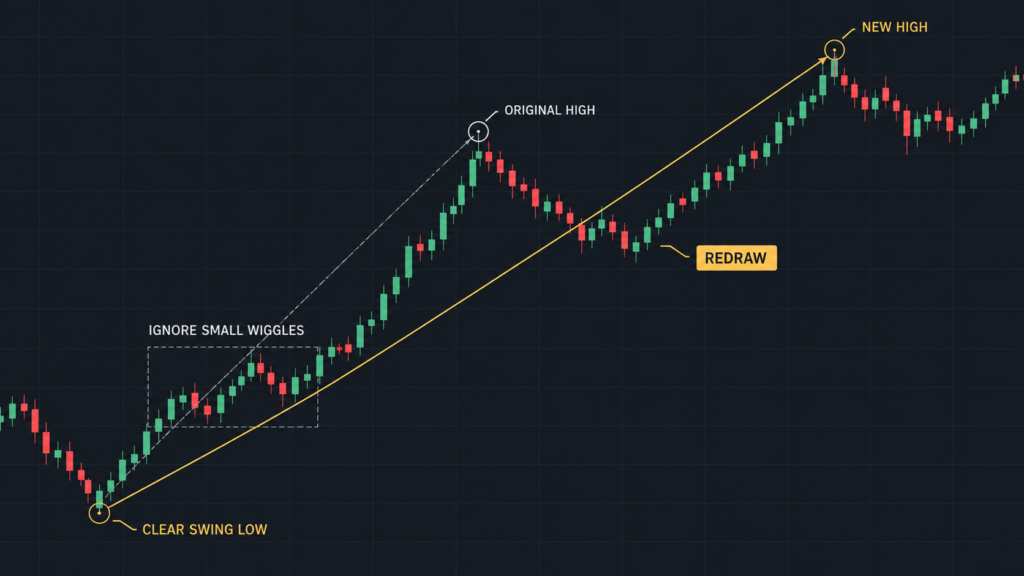
Use the wicks or the candle bodies for both points. Pick one and use it every time, so your levels stay the same from chart to chart. Draw the tool once price has started to pull back from the high. If price then makes a new high, the move has a new end point. Redraw from the same low to the new high.
Finding the Tool in MT5 and TradingView
- MT5:
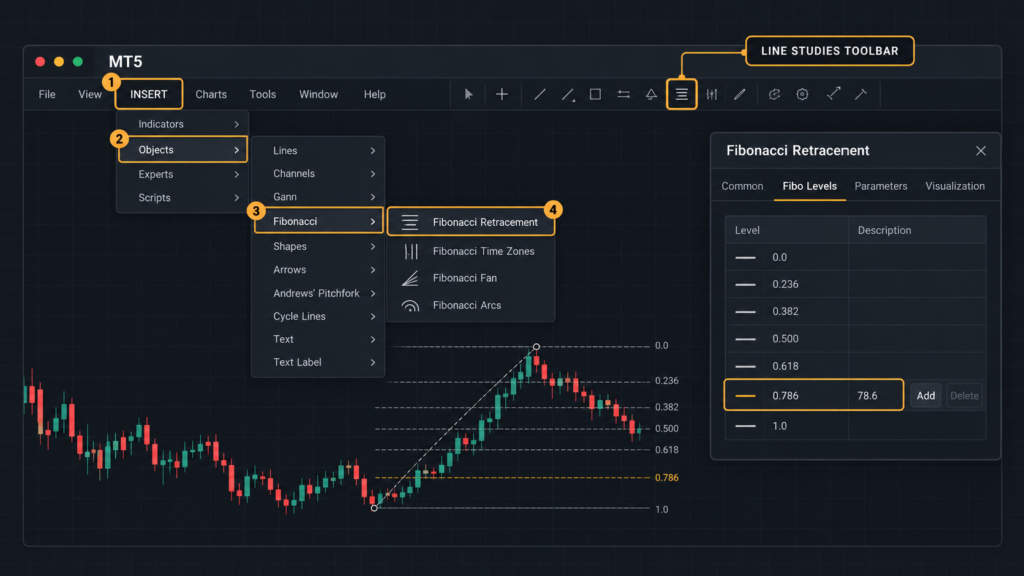
Open the Insert menu, then Objects, then Fibonacci, and pick Fibonacci Retracement.
You can also use the Line Studies toolbar. The default MT5 levels do not include 78.6%. To add it, open the tool’s settings and add a new level in the Levels tab.
- TradingView:
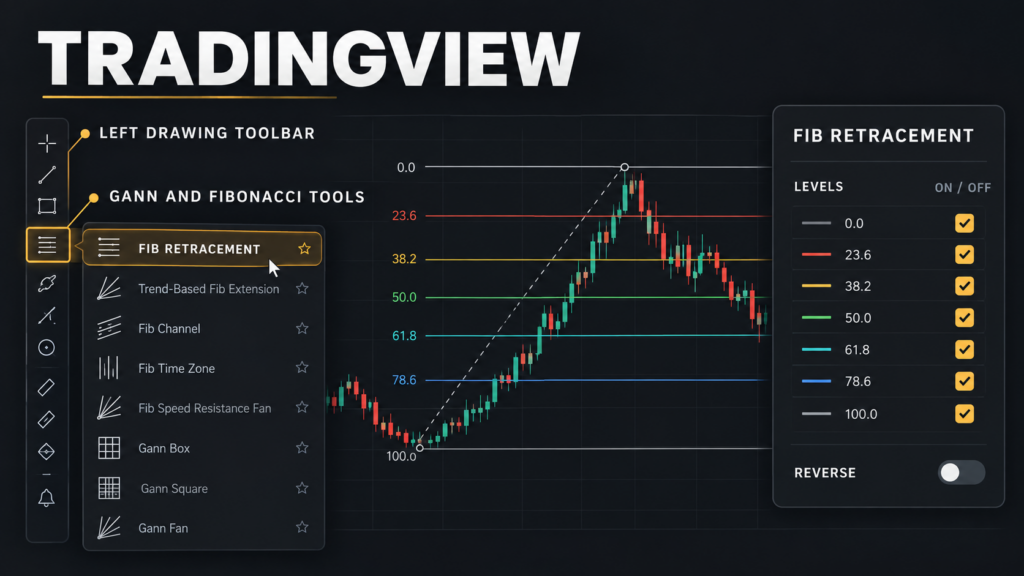
Open the drawing toolbar on the left of the chart and pick Fib Retracement. In the settings, you can turn each level on or off.
How to Trade Fibonacci Retracement Levels
Treat Levels as Zones, Not Exact Prices
Price can turn a few pips before a level or push a few pips past it.
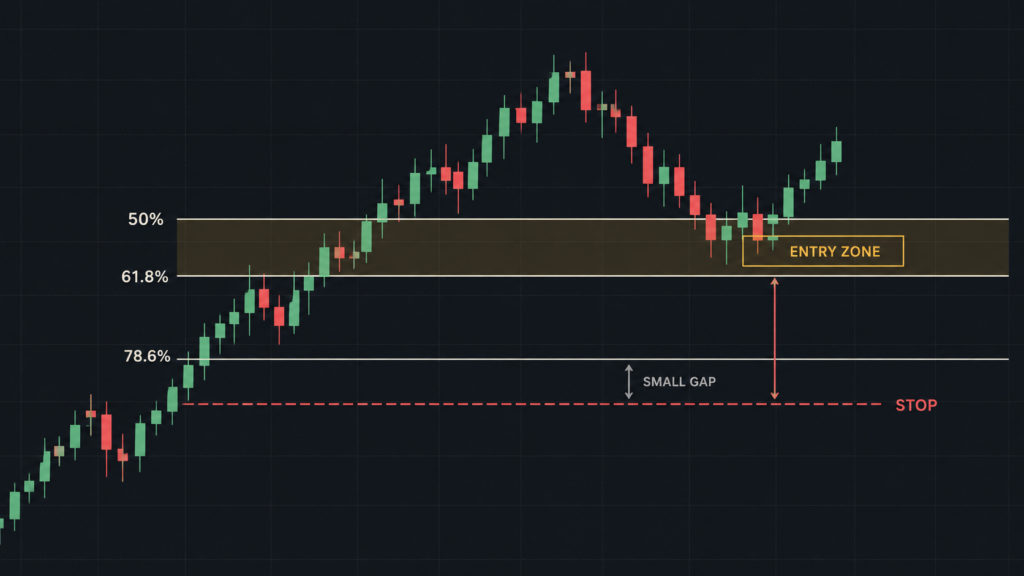
Treat the space between two levels as a zone. For example, the zone between 50% and 61.8% covers a middle-depth pullback.
Wait for a Candle to Confirm
A level on its own is not a reason to enter. Wait for the price to reach your zone.
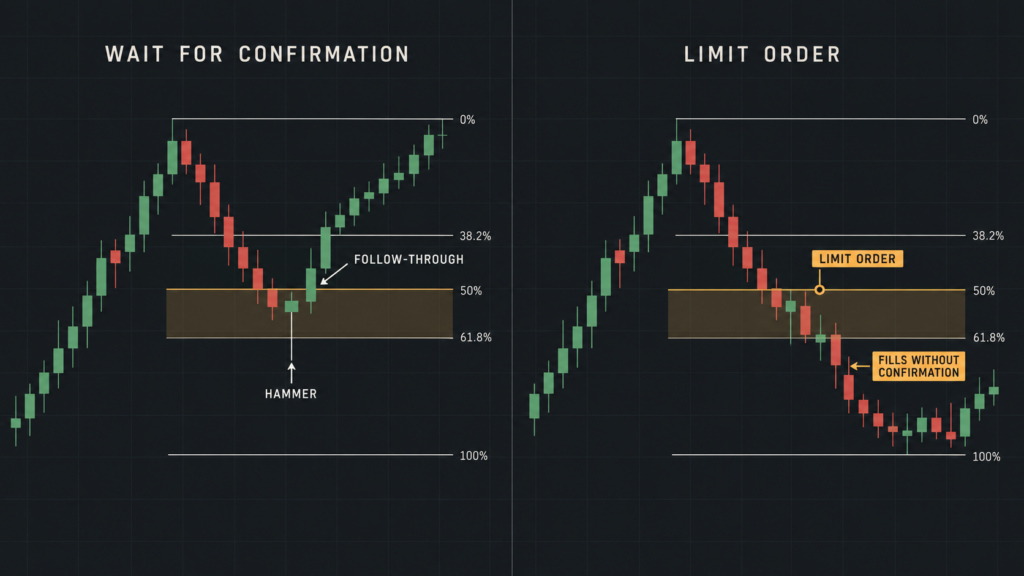
Then look for a candle that shows the pullback is slowing, such as a hammer or a candle that closes back in the trend direction.
The Hammer Candlestick Pattern Cheatsheet shows how to read these candles.
Another option is a limit order at a level, so price comes to you. This can get a better price, but it skips the confirming candle. The order fills even if the price keeps falling through the level. Why Set and Forget Trading Works covers this style.
Where to Put the Stop Loss
Place the stop beyond the next level past your entry zone.
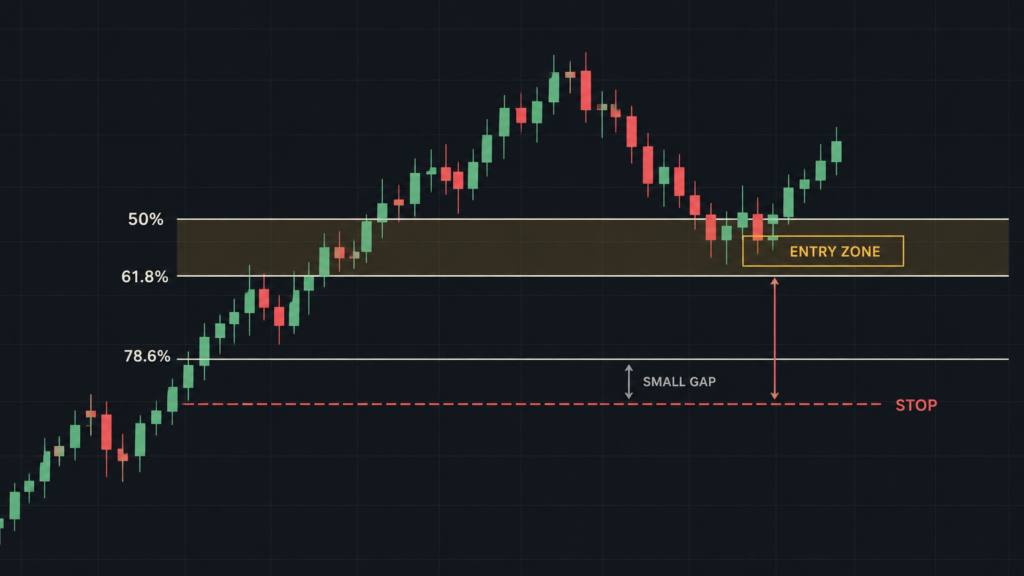
If you buy in the 50% to 61.8% zone, the stop can go just below 78.6%. Below 78.6%, the pullback has given back most of the move, and the reason for the trade is gone.
Do not place the stop right on a level. Price can poke past a line before it turns, so give the stop a small gap.
Setting a Target
One target is the end of the original move, where the 0% level sits. Place it a little before that level, since price can stall there.
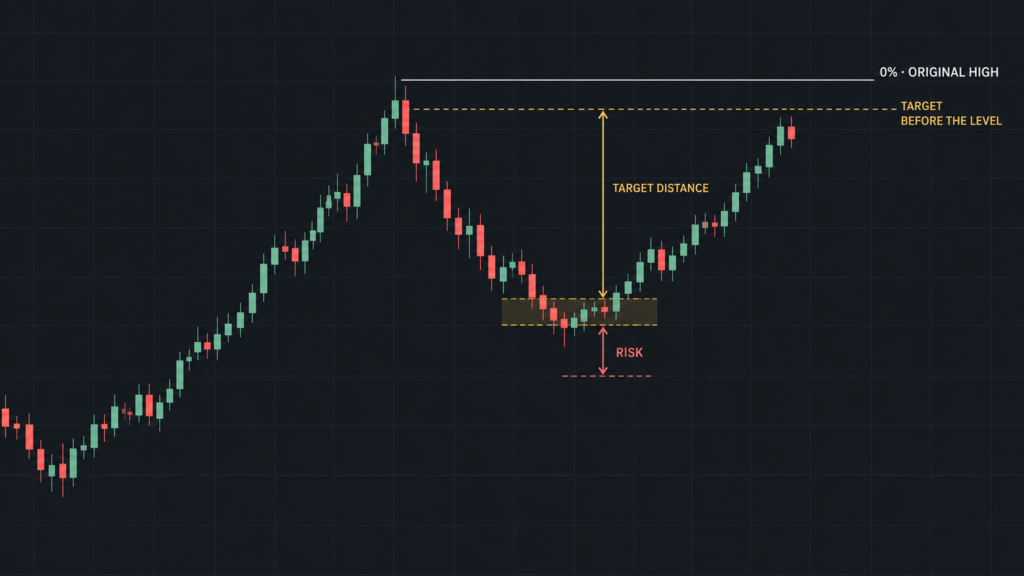
Before you enter, compare the pips at risk to the pips to your target.
Worked Example
The price levels below are for teaching only. They are not a forecast.
USD/JPY rises from a swing low at 148.00 to a swing high at 151.00 on the 4-hour chart. The move is 300 pips. You draw the tool from 148.00 to 151.00. The levels land at these prices:
- 38.2% at 149.85
- 50% at 149.50
- 61.8% at 149.15
- 78.6% at 148.64
Price pulls back into the 50% to 61.8% zone. It forms a hammer with a low of 149.20 and closes at 149.35. The next candle opens at 149.40, and you buy there.
The stop goes at 148.60, just below the 78.6% level. The target goes at 150.95, just under the swing high. You risk 80 pips to aim for 155 pips.
A stop can fill at a worse price than planned when price gaps or moves fast. Size your trade with that risk in mind.
Using Fibonacci With Other Tools
Check your Fibonacci zone against other tools on the chart. When two tools point to the same price area, you have more than one reason to trade it.
- Support and resistance: Look for a 61.8% level that sits on an old support level.
- Trend lines and channels: Look for a Fibonacci level that meets the lower line of an up channel. See [INTERNAL LINK: channel trading guide].
- RSI: An RSI reading that turns up as price reaches your zone can confirm the pullback is slowing. Read the Relative Strength Index (RSI) guide.
- Order blocks: Order Blocks Uncovered shows how to pair a Fibonacci zone with an order block.
When Fibonacci Retracement Does Not Work
The tool measures pullbacks inside a trend. In a sideways market, there is no clear move to measure, so the levels mean little.
Read Why Sideways Markets Can Break Traders for how to spot these conditions.
A very small swing gives levels that sit only a few pips apart. The spread can take up most of the space between them.
A fast, one-way move can also run straight through every level. In that case, the pullback may be the start of a new trend in the other direction.
Common Fibonacci Mistakes
- Moving the tool to fit the trade. Redraw only when the move makes a new high or low. Redrawing because price broke your level hides a failed setup.
- Showing too many levels. A chart with ten lines has a level near almost every price. Keep the levels you plan to trade and hide the rest.
- Measuring the whole trend instead of the last move. A tool drawn from the start of a long trend gives levels far from current price. Measure the most recent clear move.
Fibonacci Retracement FAQ
Which Fibonacci level is the most important?
No single level is proven to matter more than the others. This guide focuses on the zone from 38.2% to 61.8%, because it covers a middle-depth pullback.
What is the difference between retracement and extension?
Retracement levels sit inside the move, between 0% and 100%. They help you plan an entry on a pullback. Extension levels project past the end of the move. You can use them to plan targets beyond the old high or low. MT5 has a separate Fibonacci Expansion tool for this.
Does Fibonacci retracement work on all timeframes?
You can draw the tool on any timeframe. The levels work the same way, but a move on a low timeframe covers fewer pips. Test the tool on past charts before you trade it. How to Backtest a Trading Strategy shows you how.