

How to Draw and Trade Price Channels
Channel trading means buying and selling while price moves between two parallel lines. You buy near the lower line and sell near the upper line….

Channel trading means buying and selling while price moves between two parallel lines. You buy near the lower line and sell near the upper line. The lines also show you where your stop and target go, so you can plan the whole trade before you enter.
What Is Channel Trading?
A price channel has two lines that run side by side. The lower line joins the low points, and the upper line joins the high points. Price moves up and down between them.
Channel trading uses the lower line as a buy zone and the upper line as a sell zone. These lines only show where price turned in the past. Price can break through them at any time, so every channel trade needs a stop.
Up, Down and Flat Channels
- Up channel (ascending channel): Both lines point up. Price makes higher highs and higher lows.
- Down channel (descending channel): Both lines point down. Price makes lower highs and lower lows.
- Flat channel (horizontal channel): Both lines are level. Price moves sideways inside a range.
How to Draw a Price Channel
Start With the Trend Line
In an up channel, pick two clear swing lows. Draw a line through them and extend it to the right. In a down channel, do the same with two clear swing highs.
You can draw through the candle wicks or the candle bodies. Pick one and use it on every chart. If you switch between them, your lines will not match from one chart to the next.
Add the Parallel Line
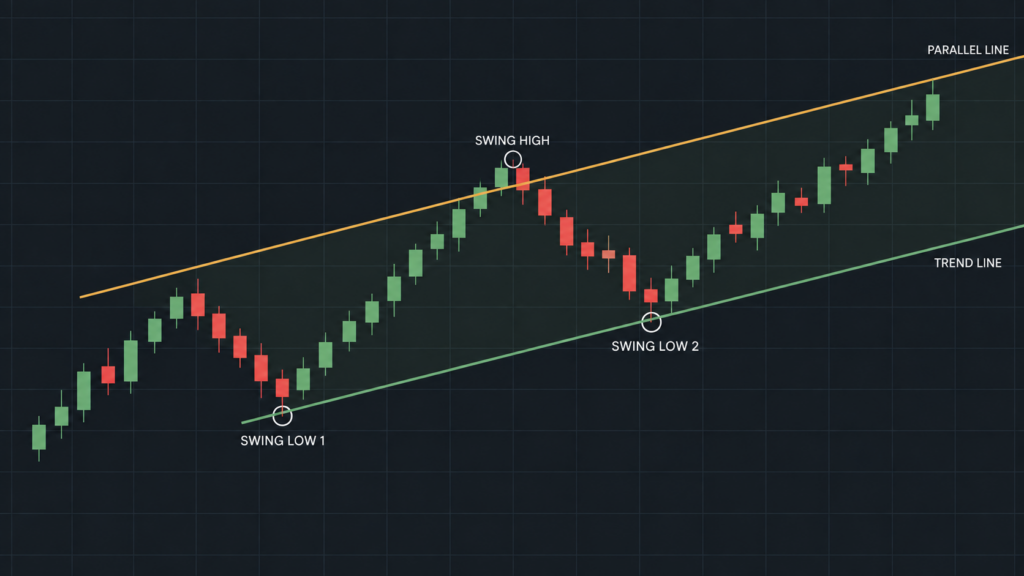
Copy the first line and move the copy to the other side of price. In an up channel, place it on the highest swing high between your two lows.
Both lines must keep the same angle. If they move closer together, the pattern is a wedge or a triangle. Those patterns break in different ways and need different trade plans.
Count the Touches
Two points make a line, but they do not confirm a channel. Wait for at least a third touch on either line. Each extra touch shows the lines have held again.
If you have to move a line to make it fit, do not force it. A channel you have to bend is not a channel.
How to Trade Inside a Channel
Trades against the channel direction bet on the trend turning, so they carry more risk. In an up channel, you look for buys near the lower line. In a down channel, you look for sells near the upper line.
Buying Near the Lower Line
Wait for price to reach the lower line. Then wait for a sign that buyers are stepping in, such as a long lower wick or a candle that closes back up. Entering before that sign means buying into a move that may keep falling.
A hammer candle is one sign to watch for at the lower line. See the Hammer Candlestick Pattern Cheatsheet to tell it apart from similar candles.
Here is an example. The price levels are for teaching only and are not a forecast.
EUR/USD is in an up channel on the 4-hour chart. At the time of entry, the lower line sits near 1.0850 and the upper line near 1.0950. Price drops to 1.0852 and forms a candle with a long lower wick.
You buy at 1.0860. The stop goes at 1.0830, below the wick and the line. The target goes at 1.0940, just under the upper line. You risk 30 pips to aim for 80 pips.
Selling Near the Upper Line
In a down channel, flip the steps. Wait for price to reach the upper line and close back down. Place the stop above the upper line and the target just above the lower line.
In an up channel, selling at the upper line goes against the trend, so it carries more risk. You can use the upper line to take profit on a buy instead.
Trading a Flat Channel
A flat channel has no trend, so buys and sells carry the same weight. Use the same steps at both lines. Keep in mind that a flat channel can end with a sharp move in either direction.
Some pairs hold a range better than others. Read Best Forex Pairs to Trade to see how pair volatility affects range trading.
Where to Put Your Stop Loss and Take Profit
Price often pokes past a line before it turns back. A stop placed right on the line can close a trade that would have worked. So put the stop outside the channel, with a gap.
One way to size that gap is the Average True Range (ATR). ATR is an indicator that shows the average size of recent candles. If the 4-hour ATR is 20 pips, a gap of half the ATR is 10 pips beyond the wick.
Place the target a little inside the far line. Price can turn before it touches the line, and a target just inside it has a better chance to fill.
Then check the trade before you enter. Add the spread to your stop distance, and compare that total to the pips to your target. If the target is not larger than the risk, the channel may be too narrow to trade.
A channel gives you all three levels before you enter. If you like to place the entry, stop and target at once and then leave the trade alone, read Why Set and Forget Trading Works.
Size the Trade From the Stop
A wide channel needs a wide stop, and a narrow channel needs a narrow stop. For the same dollar risk, a wider stop means a smaller position.
Here is a hypothetical example. You plan to risk $100 on one trade. With a 50-pip stop, each pip can be worth $2. With a 25-pip stop, each pip can be worth $4. The dollar risk is the same in both trades.
For more on how trade size and account balance fit together, read What Is Leverage in Trading?.
Channel Breakouts: What Happens When Price Leaves
A channel breakout happens when a candle closes outside one of the lines. After that, the reason for trading inside the channel is gone. If you still hold a trade, it now has no channel behind it.
Your stop sits outside the channel to limit the loss when a breakout goes against you. A stop can fill at a worse price than planned when price gaps or moves fast. Size your trade with that risk in mind.
False Breakouts
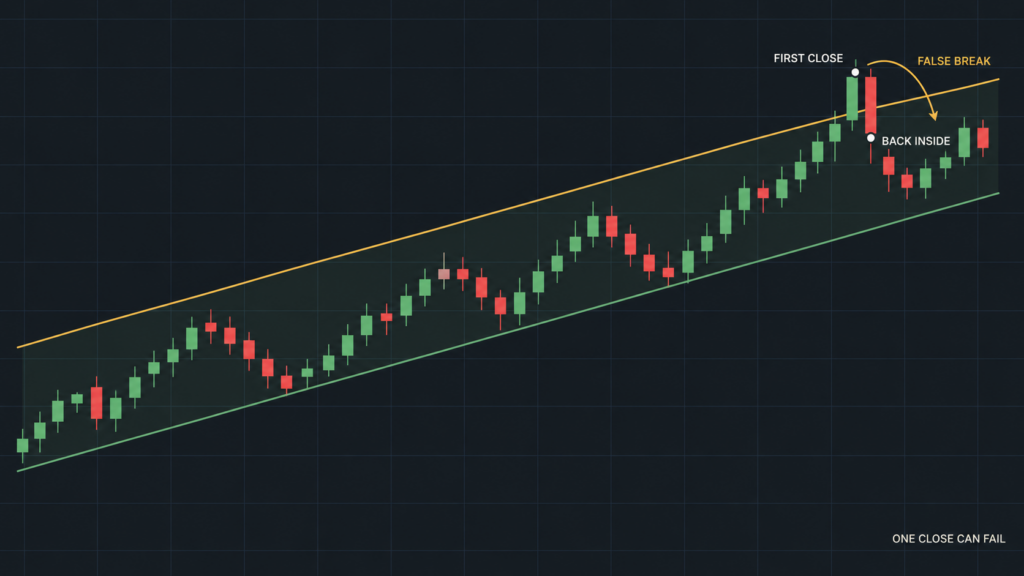
Sometimes price closes outside the channel and then moves straight back in. This is a false breakout. It can stop out a trade that would have reached its target.
Waiting for a second candle to close outside the line filters out some false breakouts. It also means you enter later, at a worse price. No filter removes the risk.
The Retest After a Break
After a confirmed breakout, price can come back to the broken line. A broken lower line can then act as resistance, and a broken upper line can act as support. A retest can offer a new entry, but it is a new trade with its own stop and target.
Common Channel Trading Mistakes
- Entering in the middle of the channel. Your stop sits outside one line and your target inside the other. From the middle, the risk can be larger than the target.
- Ignoring the higher timeframe. A 15-minute up channel can sit inside a daily down trend. Check the bigger chart before you trade the smaller one.
- Trading a channel too narrow for the spread. On a narrow channel, the spread takes a large share of the target. Add it to your risk before you enter.
- Adding trades to win back a loss. Each new trade adds to your total open risk. Read Trading Psychology During Challenge Drawdowns to see how this pattern builds.
Channel Trading FAQ
What if my lines are not quite parallel?
Small differences happen, because price does not move in perfect lines. If the gap between the lines shrinks or grows clearly over time, treat it as a wedge or a widening pattern. It is not a channel, and the steps in this guide do not apply.
What timeframe works for channel trading?
Any timeframe works, but match it to how long you hold trades. A channel on a 4-hour chart suits trades held for days. A channel on a 15-minute chart suits trades held for hours, and the spread takes a bigger share of each move.
Are indicator channels the same thing?
No. Donchian channels, Keltner channels and Bollinger Bands build their lines from a formula. This guide covers channels you draw by hand from swing highs and lows.
When you are ready to trade channels on a funded account, compare the FXIFY programs and check the rules for each one.