

Wyckoff Distribution Explained: Phases, Events and How to Trade It
Wyckoff distribution is a range that forms at the top of an uptrend before price turns down. Wyckoff’s model reads the range as a series…
Wyckoff distribution is a range that forms at the top of an uptrend before price turns down. Wyckoff’s model reads the range as a series of events, in a set order. The trade setup only appears late in the range, in Phase D.
What Is Wyckoff Distribution?
Richard Wyckoff was a trader and writer in the early 1900s. He studied how prices move when supply and demand shift. Later Wyckoff teachers turned his ideas into the schematic and the event names used in this guide.
In Wyckoff’s model, a distribution range is where large sellers unload positions after an uptrend. Price moves sideways while this happens. When the selling is done, price breaks down and a downtrend starts.
The Four Parts of the Market Cycle
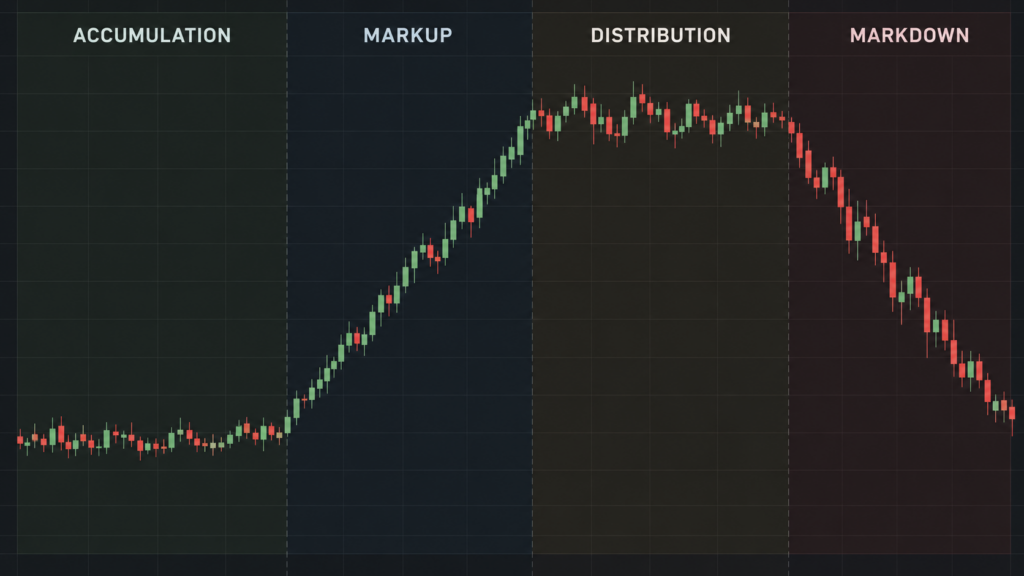
The model splits the market cycle into four parts:
- Accumulation: A range at the bottom, before price rises.
- Markup: The uptrend.
- Distribution: A range at the top, before price falls.
- Markdown: The downtrend.
This guide covers distribution, the third part.
The Composite Man Is a Model, Not a Fact
Wyckoff asked traders to picture the market as if one large player, the Composite Man, controlled it. The idea helps you read each move as a step in a plan.
Treat this as a way of thinking, not a fact about any trader in the market. You cannot see who is buying or selling on a retail chart. You can only see price and volume.
Wyckoff Distribution Events in Plain Words
Each event has a short name. This table gives each one in plain words.
| Event | Full name | What it means |
|---|---|---|
| PSY | Preliminary supply | The first sharp drop or stall in the uptrend, with a rise in volume. |
| BC | Buying climax | A sharp push up to a new high, then a turn down. |
| AR | Automatic reaction | The fast drop after the BC. Its low sets the bottom of the range. |
| ST | Secondary test | A rally back toward the BC high that fails. |
| UT | Upthrust | A move above the top of the range that falls back inside. |
| UTAD | Upthrust after distribution | An upthrust in Phase C, near the end of the range. |
| SOW | Sign of weakness | A strong drop to or below the bottom of the range. |
| LPSY | Last point of supply | A weak rally that fails below the last rally high. It shows up late in the range. |
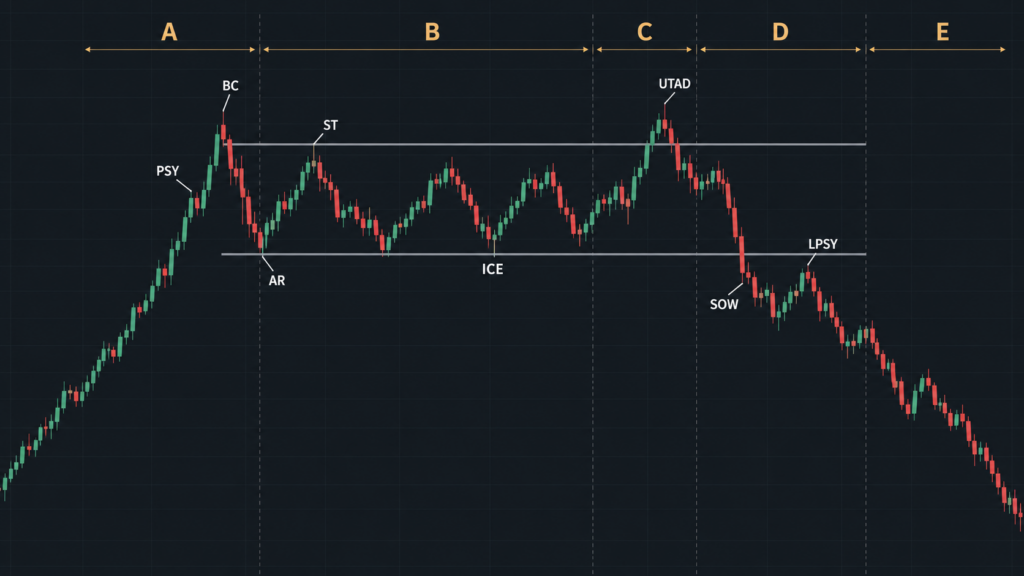
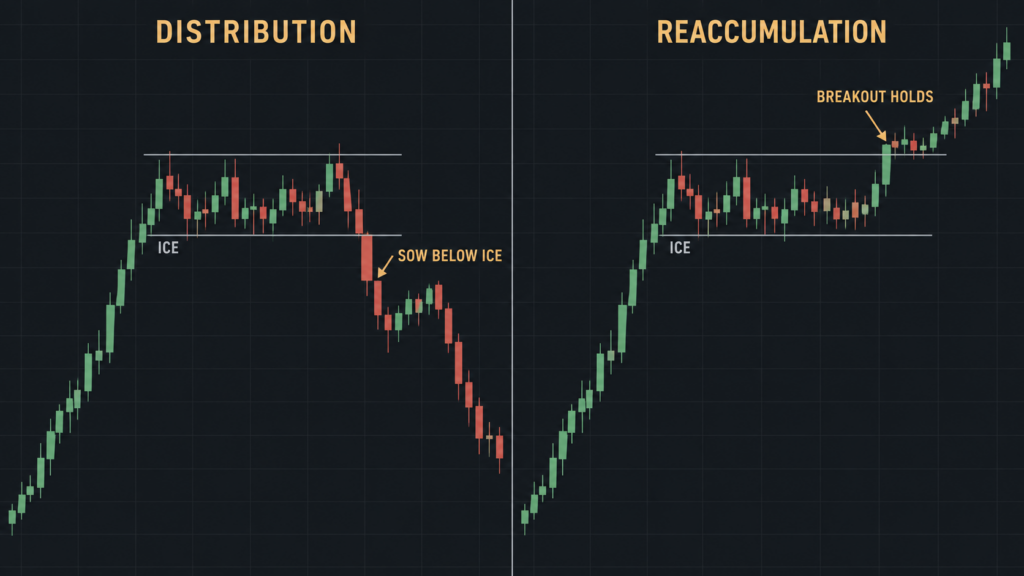
The bottom of the range is called the ice. It is the support line set by the AR low.
The Five Phases of Wyckoff Distribution
Phase A: The Uptrend Stops
PSY shows the first heavy selling. The BC pushes to a new high, and then the AR drops sharply. The ST rallies back toward the high and fails. The range now has a top and a bottom.
Phase B: The Range Builds
Price moves up and down inside the range. This phase can last longer than the others. There can be upthrusts above the top and drops toward the ice. In the model, this is where most of the selling takes place.
Phase C: The Test Above the Range
In Schematic 1, price makes a UTAD. It breaks above the top of the range, then falls back inside. The move above the range fails to hold.
Not every distribution range has a UTAD. This is the main difference between the two schematics below.
Phase D: Weakness Shows
Price falls to or through the ice with a SOW. Rallies after that are weak. Each one that fails below the last rally high is an LPSY.
Phase E: The Markdown Begins
Price leaves the range and the downtrend starts. Rallies are small and fail below the old ice.
Wyckoff Distribution Schematic 1 vs Schematic 2
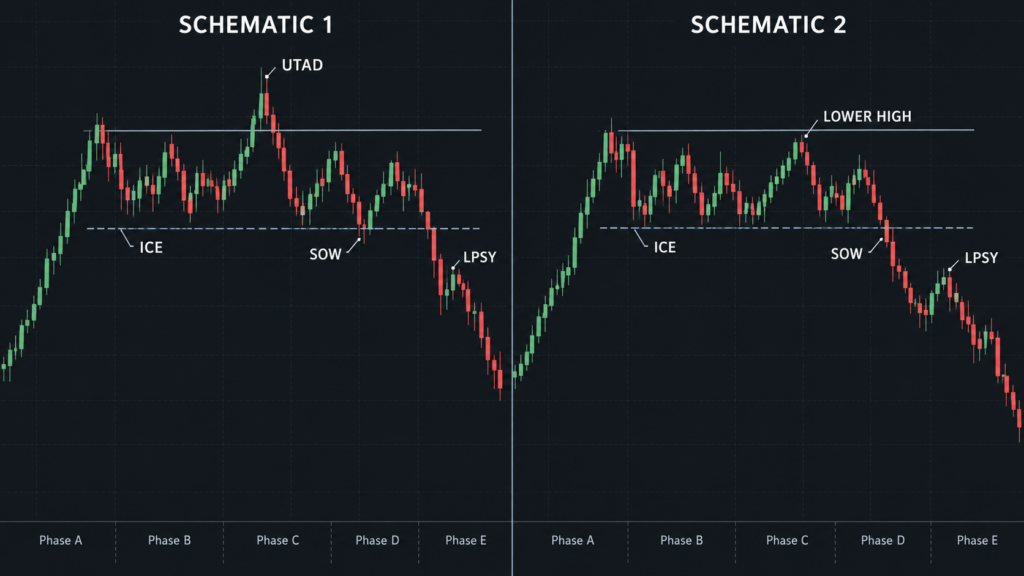
There are two versions of the distribution schematic.
- Schematic 1: Phase C has a UTAD above the range.
- Schematic 2: There is no UTAD. The test in Phase C is a rally that fails below the top of the range. This lower high acts as an early LPSY.
Both lead to the same Phase D and E. If you wait for a UTAD that never comes, you can miss a Schematic 2 setup.
Reading Volume on Forex and CFD Charts
Wyckoff built his method on stock charts, where volume shows how much was traded. On forex and CFD charts, the volume you see is tick volume. It counts how many times price changed, not how much was bought or sold.
Tick volume can still show when activity rises or falls. In the model, a BC and a SOW come with high activity. A rally with low activity after a SOW fits an LPSY.
Read tick volume as a clue, not proof. Put more weight on price structure: where the range sits, and whether rallies fail lower. See How to Use the Volume Indicator for more on reading volume.
How to Trade Wyckoff Distribution
Why You Wait for Phase D
A range at the top of an uptrend can still break up. Until Phase D, you cannot tell distribution from a pause in the uptrend. Selling in Phase A or B is a guess about which way the range will break.
In Phase D, price has fallen to or through the ice, and rallies are failing. This is the first phase where the chart supports the distribution idea.
Entry on an LPSY
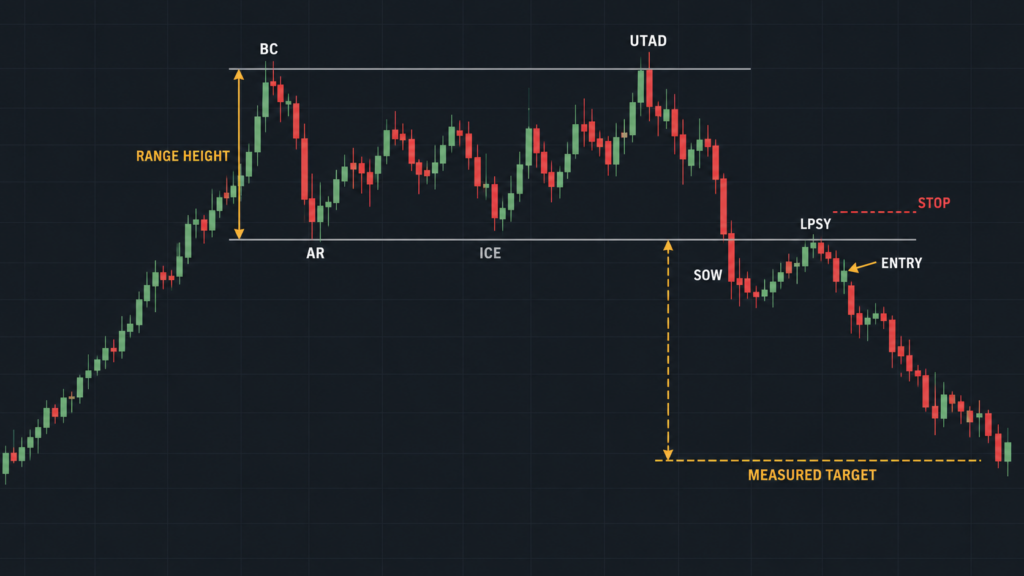
After the SOW, wait for a rally. If it fails lower down, it is an LPSY. Look for a candle that closes back down, then sell at the open of the next candle.
In Schematic 1, the UTAD can also give a short entry when price falls back inside the range. This entry carries more risk. You cannot be sure an upthrust is the UTAD until Phase D follows it.
Where to Put the Stop Loss
Place the stop above the high of the LPSY, with a small gap. The distribution idea as a whole fails if price closes back above the UTAD high. If there was no UTAD, use the top of the range.
Work out your trade size from the stop distance. How to Calculate Position Size on a Funded Account shows how.
A stop can fill at a worse price than planned when price gaps or moves fast. Size your trade with that risk in mind.
Setting a Target
Measure the height of the range, from the BC high to the ice. Subtract that height from the ice. This gives a measured target below the range. Wyckoff teachers also use a point and figure count for targets, which this guide does not cover.
Worked Example
The prices below are for teaching only. They are not a forecast.
AUD/USD rises on the daily chart. The BC reaches 0.6800. The AR drops to 0.6640, which sets the ice. The range is 160 pips tall.
Later, price makes a UTAD to 0.6830 and closes back inside at 0.6780. Then a SOW breaks below the ice and closes at 0.6610.
Price rallies back just above the ice, to 0.6655, then a candle closes back down at 0.6632. This is the LPSY. The next candle opens at 0.6630, and you sell there.
The stop goes at 0.6665, above the LPSY high. For the target, subtract 160 pips from the ice at 0.6640. That gives 0.6480. You risk 35 pips to aim for 150 pips.
Distribution vs Reaccumulation: When the Range Breaks Up
A range after an uptrend can also be reaccumulation. In the model, this is a pause where buyers add to their positions before the uptrend carries on.
Early on, the two look the same. The difference shows late in the range:
- Distribution: Price falls through the ice with a SOW, and rallies fail lower.
- Reaccumulation: Price holds above the ice and breaks up through the top of the range.
If price closes above the UTAD high and holds there, stop reading the range as distribution. With no UTAD, use the top of the range.
A UTAD is a failed breakout above the range. What If the Charts Are Lying? A Guide to False Breakouts explains how failed breakouts work. For trading the range itself in Phase B, see the Range Trading Guide for Funded Traders.
Common Wyckoff Distribution Mistakes
- Selling the buying climax. The BC looks like a top, but it only starts the range. Price can spend a long time moving sideways, or break up later.
- Treating each upthrust as the UTAD. Upthrusts above the range are normal in Phase B. Selling each one means selling inside a range that has not yet shown weakness.
- Expecting every range to match the schematic. Ranges on a chart can skip events or add extra tests. Use the schematic as a guide to the order of events, not as a template.
Wyckoff Distribution FAQ
What is the difference between Wyckoff distribution and accumulation?
Accumulation is a range at the bottom of a downtrend, before price rises. Distribution is a range at the top of an uptrend, before price falls. The events mirror each other. For example, a spring below the range in accumulation matches the UTAD above the range in distribution.
Is a UTAD the same as a false breakout?
A UTAD is one kind of false breakout. Price breaks above the range, then falls back inside. What makes it a UTAD is its place in the schematic. It comes in Phase C, after the range has formed.
Does the Wyckoff method work on forex?
You can apply the method to forex and CFD charts. The main difference is volume. You only have tick volume, so price structure carries more of the weight. Test the method on past charts before you trade it with How to Backtest a Trading Strategy.