

Range Trading Guide for Funded Traders
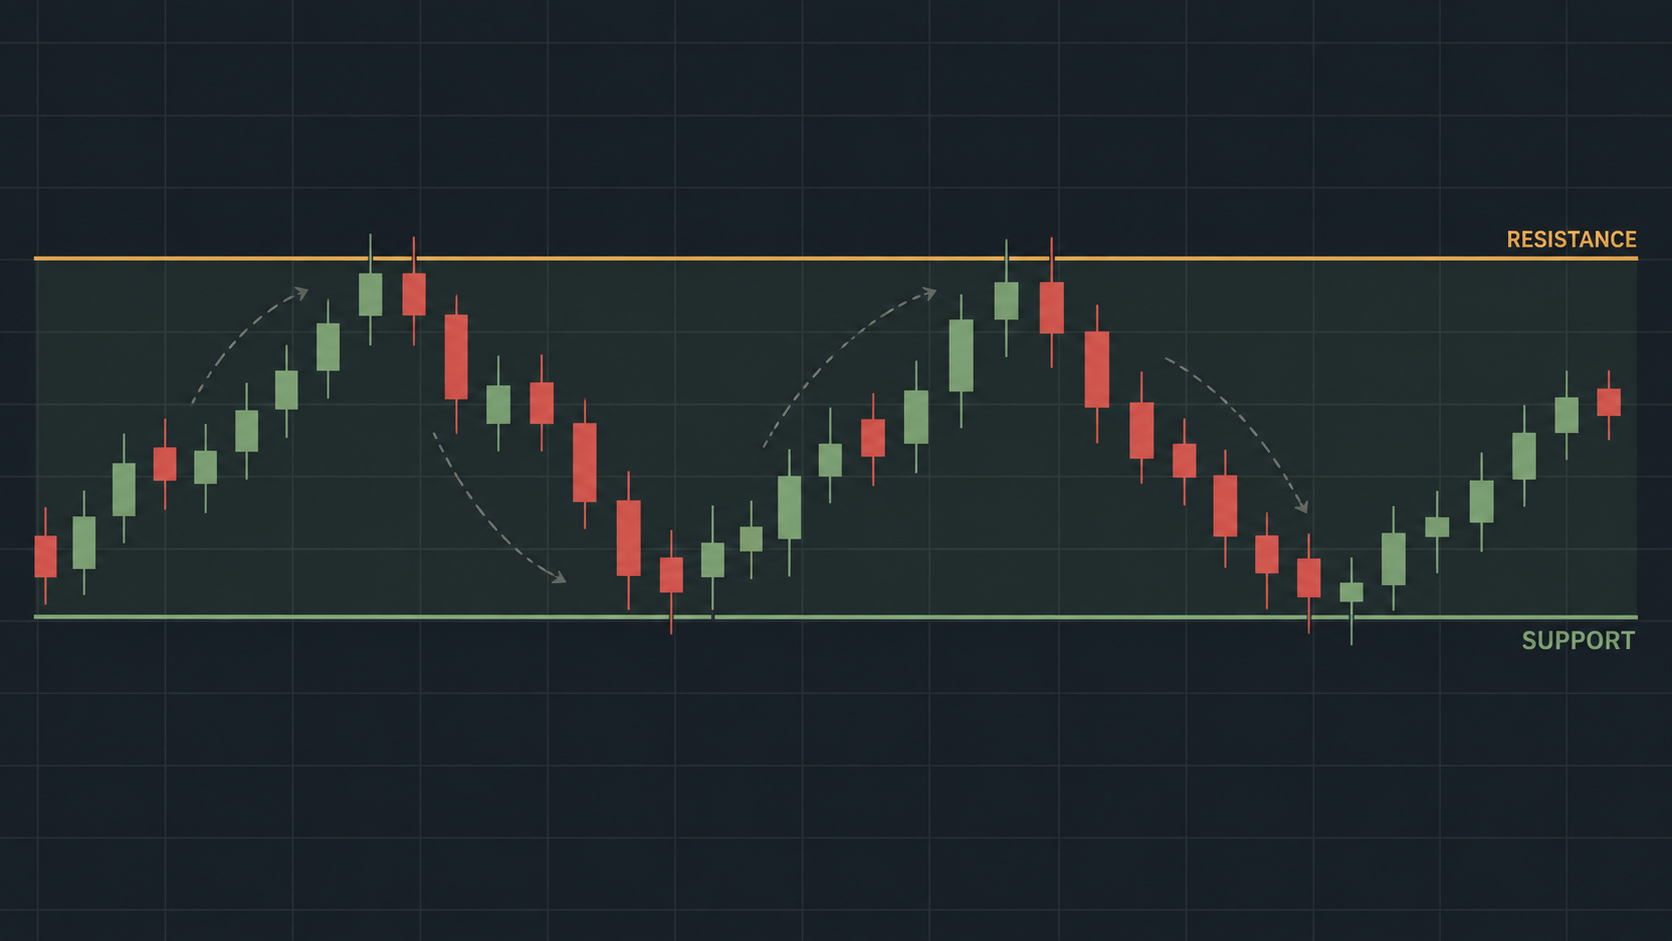
What a Trading Range Looks Like A trading range forms when price moves sideways, not up or down. The top is called resistance, where price…
What a Trading Range Looks Like
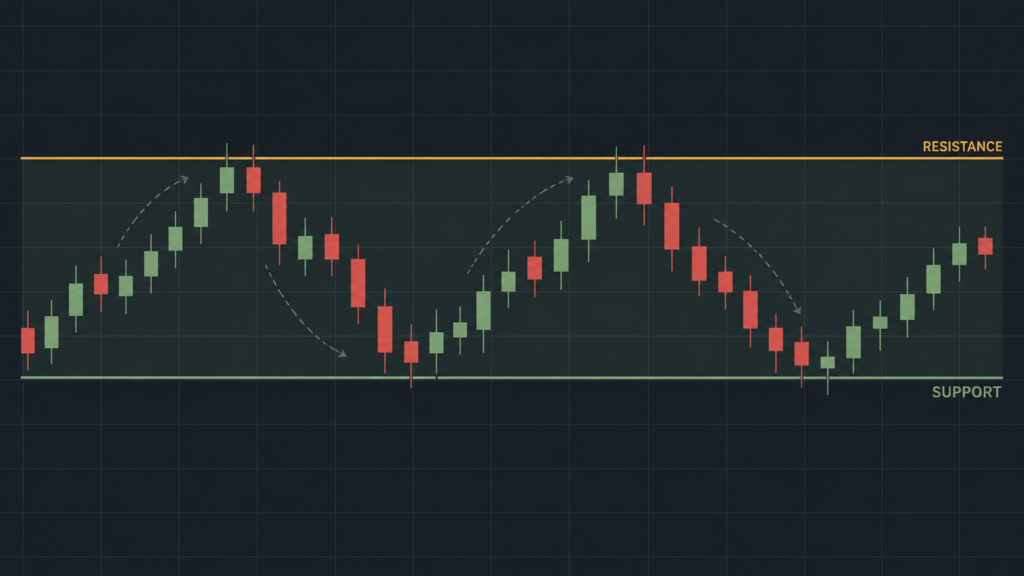
A trading range forms when price moves sideways, not up or down. The top is called resistance, where price often stops rising. The bottom is called support, where price often stops falling.
Price moves back and forth between these levels. This can last for hours, or for weeks, depending on the market.
How to Spot a Range
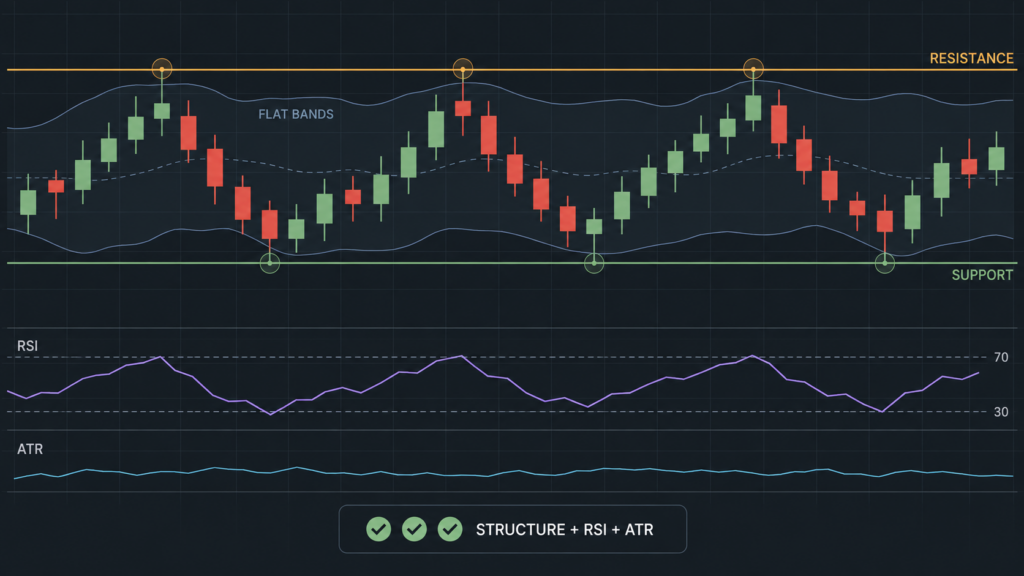
Look for price highs and lows that keep repeating near the same level. Draw a line across the highs and another across the lows. If price keeps bouncing between these lines, you may have found a range.
A few tools can help confirm what you are seeing:
- Bollinger Bands. The bands run flat, and price bounces between the top and bottom band.
- RSI (Relative Strength Index). A reading above 70 can mean price is close to resistance. Below 30 can mean it is close to support.
- ATR (Average True Range). A low, steady ATR shows small, steady price moves, which fits a range.
No single tool proves a range on its own. Use two or three signals together before you act.
How to Enter and Exit a Range Trade
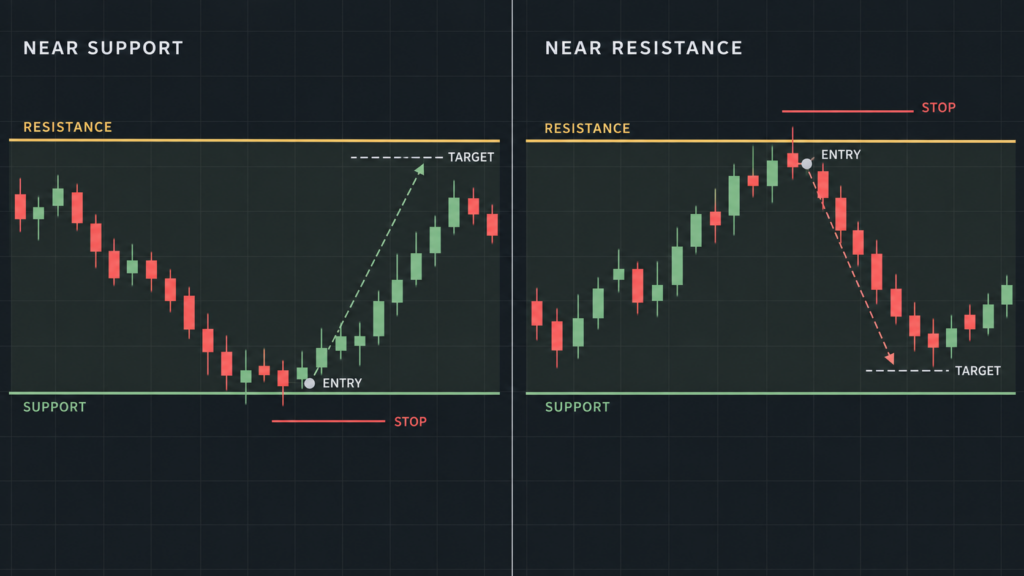
Buy near support when you expect price to bounce up. Sell near resistance when you expect it to drop back down.
Set your exit before you open the trade. Place your stop-loss just outside the range, and your take-profit near the opposite side.
This gives you a clear risk and a clear target on every trade. Neither should change once the trade is open.
Manage Your Risk Inside a Range
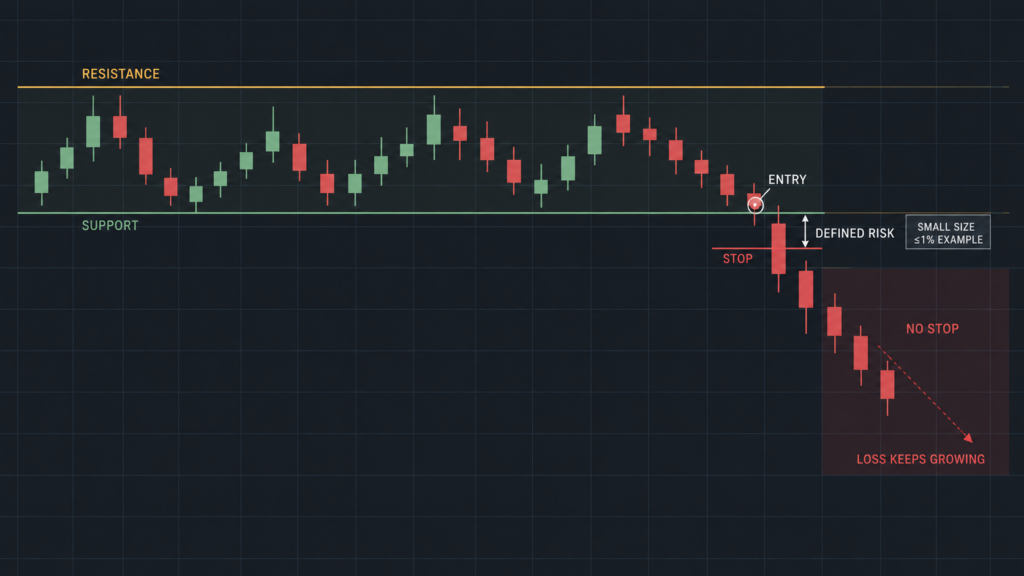
A range can look safe, since price stays between two known levels. This can be misleading. A range can hold for weeks and then break without warning.
Keep your position size small, so one failed trade does not damage your account. Many traders risk one percent or less on a single trade.
Always use a stop-loss. Without one, a single breakout can erase gains from several good trades.
What Happens When a Range Breaks
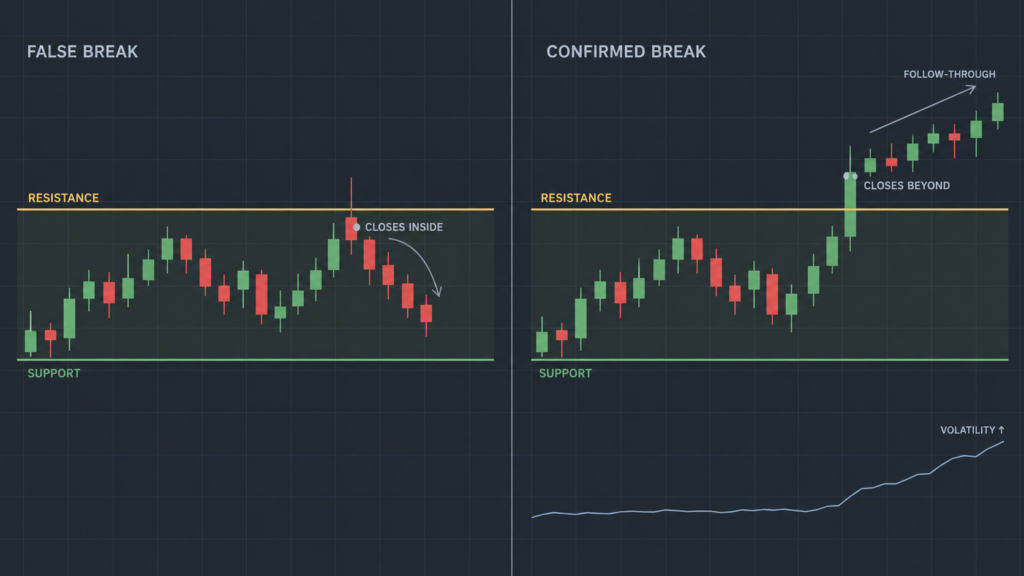
A range does not last forever. At some point, price pushes through support or resistance and starts a new trend. Traders call this a breakout.
False breakouts happen often. Price appears to break the range, then reverses and moves back inside. This can trigger your stop-loss right before price moves the way you expected.
To reduce this risk, wait for a candle to close beyond the range. Do not react to the first touch of the level.
Volatility tends to rise once the range breaks and a new trend starts. A range strategy usually needs to stop or adjust at this point.
Range Trading and Your Funded Account
Funded accounts have daily and maximum drawdown limits, and these limits differ by program. Check the exact figures on the FXIFY programs page.
Range trading can fit well inside these limits, since risk per trade tends to stay small. This is a feature of the strategy, not a guarantee of lower risk on any given program.
Confirm your daily loss limit and maximum drawdown before you trade. Do this whether you use a range strategy or any other approach.
Final Point
Range trading means buying support and selling resistance inside a clear price band. It depends on clear levels, a stop-loss on every trade, and a plan for when the range breaks.
No strategy removes risk. Range trading, like every other approach, carries the risk of losing capital. Past price behavior does not guarantee future results.