





Falling Wedge Pattern (Descending Wedge): How to Spot and Trade It
A falling wedge pattern forms when price moves down between two falling lines that get closer together. Each new low drops less than the high…
A falling wedge pattern forms when price moves down between two falling lines that get closer together. Each new low drops less than the high before it, so the range gets smaller. It is a bullish pattern, and the trade comes when price closes above the upper line.
What Is a Falling Wedge Pattern?
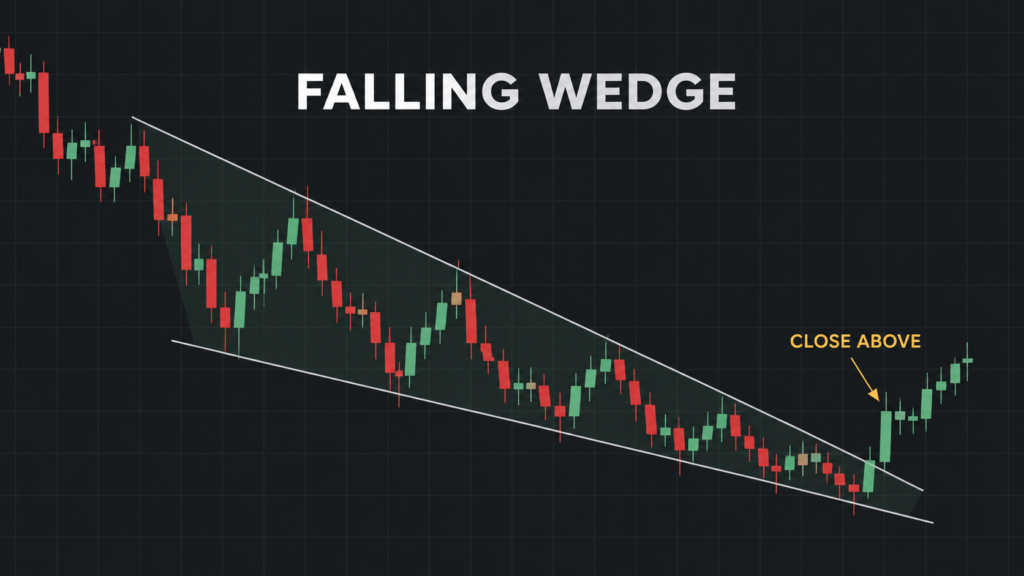
A falling wedge has two lines that both point down. The upper line joins the lower highs. The lower line joins the lower lows. The two lines meet at a point on the right.
The falling wedge is also called a descending wedge. It is the mirror image of the rising wedge pattern, which is a bearish pattern.
Which Line Is Steeper, and Why It Matters
In a falling wedge, the upper line falls faster than the lower line. That is what makes the lines meet.
If the lower line were the steeper one, the lines would spread apart as they move right. That shape is a widening pattern, not a wedge, and the trade plan in this guide does not apply to it. Check the angles before you call a pattern a falling wedge.
The steeper upper line shows how the range shrinks. Each high comes in well below the last one, but each low only drops a little.
A Falling Wedge Inside an Uptrend
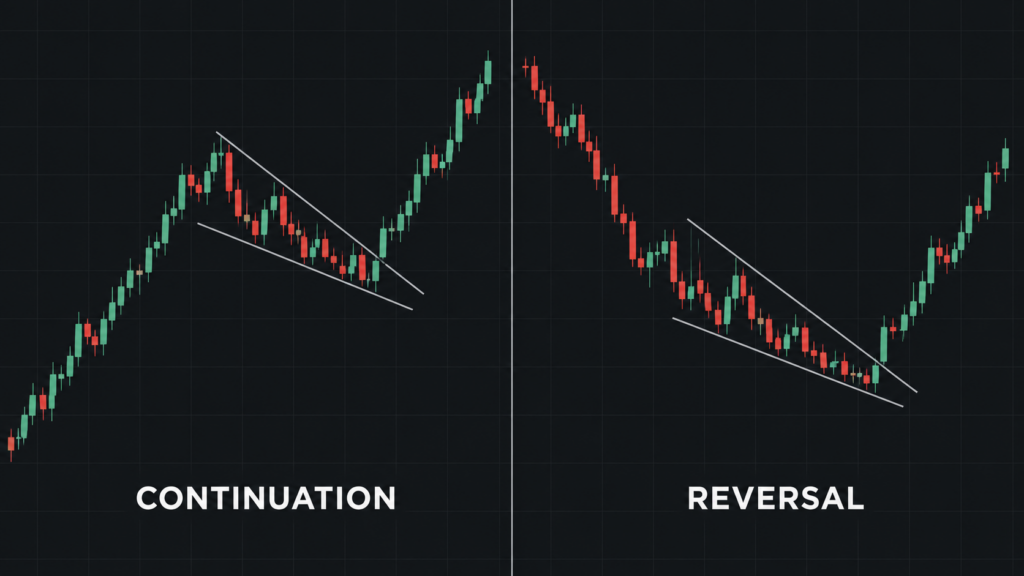
Price has been rising. Then it pulls back inside a falling wedge. When price closes above the upper line, the uptrend can carry on. This is a continuation setup.
This is the case the worked example below uses. The trade goes in the same direction as the bigger trend.
A Falling Wedge After a Downtrend
Price has been falling for some time. The drops get shorter and a falling wedge forms. A close above the upper line can signal the end of the downtrend. This is a reversal setup.
A reversal trade goes against the trend that came before it. It carries more risk than a continuation trade, because you are betting that the whole trend has turned.
How to Spot a Falling Wedge
Touches and Line Placement
Draw the upper line through at least two lower highs. Draw the lower line through at least two lower lows. This guide uses five touches in total as the minimum, with at least two on each line.
Use wicks or candle bodies for your touch points, and keep the same method on every chart. If a line only fits after you move it through the middle of several candles, the pattern is not clean enough to trade.
What Volume and RSI Can Show You
Volume can shrink as the wedge narrows, and then rise on the breakout. A rise in volume on the break shows more activity behind the move. On forex and CFD charts, including gold, volume is tick volume. It counts price changes, not traded amounts. Read How to Use the Volume Indicator for more.
RSI can show bullish divergence inside a falling wedge. Price makes a lower low, but RSI makes a higher low. The indicator shows the drop slowing before price does. See the Relative Strength Index (RSI) guide and the MACD Indicator Guide for how to spot divergence.
Falling Wedge vs Bull Flag vs Descending Triangle
These three patterns can all form after a move and slope down. The lines tell them apart.
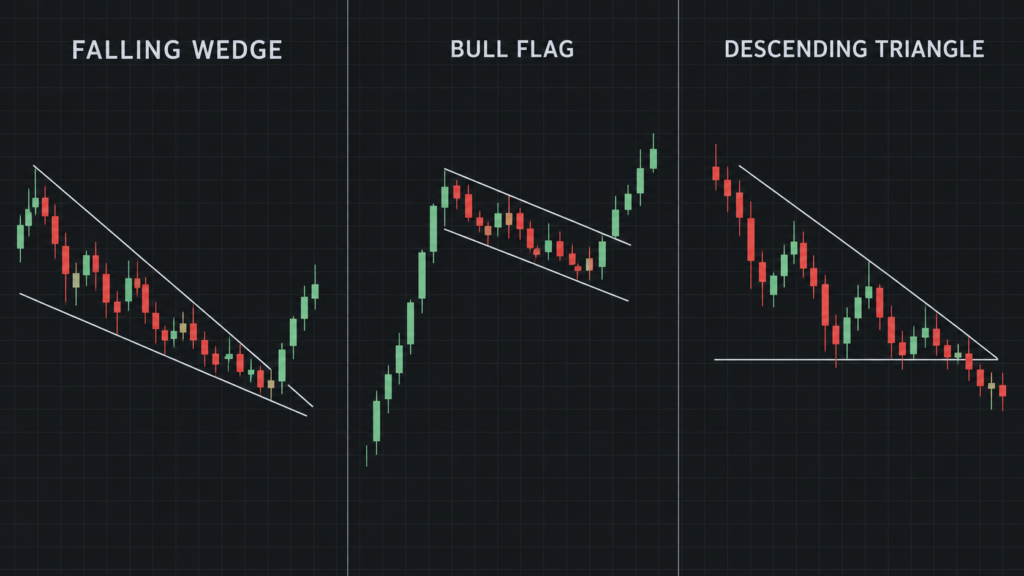
- Falling wedge: Both lines point down and move closer together. The upper line is steeper. It is a bullish pattern.
- Bull flag: A sharp move up, then a short pullback between two parallel lines. The lines do not meet. It is a bullish pattern, traded on a break above the upper line like the falling wedge.
- Descending triangle: The lower line is flat and the upper line points down. Price keeps hitting the same low. It is a bearish pattern.
A down channel also slopes down, but its lines run parallel and stay the same distance apart. See How to Draw and Trade Price Channels for how to trade it.
How to Trade a Falling Wedge Pattern
Entry on a Close Above the Upper Line
A falling wedge breakout happens when a candle closes above the upper line. A wick that pokes above and closes back inside does not count. Once the candle closes, you can buy at the open of the next candle.
Buying at the lower line while price is still inside the wedge is a guess. The wedge can keep falling, or break down instead.
Entry on the Retest
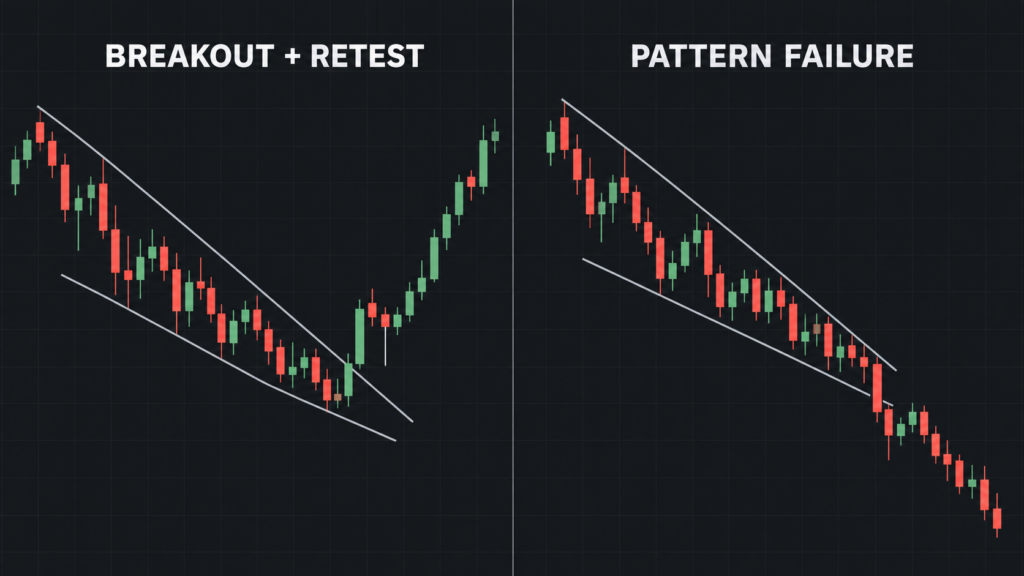
After the breakout, price can drop back to the broken upper line. That line can now act as support. If price touches it and turns up, you can buy there. A hammer candle at the retest is one sign that buyers are stepping in. The Hammer Candlestick Pattern Cheatsheet shows how to read it.
This entry can give a better price and a tighter stop. Price does not always come back, so you may miss the move.
If the breakout candle is very large, your entry sits far above the line. The stop then has to be wide. Waiting for a retest is one way to avoid that.
Where to Put the Stop Loss
Place the stop below the last swing low inside the wedge, with a small gap. If you enter on the retest, you can place it below the low of the retest instead.
A stop can fill at a worse price than planned when price gaps or moves fast. Size your trade with that risk in mind.
How to Set a Target
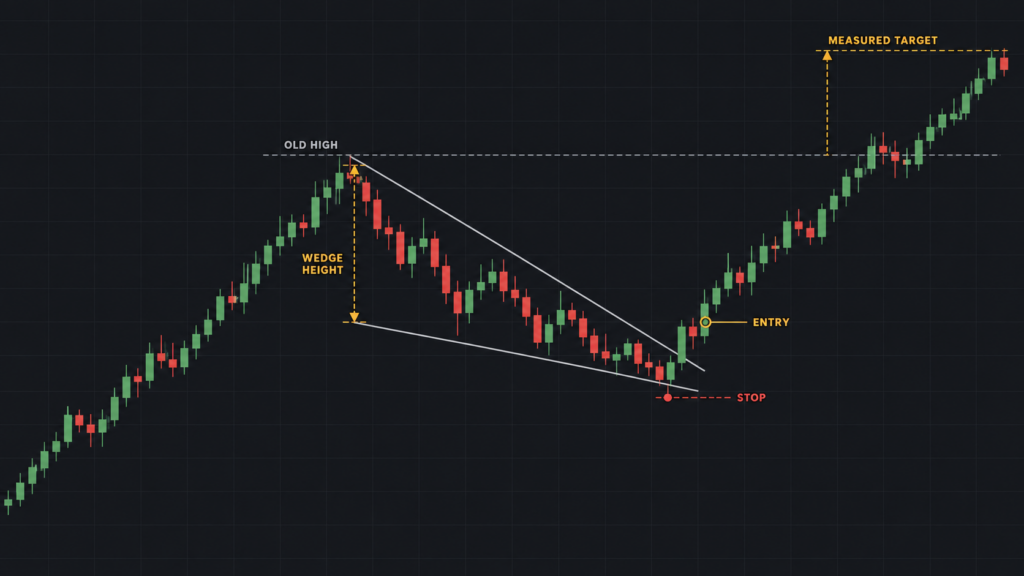
Measure the height of the wedge at its widest point, on the left where the pattern starts. Add that height to the price where the breakout happened. This is the measured move.
Also mark the high where the wedge began. In an uptrend pullback, that is the old high of the trend. Price can stall at that level before it reaches the measured target.
Worked Example
The prices below are for teaching only. They are not a forecast. Gold prices are shown in dollars, so the example uses dollar amounts.
XAU/USD is in an uptrend on the 4-hour chart. It pulls back from a high of $4,200 inside a falling wedge. At the widest point, the upper line sits at $4,200 and the lower line at $4,100. The wedge is $100 tall.
By the end of the pattern, the upper line has dropped to about $4,140 and the lower line to about $4,090. The last swing low inside the wedge is $4,092. A candle closes above the upper line at $4,146. The next candle opens at $4,147, and you buy there.
The stop goes at $4,088, below the last swing low. For the target, add the $100 height to the breakout price of $4,146. That gives $4,246. You risk $59 to aim for $99.
The old high at $4,200 sits between your entry and your target. Price can stall there, so decide before you enter whether you will take part of the trade off at that level.
When a Falling Wedge Fails
If a candle closes below the lower line, the pattern has failed. The bullish plan no longer applies.
A breakout can fail too. Price closes above the upper line, then drops straight back inside the wedge. This is a false breakout, and it is the reason your stop is in place. What If the Charts Are Lying? A Guide to False Breakouts covers ways to filter them.
Common Falling Wedge Mistakes
- Measuring the target at the narrow end. The wedge is thinnest near the point where the lines meet. Measuring there gives a target far too close. Measure at the widest point, on the left.
- Reading a descending triangle as a falling wedge. If the lower line is flat, the pattern is a descending triangle, which is bearish. Buying its upper line puts you on the wrong side. Check that both lines slope down.
Falling Wedge FAQ
Is a falling wedge bullish or bearish?
A falling wedge is a bullish pattern. Price can still break down through the lower line, so every falling wedge trade needs a stop.
What happens if price reaches the point where the lines meet?
If price drifts all the way to the point where the lines meet without a clear break, the pattern loses its meaning. There is no longer a narrowing range to break out of. Treat it as a failed setup and wait for a new pattern.
Can a falling wedge line up with a Fibonacci level?
Yes. A falling wedge inside an uptrend is a pullback, so you can measure it with the Fibonacci retracement tool. A wedge that ends inside the 38.2% to 61.8% zone gives you two tools pointing to the same area. See Fibonacci Retracement Tool: How to Draw and Use It. Test any setup on past charts first with How to Backtest a Trading Strategy.