


Rising Wedge Pattern: How to Spot and Trade It
A rising wedge pattern forms when price climbs between two rising lines that move closer together. Price is still making higher highs, but each push…
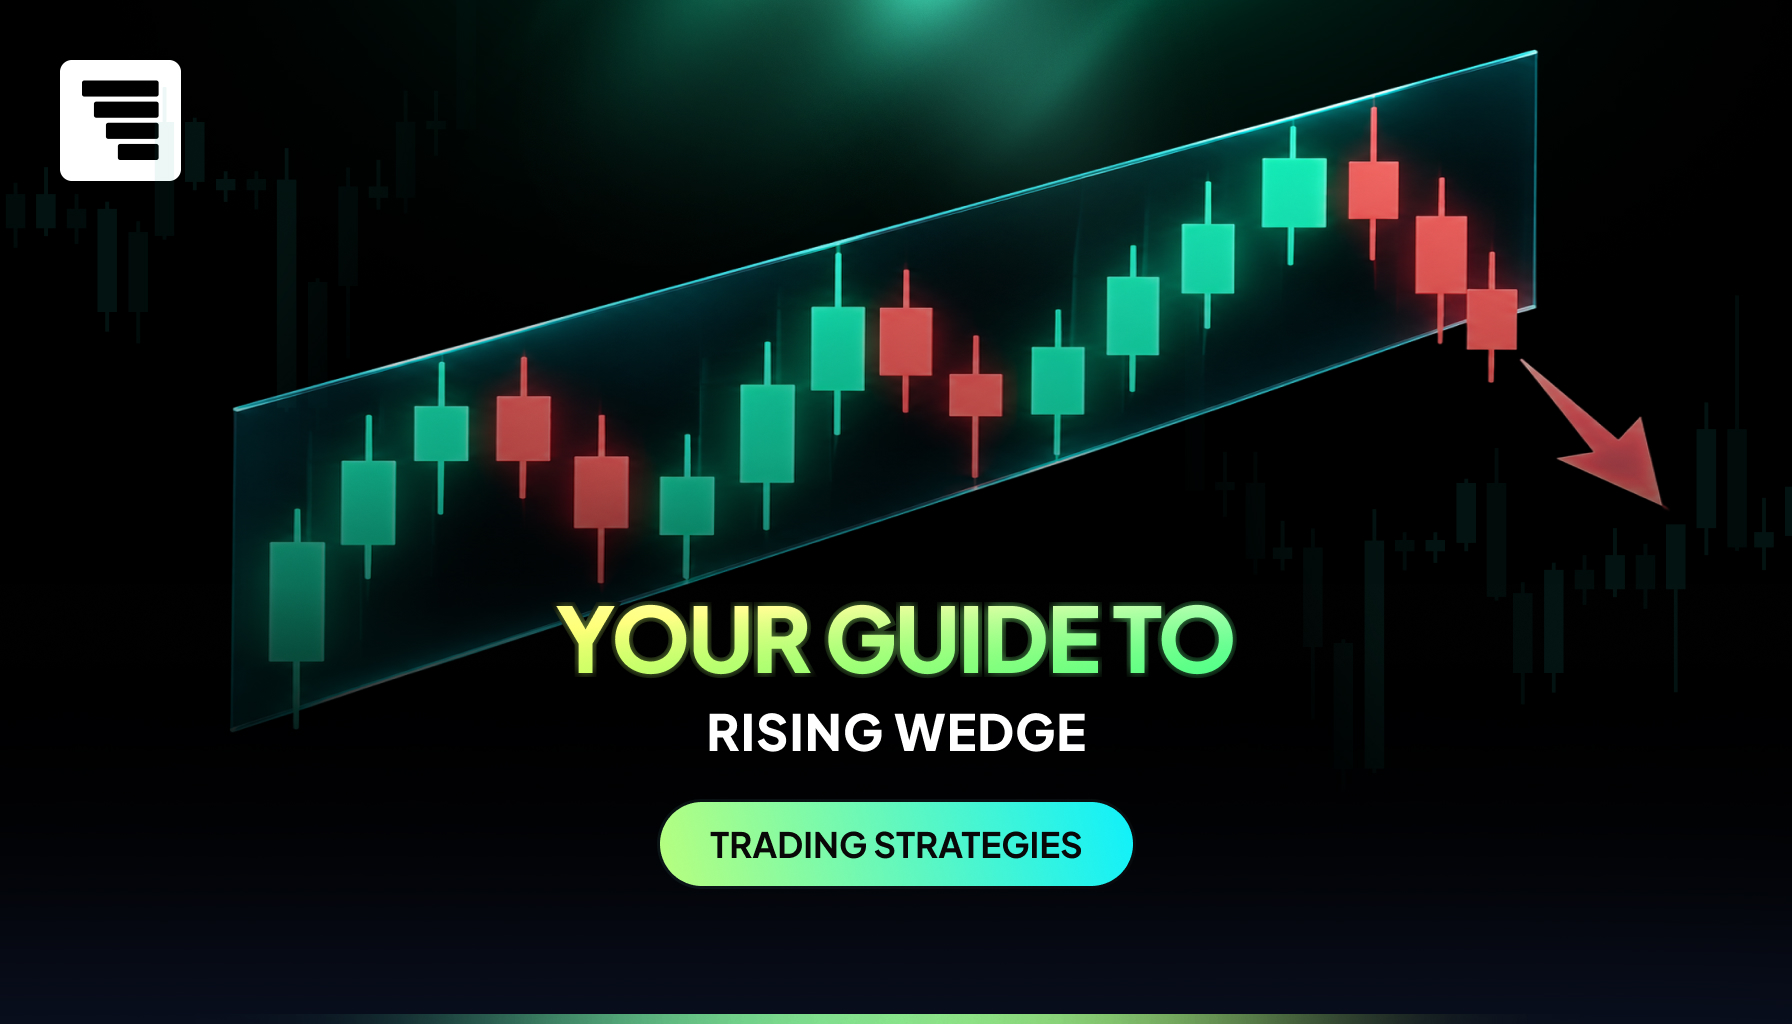
A rising wedge pattern forms when price climbs between two rising lines that move closer together. Price is still making higher highs, but each push up is smaller than the one before. It is a bearish pattern. A break below the lower line can mark the end of the move up.
What Is a Rising Wedge Pattern?
A rising wedge has two lines that both point up. The lower line joins the higher lows. The upper line joins the higher highs. The lower line rises faster than the upper line, so the two lines meet at a point on the right.
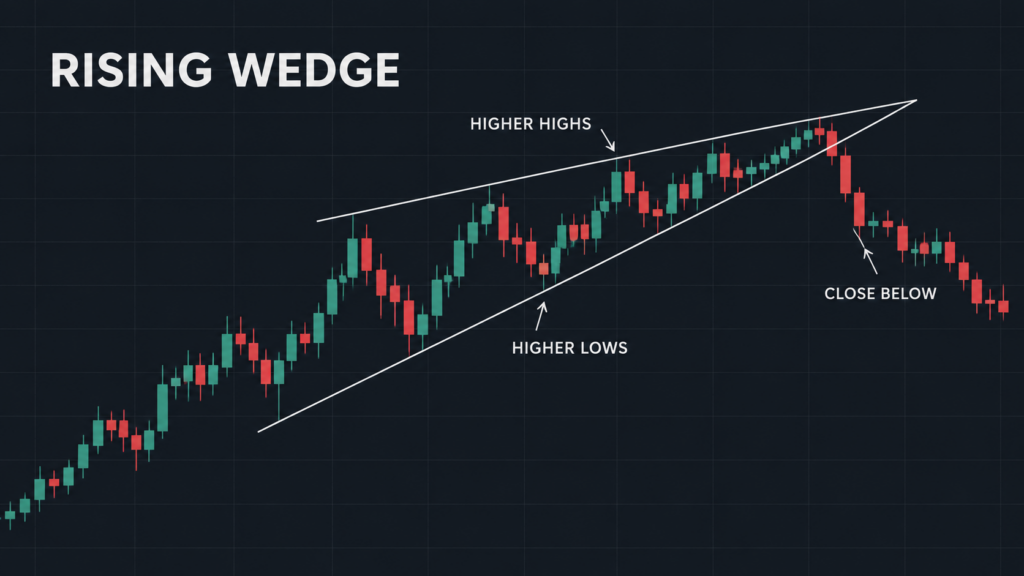
The shape shows the range getting smaller. Each low is higher than the last, but each new high adds less distance. Price is still rising, but each swing covers less ground. When price closes below the lower line, the pattern is complete.
The rising wedge is also called an ascending wedge. It can form in two places on a chart.
A Rising Wedge After an Uptrend
Price has been rising for some time. Then the moves up get shorter and the pattern narrows.
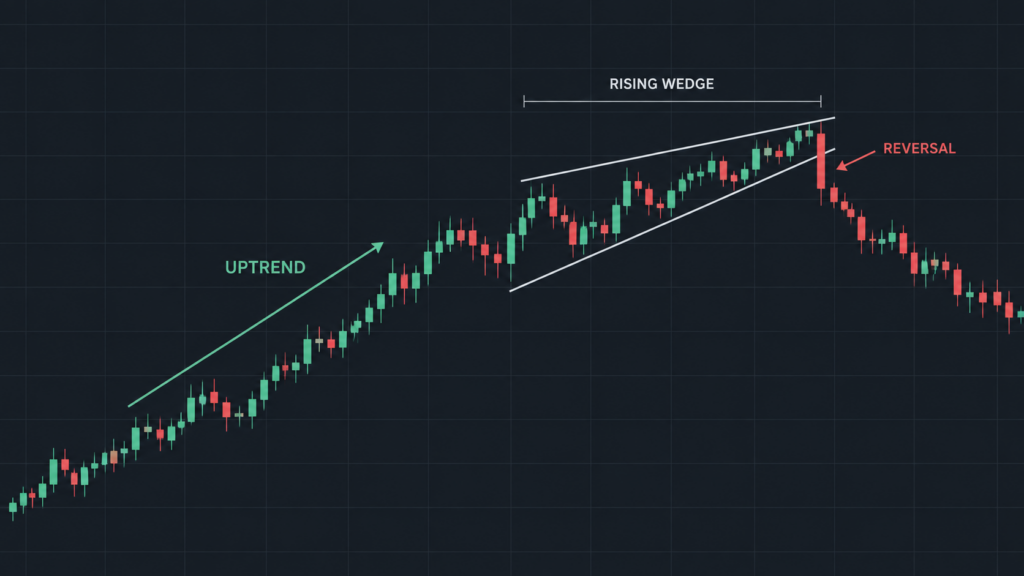
A break below the lower line can signal the end of the uptrend. This is a reversal setup.
A Rising Wedge Inside a Downtrend
A rising wedge can also form as a bounce inside a falling market. Price drops, then climbs back up inside a narrowing wedge. When the lower line breaks, price can return to the downtrend. This is a continuation setup.
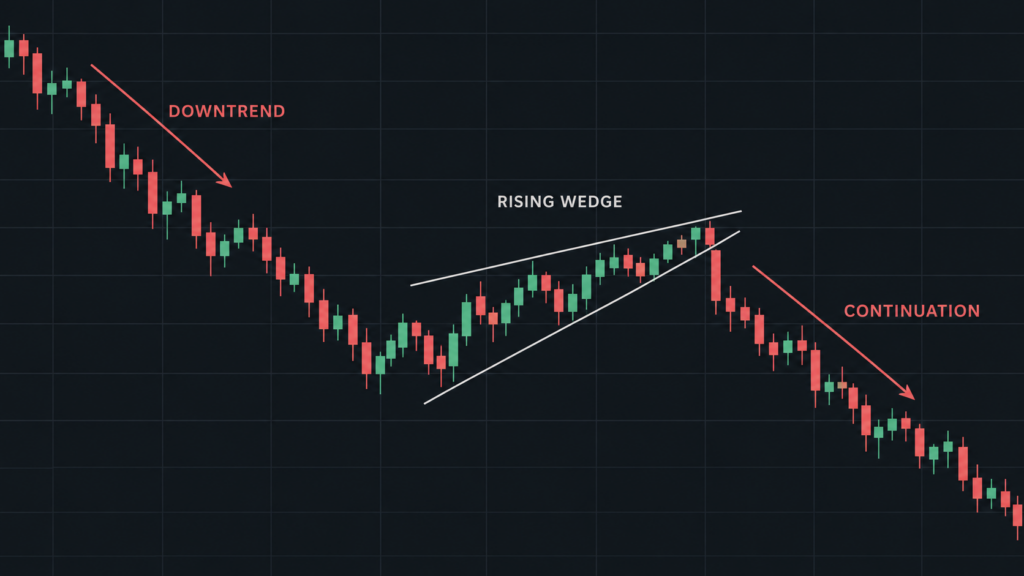
Both cases have the same shape and the same trade. The difference is what came before the wedge.
How to Spot a Rising Wedge
Two Rising Lines That Move Closer Together
Draw a line through at least two higher lows. Then draw a line through at least two higher highs. If both lines point up and the gap between them shrinks, you have a rising wedge.
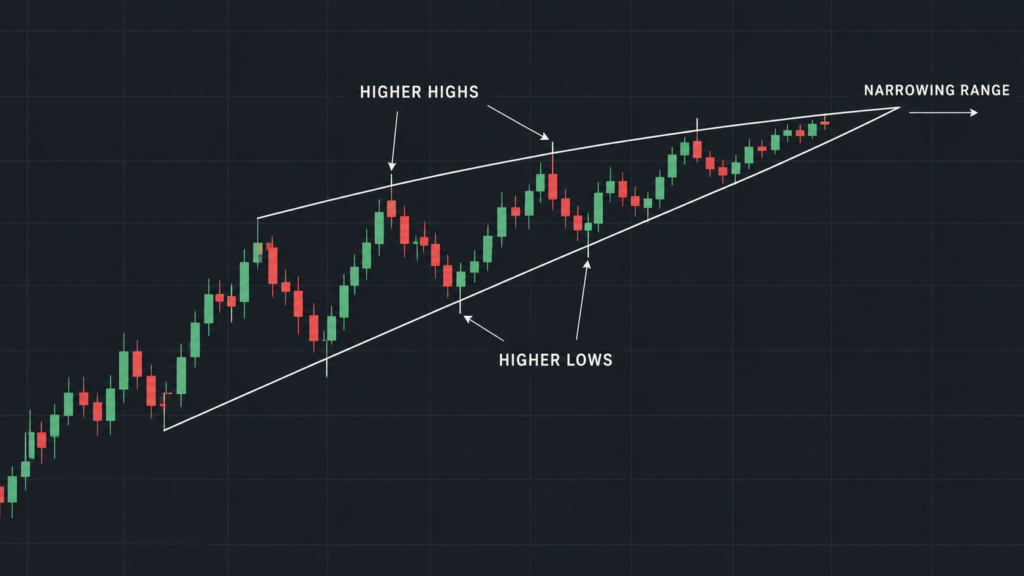
Draw the lines through wicks or through candle bodies. Choose one method and use it on every chart, so your patterns stay the same from one chart to the next.
How Many Touches You Need
Two touches make a line. This guide uses five touches as the minimum for the whole pattern, with at least two on each line. With fewer touches, the shape may only be a short pause in the trend.
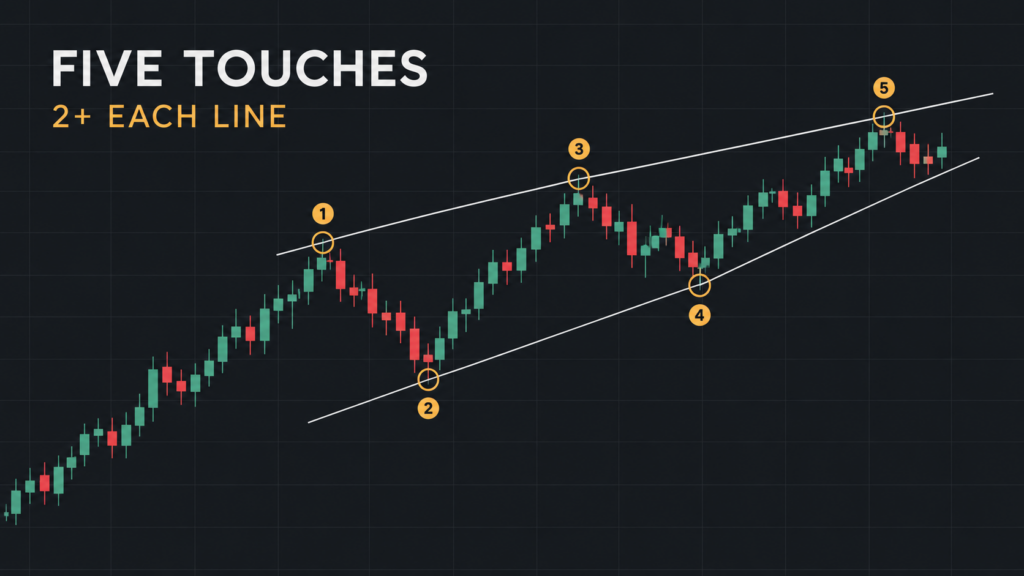
If you have to bend a line to make the pattern fit, do not force it. Wait for a clearer shape.
What Volume Can Show You
Volume can fall as the wedge narrows. This fits the idea that buyers are losing interest. A pick-up in volume on the breakdown adds weight to the move.
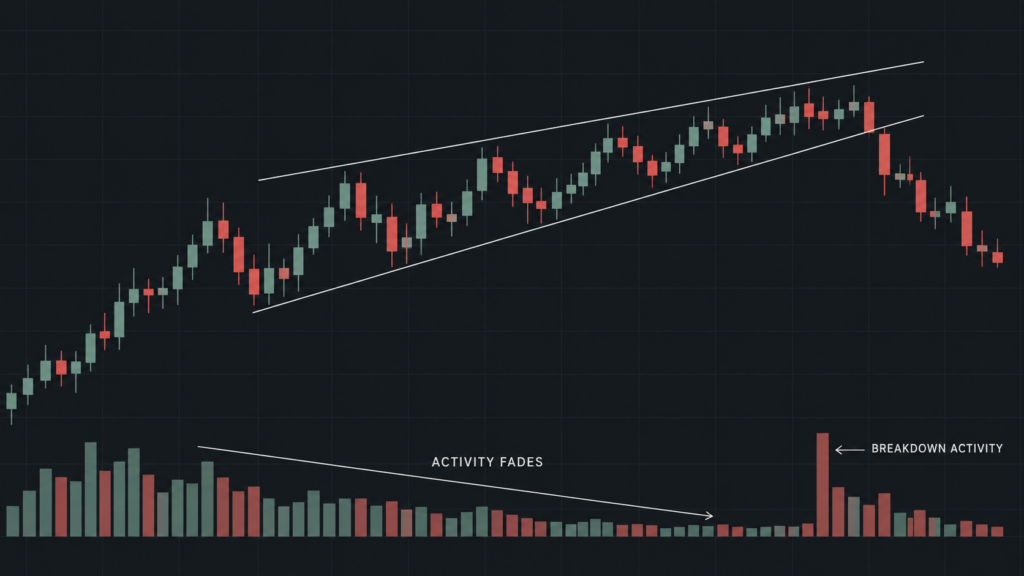
In forex, the volume on your chart is tick volume. It counts how many times price changed, not how much was traded. It can still show you when activity rises or falls. Read How to Use the Volume Indicator for more on reading it.
Rising Wedge vs Channel vs Ascending Triangle
These three patterns can look alike at first. The angle of the lines tells them apart.
- Rising wedge:
Both lines point up and move closer together. The lower line is steeper.
- Up channel:
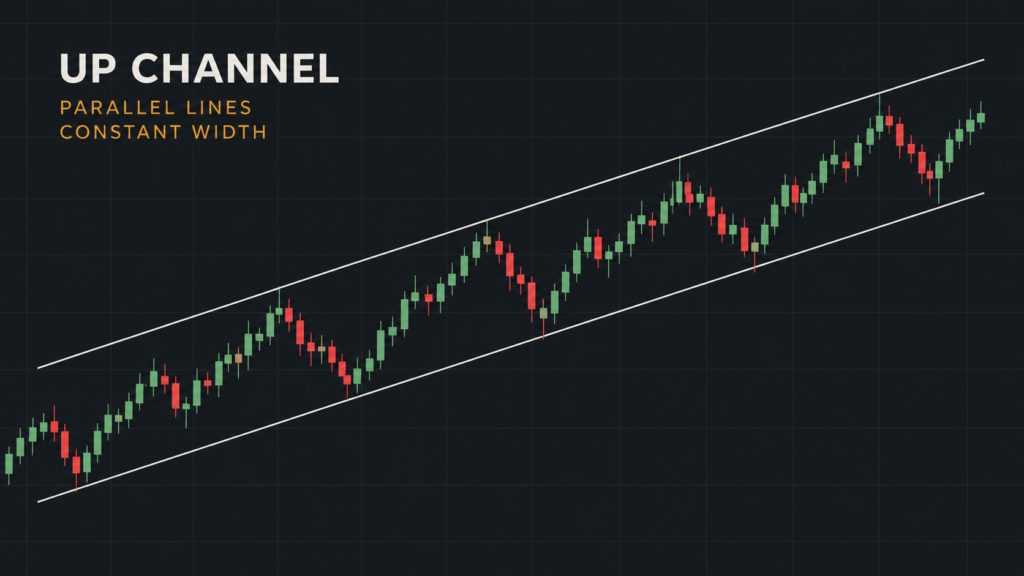
Both lines point up at the same angle. The gap between them stays the same. See channel trading guide to learn how to trade it.
- Ascending triangle:
The upper line is flat and the lower line points up. Price keeps hitting the same high.
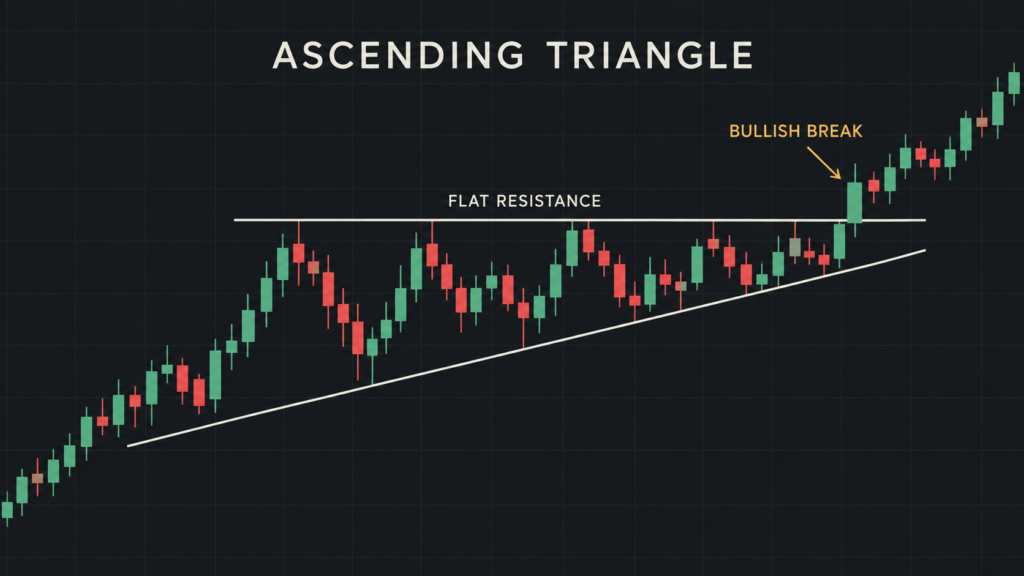
An ascending triangle is a bullish pattern that points to a break up through its flat top. A rising wedge is a bearish pattern that points to a break down through its lower line. Mixing them up can put you on the wrong side of the trade.
How to Trade a Rising Wedge Pattern
Entry on a Close Below the Lower Line
A rising wedge breakout happens when a candle closes below the lower line. A wick that pokes below the line and closes back inside does not count. Once the candle closes, you can sell at the open of the next candle.
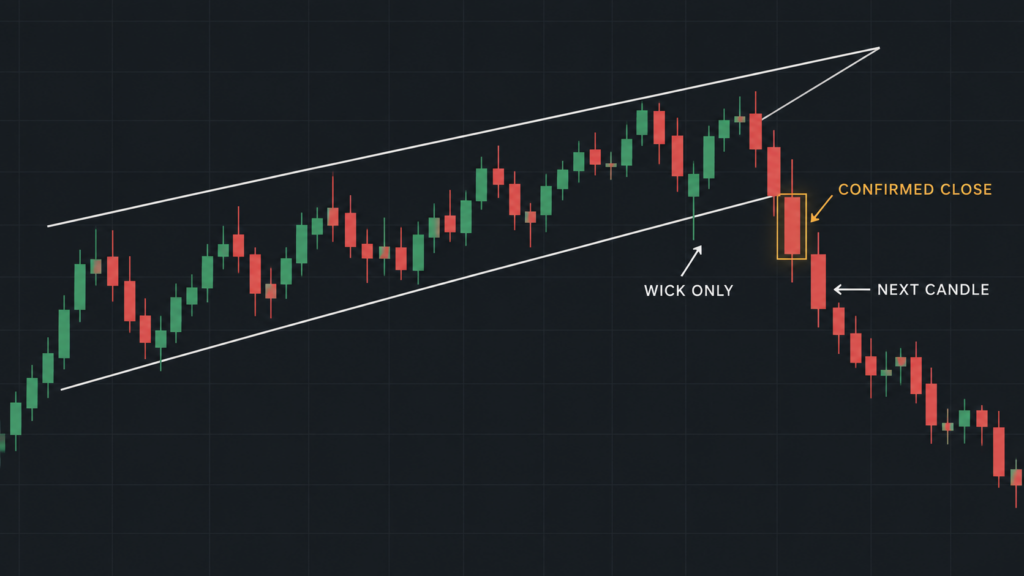
Selling before the break is a guess. The wedge can keep rising for longer than you expect, or break up instead.
Entry on the Retest
After the break, price sometimes climbs back to the broken lower line. That line can now act as resistance. If price touches it and turns down, you can sell there.
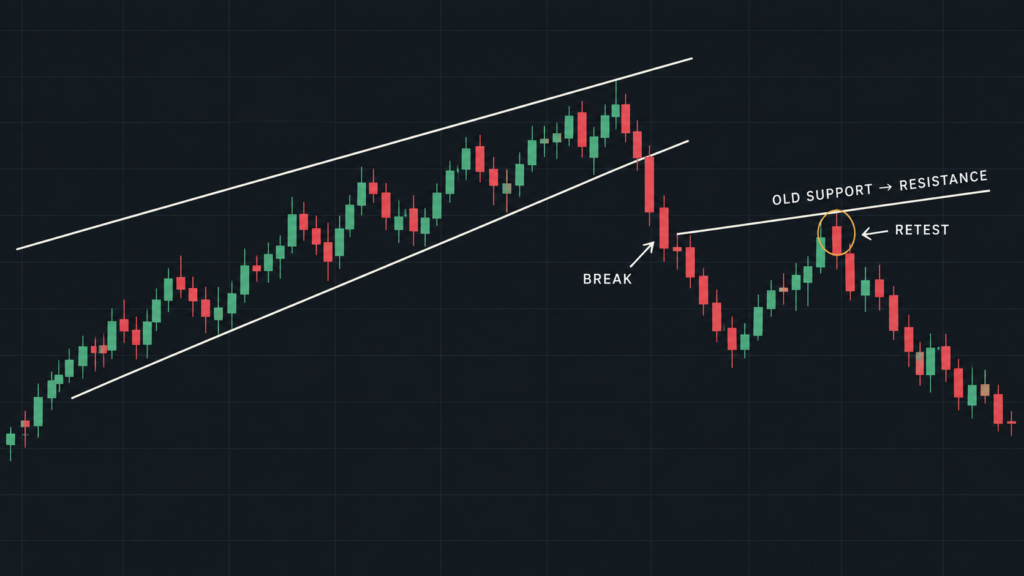
A retest entry gives you a better price and a tighter stop. The trade-off is that price does not always come back, so you may miss the move.
Where to Put the Stop Loss
Place the stop above the last swing high inside the wedge. If you enter on the retest, you can place it above the high of the retest instead.
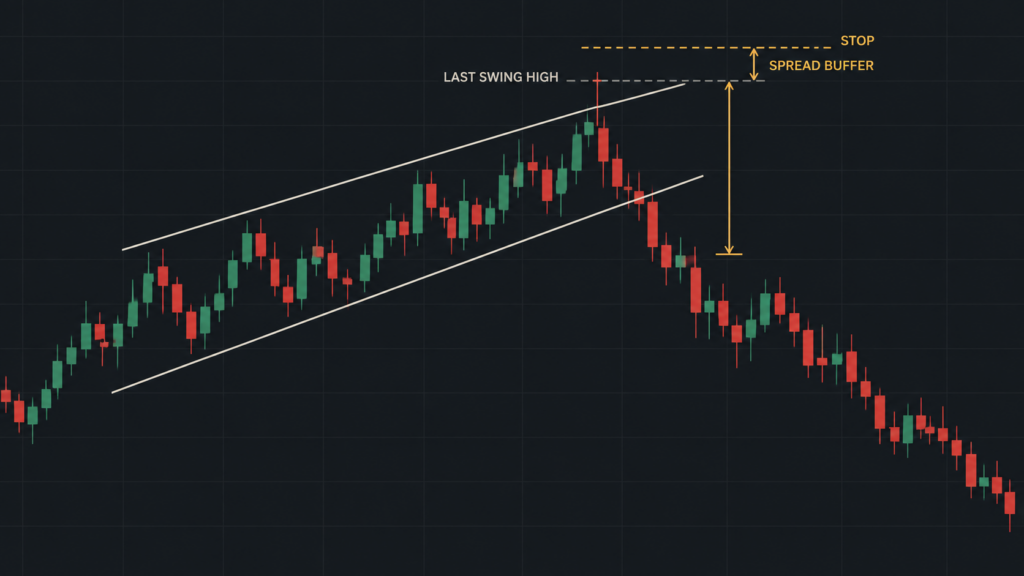
Add a gap for the spread. Your chart may show bid prices only. A sell trade closes at the ask price, which sits above the bid by the spread. So a stop placed right at the chart high can trigger before the chart shows price reaching it.
A stop can fill at a worse price than planned when price gaps or moves fast. Size your trade with that risk in mind.
How to Set a Rising Wedge Target
Measure the height of the wedge at its widest point. This is at the start of the pattern, on the left. Then subtract that height from the price where the breakdown happened. This is called a measured move.
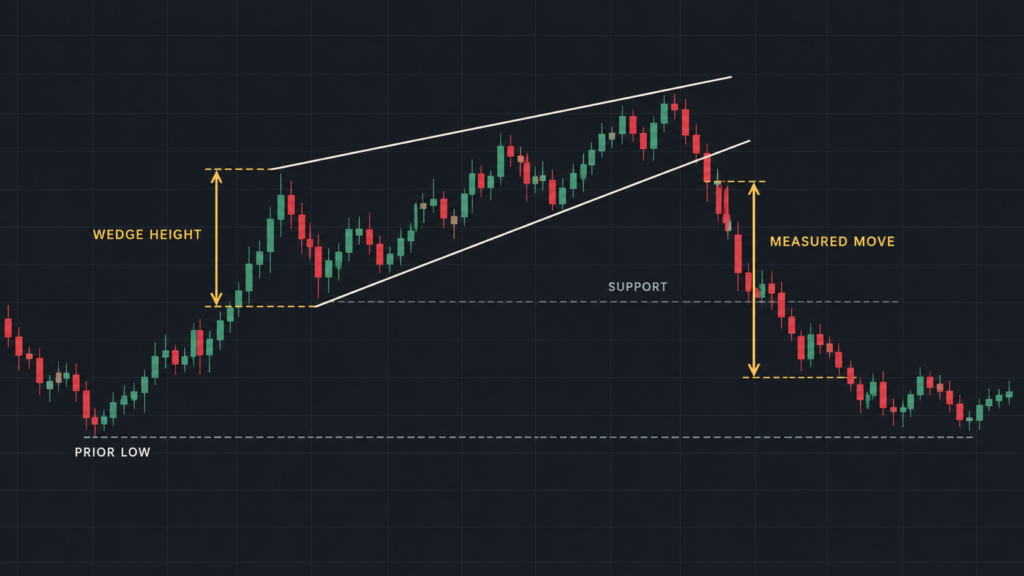
A second reference is the low where the wedge began. Price can move back toward that level. Before you enter, check for any support level between your entry and your target. Price can stall there.
Worked Example
The price levels below are for teaching only. They are not a forecast.
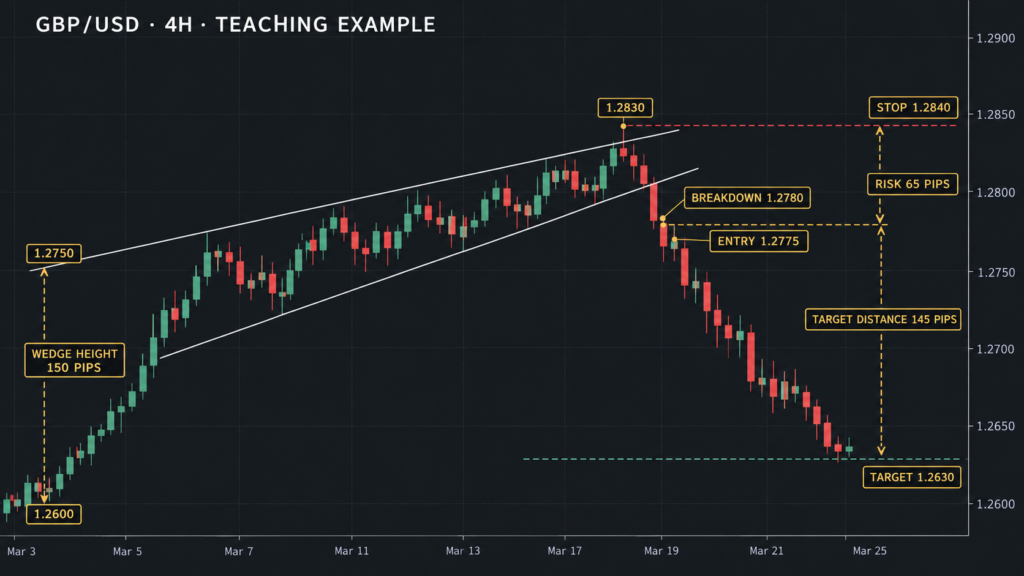
GBP/USD forms a rising wedge on the 4-hour chart after an uptrend. At its widest point, the lower line sits at 1.2600 and the upper line at 1.2750. The wedge is 150 pips tall.
By the end of the pattern, the lower line has risen to about 1.2790. A candle closes below it at 1.2780. The next candle opens at 1.2775, and you sell there. The last swing high inside the wedge is 1.2830, so the stop goes at 1.2840.
For the target, subtract 150 pips from the breakdown price of 1.2780. That gives 1.2630. You risk 65 pips to aim for 145 pips.
Checking the Signal With RSI or MACD
A rising wedge can come with divergence. Price makes a higher high, but the indicator makes a lower high. This shows the push up is getting weaker, which matches what the wedge shows on price.
Divergence is not an entry signal by itself. Use it as a second check before you sell the break. Learn how to spot it in the Relative Strength Index (RSI) guide and the MACD Indicator Guide.
A shooting star candle at the upper line is another sign the push up is weakening. It has a small body and a long upper wick. For candles that share this shape, see the Hammer Candlestick Pattern Cheatsheet.
When a Rising Wedge Fails
Not every rising wedge breaks down. If a candle closes above the upper line, the pattern has failed. Any plan to sell the wedge no longer applies.
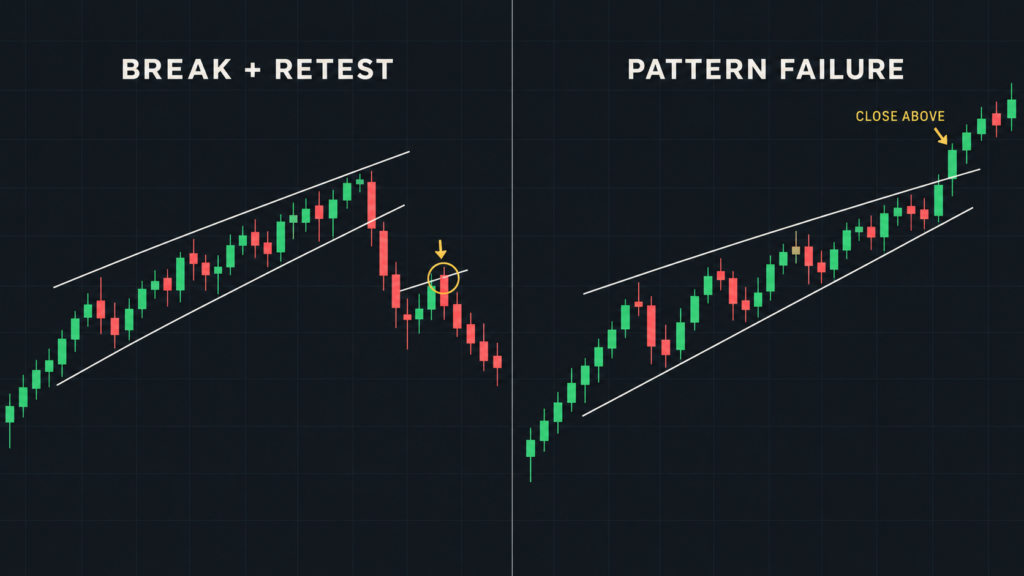
A breakdown can also fail. Price closes below the lower line, then climbs straight back inside the wedge. This is a false breakout, and your stop is there to limit the loss when it happens. What If the Charts Are Lying? A Guide to False Breakouts covers how to filter them.
Common Rising Wedge Mistakes
- Moving the stop when price comes back. If price climbs back into the wedge, moving the stop higher adds risk to a trade that is already going wrong.
- Selling against a strong higher timeframe trend. A rising wedge on a 1-hour chart can form inside a strong daily uptrend. Check the bigger chart before you sell the smaller one.
- Drawing the wedge after the move. Lines drawn after the breakdown look cleaner than they did at the time. Mark the pattern while it forms, so you test the same view you would have had in the trade.
- Trading a very small wedge. On a low timeframe, a tiny wedge can leave a target that is barely bigger than the spread. Check the numbers before you enter.
Rising Wedge FAQ
Is a rising wedge bullish or bearish?
A rising wedge is a bearish pattern. It shows buying pressure getting weaker as price rises. Price can still break up through the upper line, so every rising wedge trade needs a stop.
What is the difference between a rising wedge and a falling wedge?
A falling wedge is the mirror image. Both lines point down and move closer together, with the upper line falling faster. It is a bullish pattern that points to a break up through the upper line.
What timeframe works for a rising wedge?
The pattern can form on any timeframe. A wedge on a 4-hour or daily chart covers days or weeks of price. A wedge on a 5-minute chart covers a few hours, and the spread takes a bigger share of the target. Test the pattern on past charts before you trade it. How to Backtest a Trading Strategy shows you how.
Trading carries risk, and past chart patterns do not predict future price. Content on this page is for education only and is not financial advice.