





What If the Charts Are Lying? A Guide to False Breakouts
A breakout looks the same whether it holds or fails. Price pushes past a level, and momentum picks up. For a moment, the move looks…

A breakout looks the same whether it holds or fails. Price pushes past a level, and momentum picks up. For a moment, the move looks like the start of a trend. Then price turns around and lands right back where it started. That is a false breakout. It does not cost traders because they read the market wrong. It costs them because they read the shape right and missed the follow-through. This guide covers what a false breakout is, why it happens, and how to avoid trading one before it costs you.
What Is a False Breakout
A false breakout happens when price moves past a support or resistance level, then reverses back inside the range before continuing.
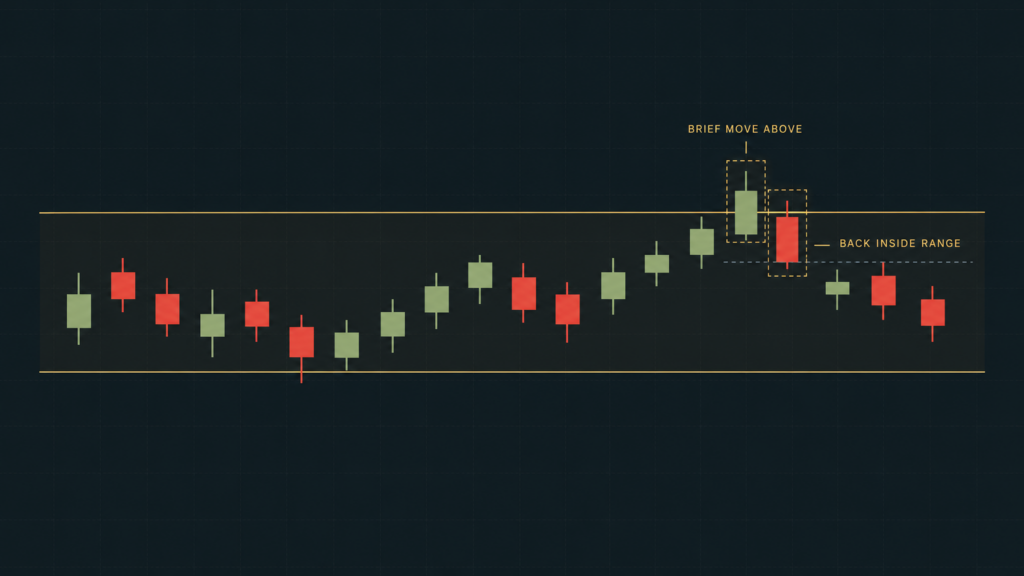
Three signs separate a false breakout from one that holds:
- Price closes back inside the level within a candle or two, instead of continuing away from it.
- Volume during the push is thin, showing few traders actually took part.
- The follow-through never appears. No new high or low forms after the initial push.
None of these signs show up the moment the breakout happens. That is what makes false breakouts costly. By the time the reversal is clear, a trader has often already entered.
Bull Traps and Bear Traps
The two directions a false breakout can take have names traders use often.
- Bull trap: price breaks above resistance, pulls buyers in, then reverses down through the level.
- Bear trap: price breaks below support, pulls sellers in, then reverses up through the level.
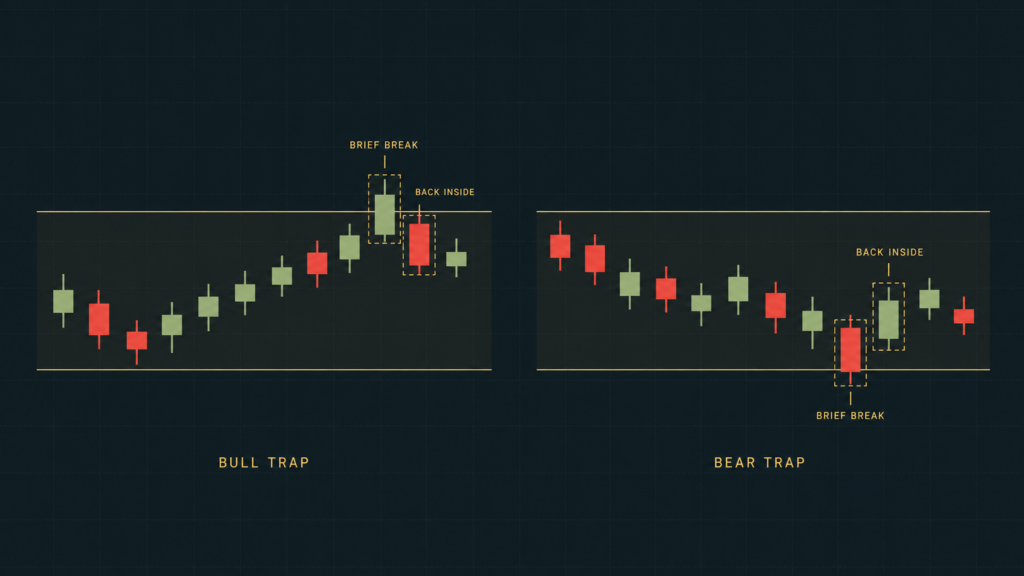
Both work the same way. Price gives a signal that looks complete, and traders act on it. Then the market moves the other way before the position has room to work.
Why They Happen
Two conditions make a false breakout more likely.
- Orders cluster at obvious levels. Many traders place stop-loss and entry orders near the same support or resistance line, since it is visible on every chart. That concentration of orders is part of why price can push through the level briefly, without enough buying or selling behind it to keep going.
- Participation stays thin. A breakout with few traders involved has less behind it. When participation is thin, a small reversal is enough to send price back inside the range.
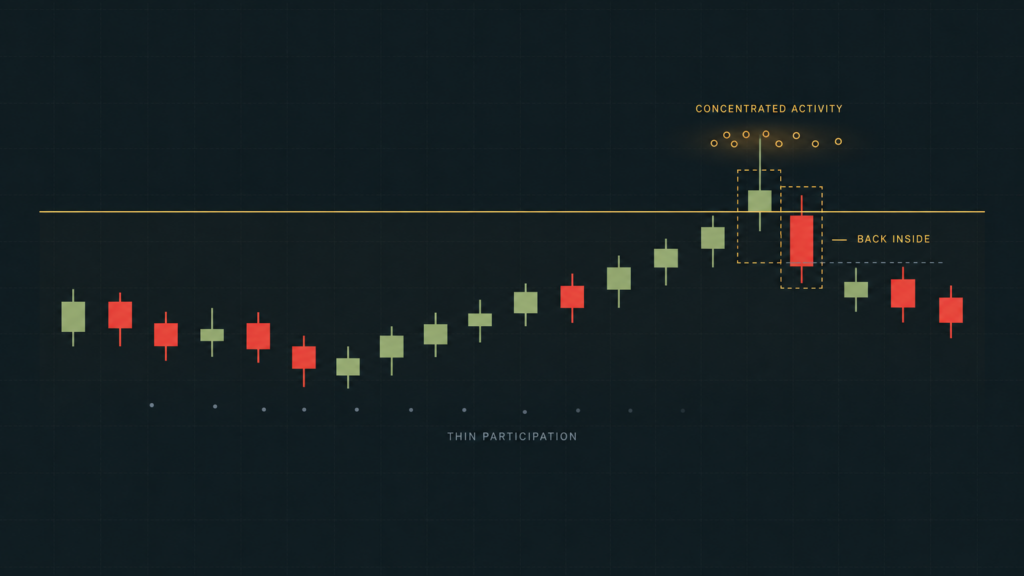
Neither condition is unusual. Both show up on ordinary trading days, in ordinary markets. A false breakout is a normal part of price action, not something rare.
The Same Pattern You Already Know
If this sounds familiar, it should. The failed breakouts described in our sideways markets guide are false breakouts by another name. A sideways market produces them often, because price keeps testing the same two levels without enough force to clear either one.
Read Why Sideways Markets Can Break Traders for the behaviors that make repeated false breakouts so costly. The fixes there apply here too.
How to Avoid Trading the Fakeout
None of these fixes predict a false breakout in advance. They reduce how often you trade one.
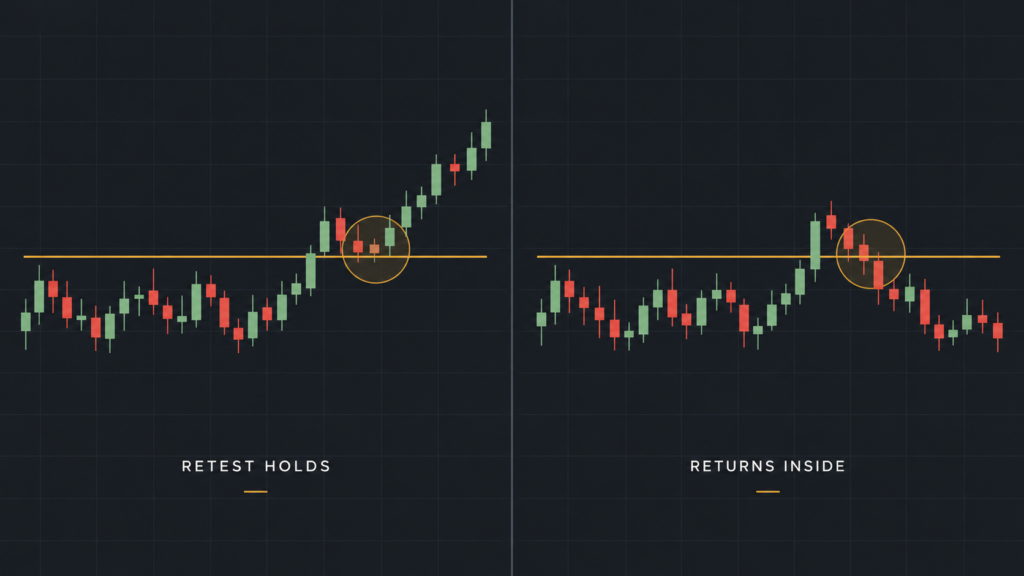
- Wait for the candle to close beyond the level before you treat the breakout as valid.
- Look for a retest. Price often returns to the broken level before it continues, and holding there is a stronger signal than the first push.
- Check a higher timeframe. A breakout that looks strong on a five-minute chart can look weak on a four-hour chart.
- Watch for volume. A breakout with strong participation behind it is less likely to reverse than one with little.
Protecting Your Account
A false breakout costs money in any account. In a funded account, chasing one without confirmation can also push the account toward a rule breach.
When you are ready to trade breakouts with a confirmation process built in, explore FXIFY CFD funded account programs.