

Weekly Market Preview: What’s Moving the Markets This Week (13–17 July)
Five high-impact releases land across three currencies this week. US inflation data on Tuesday and Wednesday sets the tone for the Dollar. The Bank of…

Five high-impact releases land across three currencies this week. US inflation data on Tuesday and Wednesday sets the tone for the Dollar. The Bank of Canada delivers its rate decision on Wednesday. UK GDP and US Retail Sales both land on Thursday.
Wednesday and Thursday are the busiest days on the calendar. Both bring back-to-back releases across multiple currencies.
Here is the full breakdown.
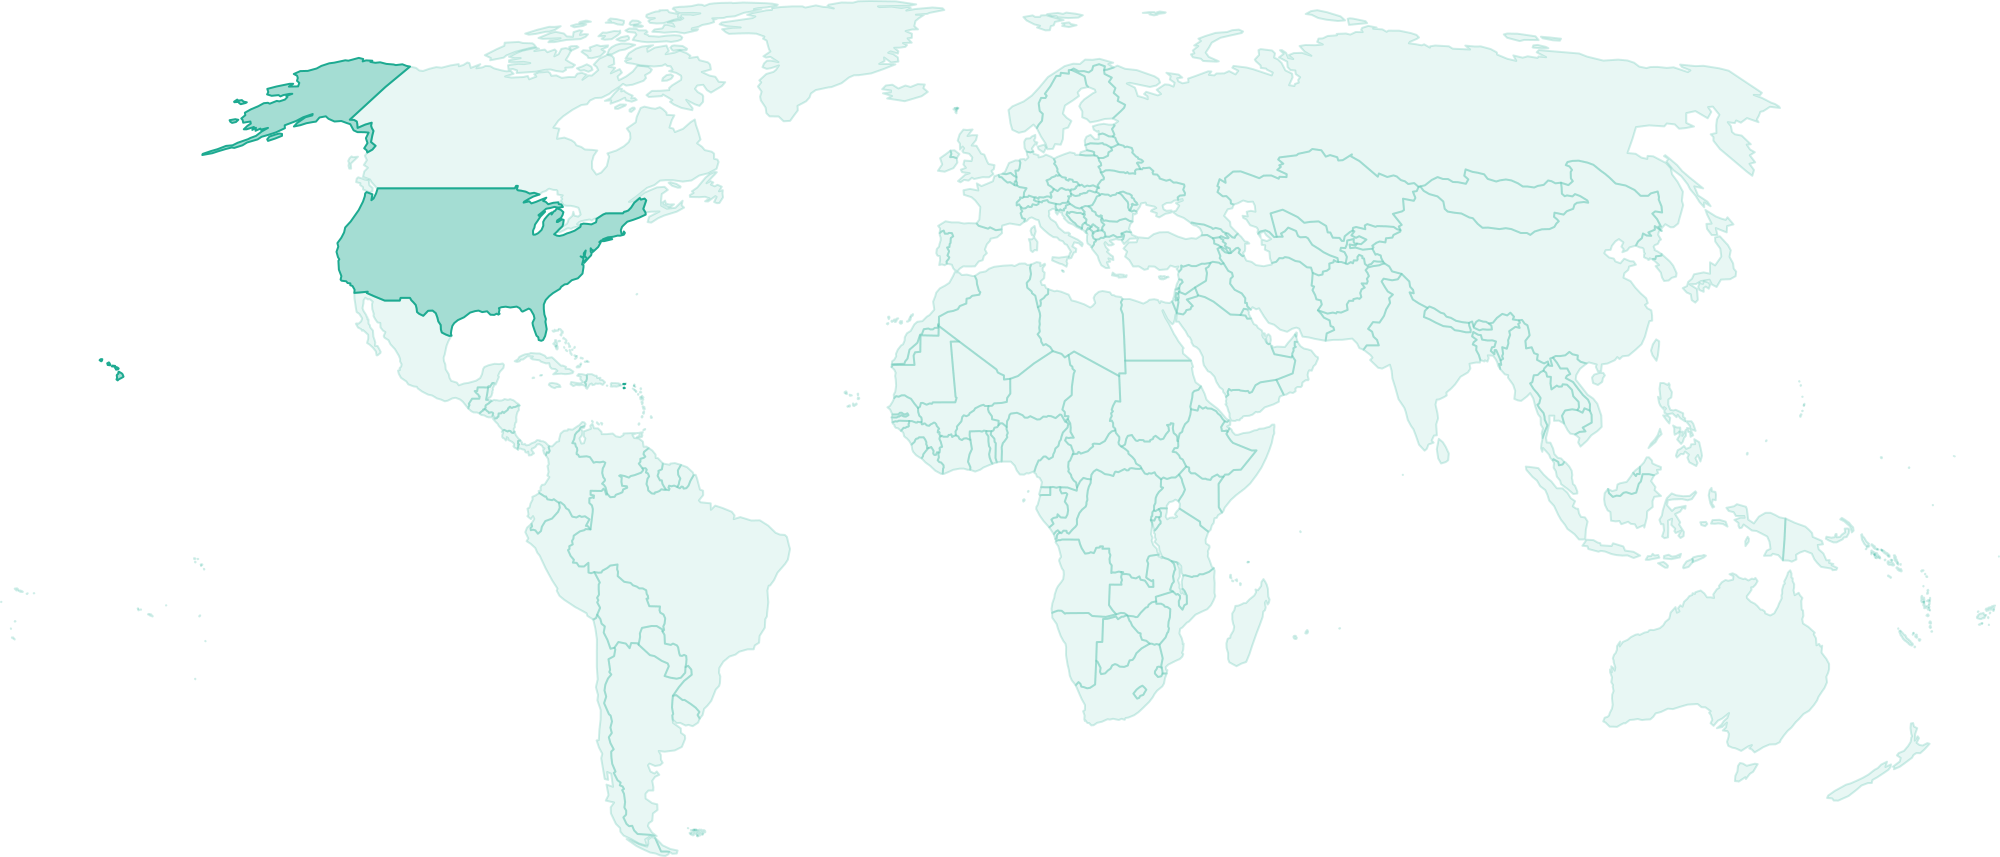
Tuesday, 14 July — Consumer Price Index (USD) | 12:30 PM GMT
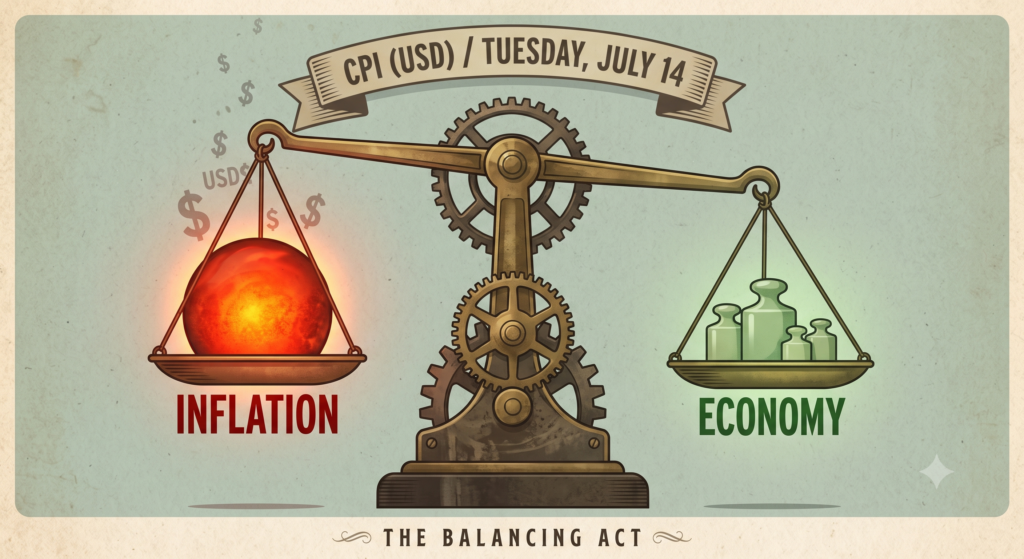
The most closely watched inflation report for the US Dollar. CPI tracks how much everyday consumer goods and services cost across the economy. When this number moves, the Dollar moves with it, and so do expectations for the Federal Reserve’s next policy decision.
May CPI came in at 4.2% year-on-year, up from 3.8% in April, driven primarily by a 23.5% year-on-year surge in energy prices linked to the ongoing Middle East conflict. That back-to-back acceleration in headline inflation was enough to push the Fed’s revised 2026 CPI forecast up to 3.6% at the June FOMC meeting, from 2.7% in March.
For June, analysts are forecasting a split picture. Barclays economist Pooja Sriram projects headline CPI to fall to 3.8% year-on-year, citing the drop in crude prices following the US-Iran interim peace deal signed in mid-June, which sent gasoline prices lower. Continuum Economics forecasts a 9.2% month-on-month decline in gasoline prices in June, which would pull headline inflation down sharply. However, core CPI, which strips out food and energy, is expected to remain elevated, with Continuum forecasting a 0.3% month-on-month rise and Barclays projecting core to accelerate to 0.26% month-on-month. The New York Fed’s June consumer survey showed one-year-ahead inflation expectations climbing to 3.7%, the highest since September 2023.
A soft headline driven by falling petrol prices does not change the underlying inflation picture. Core inflation trends will carry more weight with the Fed than the headline figure.
What traders are watching:
Higher than expected — Bullish USD. Sticky inflation keeps the pressure on the Fed to maintain restrictive policy. The dollar strengthens.
Lower than expected — Bearish USD. Cooling inflation builds the case for rate cuts. The dollar weakens as rate cut expectations increase.
Wednesday, 15 July — Producer Price Index (USD) | 12:30 PM GMT
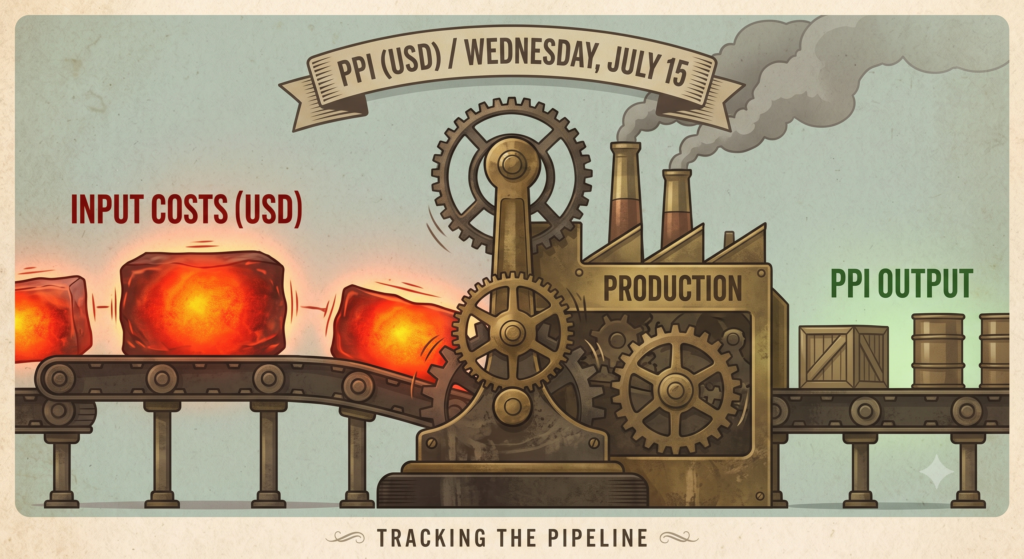
PPI measures the costs that factories and producers incur to produce goods before they reach consumers. It is a leading indicator for future consumer inflation. When producer costs rise, those costs eventually get passed down the supply chain.
May PPI rose 1.1% month-on-month and 6.5% year-on-year, the highest 12-month reading since November 2022, driven largely by a 2.8% surge in goods prices and a 10.7% spike in energy prices. For June, Continuum Economics forecasts headline PPI to come in flat month-on-month, a significant slowdown from two consecutive 1.1% gains, as energy prices correct lower following the US-Iran peace deal. Core PPI, excluding food and energy, is forecast to rise 0.4% month-on-month, matching May’s outcome. Year-on-year, Continuum expects PPI to hold around 6.3%, marginally below May’s 6.5%.
The key question is whether the June energy pullback marks a lasting shift in producer costs or a temporary dip. With core PPI excluding food, energy, and trade expected to reach its highest year-on-year level since October 2022, underlying producer price pressures remain significant.
What traders are watching:
Higher than expected — Bullish USD. Signals that future retail inflation pressures are still building. Strengthens the case for the Fed to hold or hike.
Lower than expected — Bearish USD. Shows supplier costs are declining, easing inflation concerns and raising expectations for eventual rate cuts.
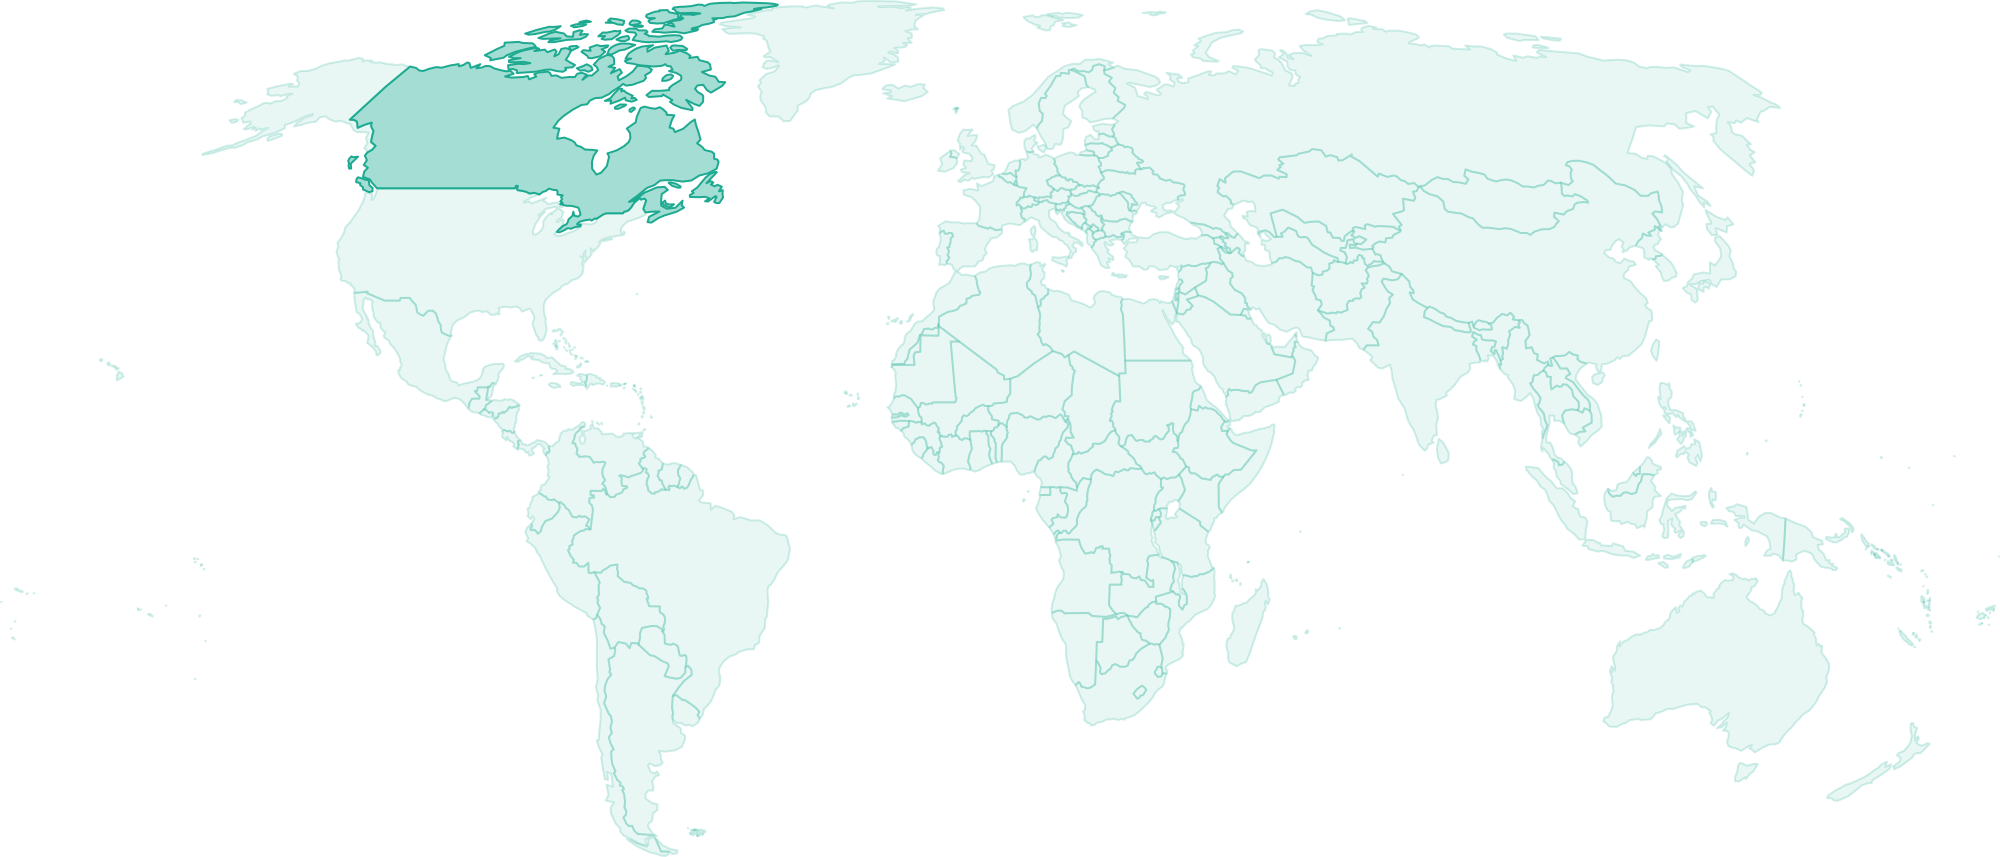
Wednesday, 15 July — Bank of Canada Rate Statement and Overnight Rate (CAD) | 1:45 PM GMT
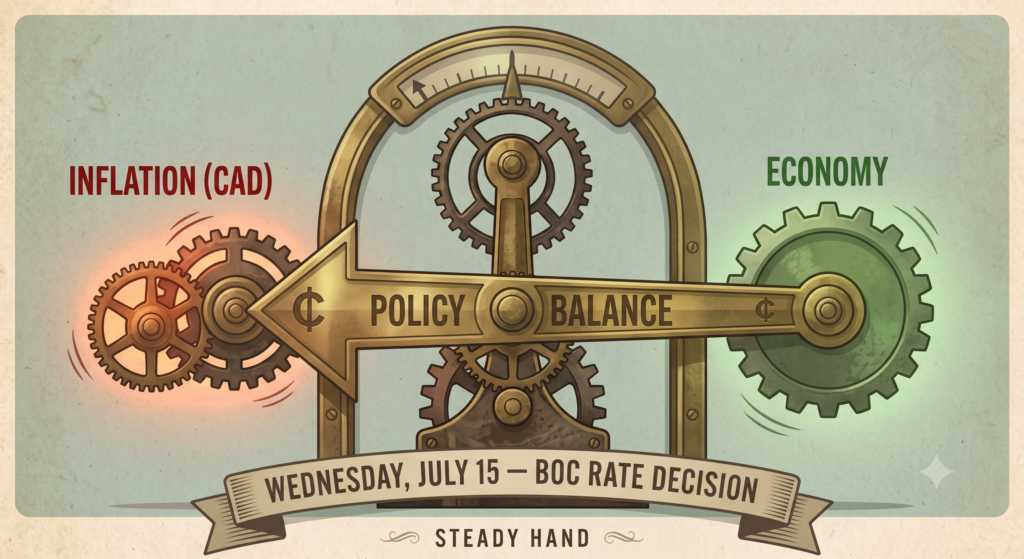
The major event for the Canadian Dollar this week. The Bank of Canada must balance weak domestic growth against a more complicated inflation picture, and communicate its policy path clearly to the market.
The BoC has held rates at 2.25% for five consecutive decisions since October 2025. At its June meeting, the Bank acknowledged what it has described as a two-sided policy challenge: weak Q1 GDP growth of -0.1% annualized creates pressure to ease, while headline CPI rising to 3.2% in May, the first time above 3% since late 2023, creates pressure to hold or tighten. Core inflation measures remain near 2%, suggesting the energy-driven spike in the headline has not spread broadly to other prices.
Since the June meeting, the picture has shifted in the BoC’s favour. April GDP rebounded 0.5% month-on-month, the strongest reading since July 2025. Canada’s unemployment rate improved to 6.5% in June, down from 6.6% in May. Oil prices have moved lower, reducing near-term headline inflation risk. RBC Economics noted this week that the Bank is widely expected to hold rates unchanged at 2.25% on July 15, marking a sixth consecutive pause. Bond markets currently price in a 10% probability of a 25-basis-point hike and a near-zero probability of a cut.
The focus for traders will be on the tone of the accompanying Monetary Policy Report, which the Bank releases quarterly alongside this decision. Any upgrade to the growth outlook or shift in language around inflation risk is likely to be the key signal for CAD traders.
What traders are watching:
Rate cut or dovish hold — Bearish CAD. If the Bank signals concern about economic weakness, the Loonie weakens.
Hold with hawkish tone — Bullish CAD. If the Bank focuses on remaining inflation risks and signals readiness to act if conditions deteriorate, CAD strengthens.
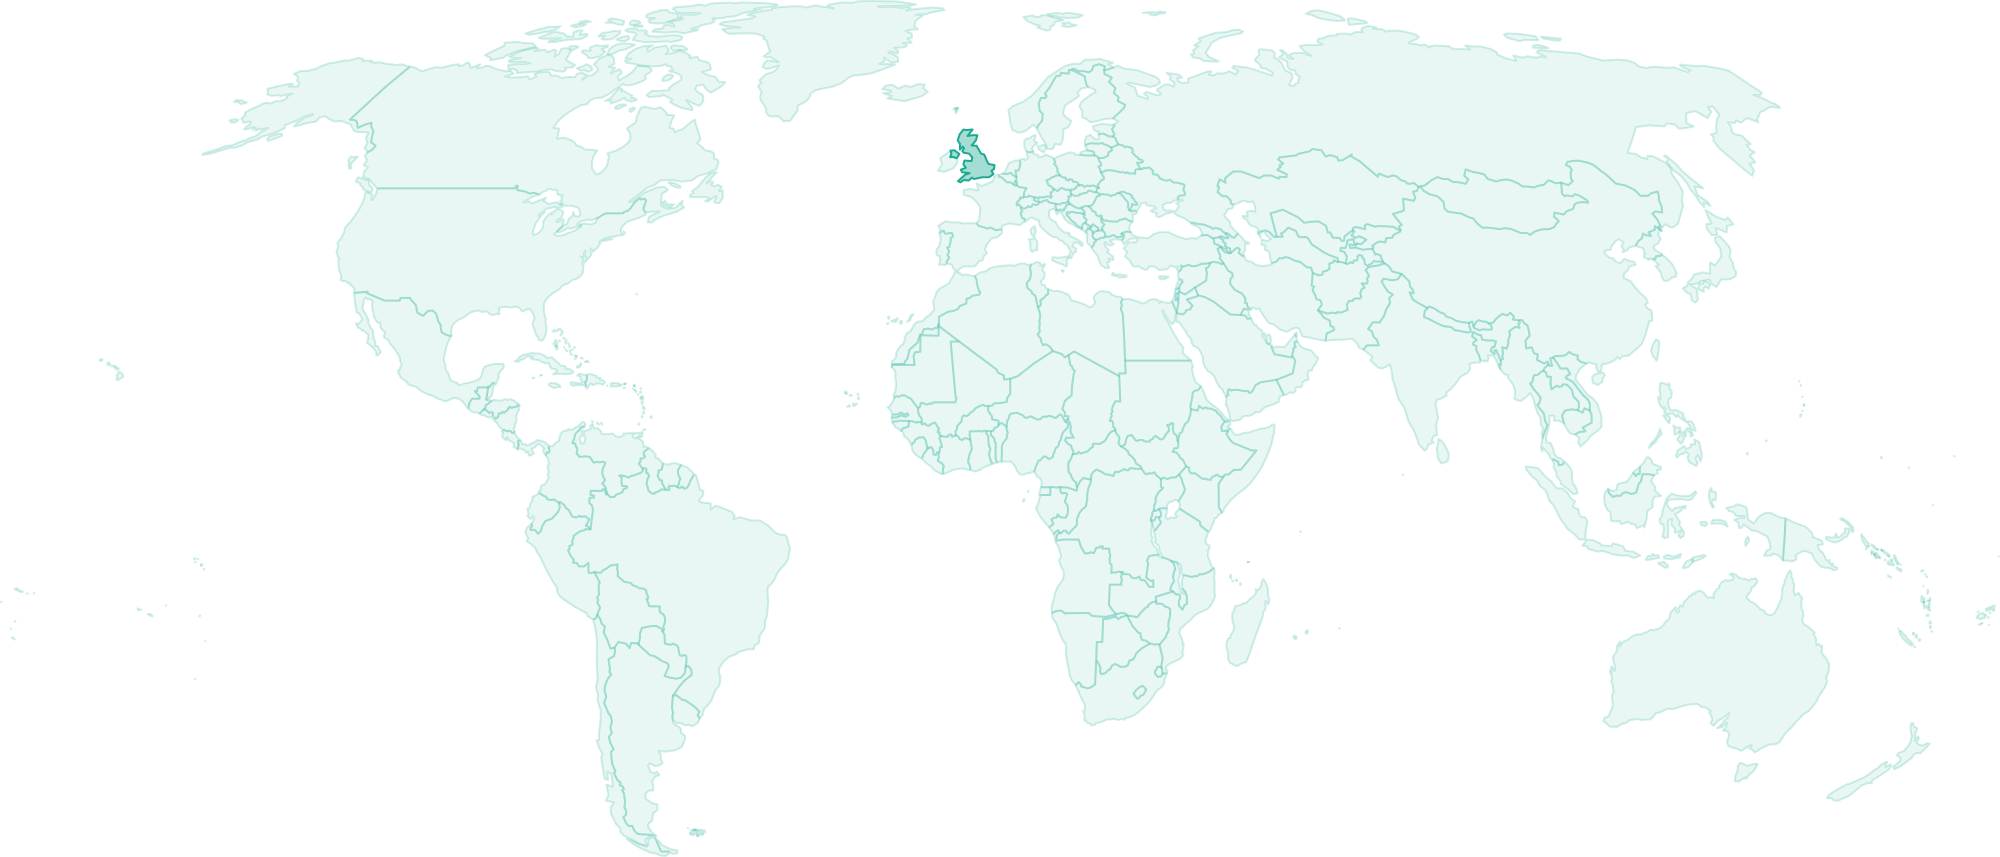
Thursday, 16 July — UK Gross Domestic Product (GBP) | 6:00 AM GMT
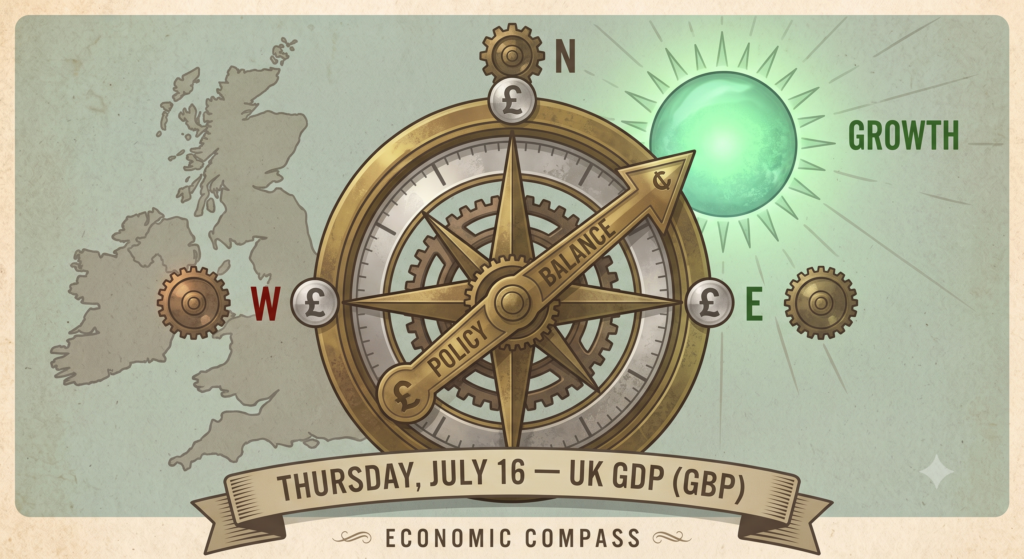
The monthly economic report card for the United Kingdom. GDP measures the total value of goods and services produced across the UK economy. A positive reading suggests British businesses are holding up despite the elevated rate environment. A weaker reading would increase pressure on the Bank of England to consider rate cuts at a future meeting.
UK GDP grew 0.6% in Q1 2026, following 0.1% growth in Q4 2025, supported by a 0.8% expansion in services output. However, the monthly data have been more mixed. April 2026 GDP fell 0.1% month-on-month, the first monthly contraction since November 2025, as services output fell 0.2% and consumer-facing services dropped 0.5%. The OECD has forecast UK GDP growth of 0.9% for the full year 2026, while the IMF lowered its own UK growth forecast from 1.3% to 0.8%, citing the impact of the Middle East conflict on energy supply and inflation. The Treasury’s June 2026 survey of independent forecasters showed an average full-year growth forecast of 0.9% for 2026.
Thursday’s release covers May GDP. The Bank of England held rates at 3.75% at its June meeting and the May GDP print will feed directly into the MPC’s September deliberations. May’s reading will provide an updated picture of UK economic momentum ahead of the August MPC meeting.
What traders are watching:
Higher than expected — Bullish GBP. Suggests economic growth is holding up. Reduces pressure on the Bank of England to cut rates and gives the Pound a lift.
Lower than expected — Bearish GBP. Raises concerns about the UK growth trajectory. Increases the case for eventual rate cuts and weighs on GBP.
Thursday, 16 July — US Retail Sales (USD) | 12:30 PM GMT
Retail Sales measures total spending in American stores and online. Because consumer spending drives roughly two-thirds of US GDP, this report is one of the clearest reads on economic momentum. A strong print signals the US consumer is holding up despite elevated interest rates.
Retail Sales have beaten expectations in four of the last five months. May retail sales rose 0.9% month-on-month, well above the 0.5% forecast and up 6.9% year-on-year, with retail trade sales up 7.5% year-on-year. However, much of the recent strength has been driven by gasoline station receipts, which surged as fuel prices rose due to the Middle East conflict. Excluding gas stations, May sales still rose 0.7%, suggesting consumer spending beyond the energy category remained solid. The control group, which feeds directly into GDP calculations, rose 0.7% in May.
For June, analysts expect the energy price pullback following the US-Iran interim peace deal to weigh on gasoline station receipts, potentially dragging the headline number lower. The underlying picture matters more than the headline. Whether core spending has held up will be the more important signal for rate expectations.
What traders are watching:
Higher than expected — Bullish USD. A resilient consumer reduces pressure on the Fed to cut rates. The dollar supported.
Lower than expected — Bearish USD. Signals consumer spending is cooling, increasing expectations for rate cuts. The dollar weakens.
Calendar Snapshot
| Date | Event | Currency | Time (GMT) |
|---|---|---|---|
| Tue 14 Jul | Consumer Price Index | USD | 12:30 PM |
| Wed 15 Jul | Producer Price Index | USD | 12:30 PM |
| Wed 15 Jul | BoC Rate Statement and Overnight Rate | CAD | 1:45 PM |
| Thu 16 Jul | Gross Domestic Product | GBP | 6:00 AM |
| Thu 16 Jul | Retail Sales | USD | 12:30 PM |
A Quick Note on Risk
Economic data releases can cause sharp, fast moves in the market. Price can spike in both directions before settling. This week brings back-to-back releases on Wednesday and Thursday, covering multiple currencies. Make sure you understand how your FXIFY account drawdown rules work before you trade around major news events. For more on how funded traders approach volatile sessions, see our guides on trading styles for funded traders and how news events affect prop traders.