Best TradingView Indicators: The Top Tools for Smarter Trading
TradingView indicators apply math to price and volume data. They display the results directly on your chart. They do not predict the market. They help…
TradingView indicators apply math to price and volume data. They display the results directly on your chart. They do not predict the market. They help you read what is happening now.
This guide covers the best TradingView indicators on the platform. You will learn how each one measures momentum, trend, or volatility, what it does well, and where it breaks down. By the end, you will know which tools to use and when.
Quick Summary Table
| Indicator | Type | What It Shows | Standard Settings | Best Use Case |
| Moving Average (MA/EMA) | Trend | Direction of price over time | 50 EMA / 200 SMA | Identifying trends and dynamic support/resistance |
| RSI | Momentum | Speed and magnitude of price change | 14 Period (70/30) | Spotting overbought/oversold conditions |
| MACD | Trend + Momentum | Relationship between two moving averages | 12, 26, 9 | Confirming trend direction and momentum shifts |
| Bollinger Bands | Volatility | Price range relative to a moving average | 20 Period, 2 Standard Deviations | Identifying periods of expansion and contraction |
| Volume | Volume | Units traded per period | Default (with 20 MA) | Confirming the strength of a price move |
Table of Contents
- What Are TradingView Indicators?
- Why Indicators Matter in Trading
- Best TradingView Indicators Explained
- Combining Indicators for Maximum Clarity
- Common Mistakes When Using Indicators
- Trading on TradingView With FXIFY
- Key Takeaways
- FAQ
What Are TradingView Indicators?
TradingView indicators are mathematical tools applied to price or volume data. They display results directly on your chart in two formats.
- Overlay indicators such as Moving Averages and Bollinger Bands sit on the price chart itself.
- Oscillators such as RSI and MACD appear in a separate panel below the chart.
Indicators do not generate signals on their own. You should use them to add context to raw price movement.
Why Indicators Matter in Trading
Technical indicators serve three functions
- Decision support: They impose structure on raw price movements, which can be difficult to interpret on their own.
- Confirmation: A price move supported by aligned indicator data carries more weight than one not supported by aligned indicator data.
- Timing: Some indicators help identify when conditions may be shifting, supporting more deliberate entry and exit decisions.
Indicators do not eliminate risk. They reduce ambiguity. Use them to improve your timing and risk management.
Best TradingView Indicators Explained
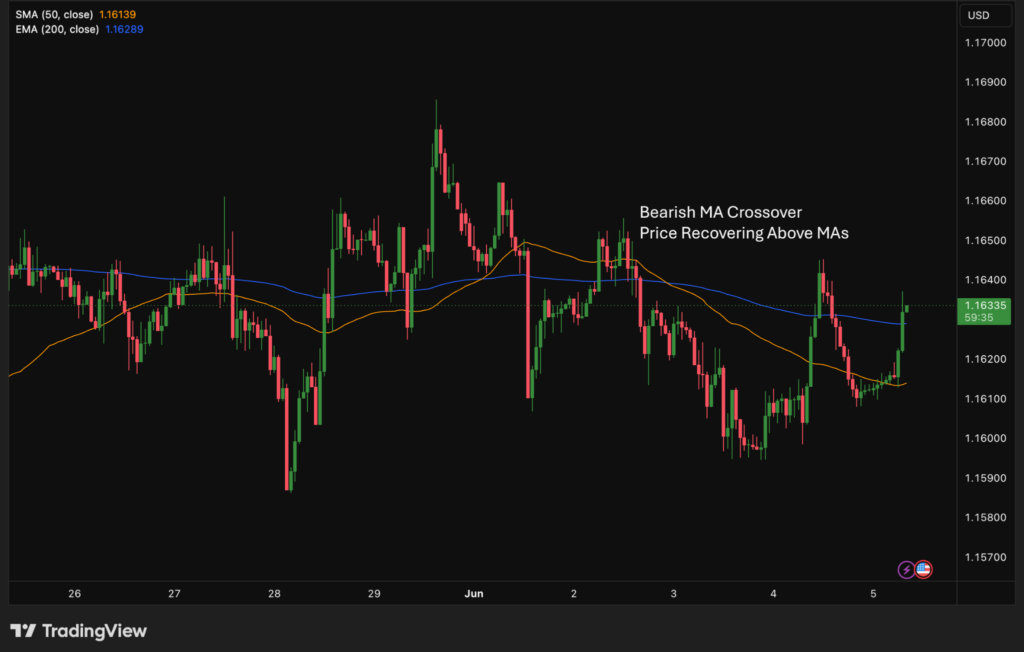
Moving Average: Identify Trend Direction
What it is: A Moving Average calculates the average price over a set number of periods. The Exponential Moving Average (EMA) weights recent prices more heavily than the Simple Moving Average (SMA).
What it measures: The general direction of price over time. A rising MA suggests an uptrend. A falling MA suggests a downtrend.
Suggested Starter Settings:
- Short/Medium Term: 50-period EMA. Great for identifying the immediate trend on 1H or 4H charts.
- Long Term: 200-period SMA. Widely used by institutional traders to define the macro trend.
How traders use it:
- Identifying trend direction (Price above MA = Bullish).
- Using the MA line as dynamic support or resistance.
- Watching for price crossovers above or below the line (e.g., 50 EMA crossing above 200 SMA).
- Using two MAs of different lengths to spot crossover events (e.g., 50 EMA vs 200 EMA).
Limitations:
- Lagging indicator. MAs react after the price has already moved.
- Produces frequent false signals in sideways/ranging markets.
- The period length significantly affects output. There is no universally correct setting.
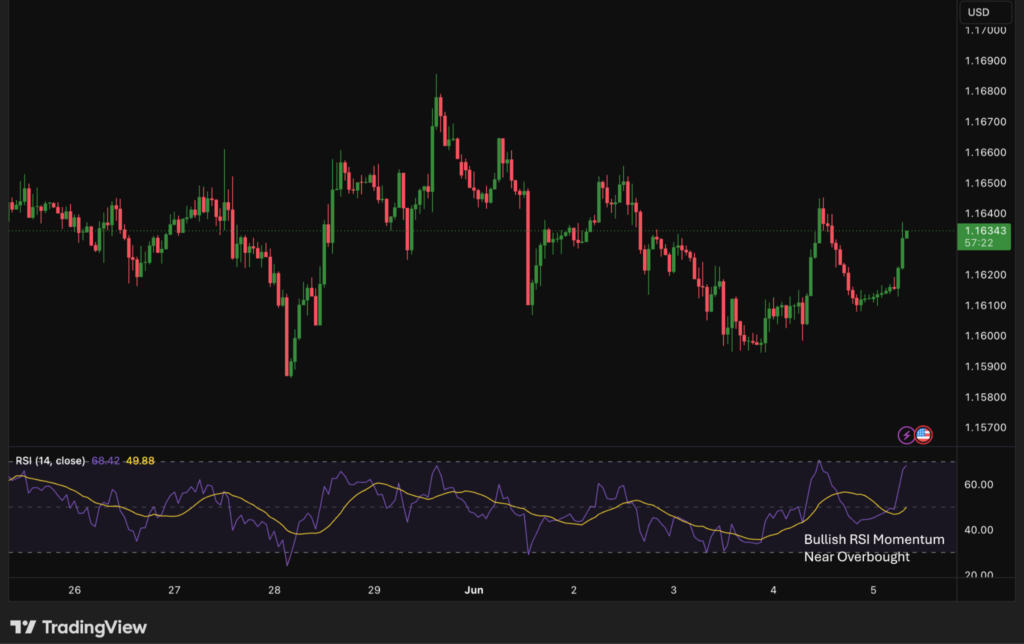
RSI: Measure Momentum and Spot Extremes
What it is: The Relative Strength Index is a momentum oscillator developed by J. Welles Wilder. It displays a value between 0 and 100.
What it measures: Whether the price has moved too far, too fast, in one direction. Readings above 70 suggest overbought conditions. Readings below 30 suggest oversold conditions.
Suggested Starter Settings:
- Length: 14 periods (Default).
- Upper Band: 70 (Overbought).
- Lower Band: 30 (Oversold).
Pro Tip: In strong uptrends, some traders adjust the levels to 80/40 to account for higher momentum.
How traders use it:
- Identifying overbought and oversold readings.
- Spotting RSI divergence, which is when price makes a new high or low but RSI does not follow.
- Confirming trend strength during sustained moves.
Limitations:
- Overbought does not mean reversal. RSI can stay above 70 for extended periods in strong trends.
- Divergence signals only a potential shift in momentum. It does not guarantee reversal.
- Default settings (14 periods) may not suit all timeframes or instruments.
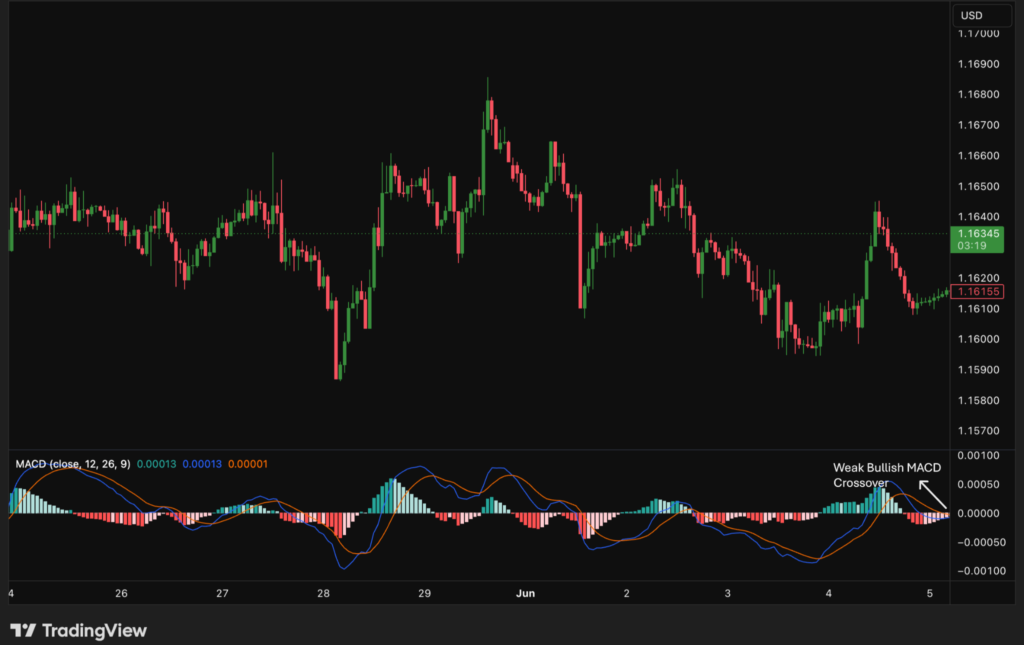
MACD: Track Momentum Shifts on TradingView
What it is: The Moving Average Convergence Divergence indicator tracks the relationship between two EMAs — typically the 12 and 26-period.
What it measures: The MACD line is the 12-EMA minus the 26-EMA. A signal line (9-period EMA of the MACD) plots alongside it. A histogram shows the difference between the two.
Suggested Starter Settings:
- Fast Length: 12
- Slow Length: 26
- Signal Smoothing: 9
- Source: Close price.
How traders use it:
- Watching for the MACD line to cross above or below the signal line.
- Reading the histogram to gauge whether momentum is increasing or decreasing.
- Identifying MACD divergence with price.
Limitations:
- Lagging by nature. Signals appear after the price has already moved.
- Crossover signals in low-volatility markets are unreliable.
- The histogram may appear visually significant, while the actual values remain small.
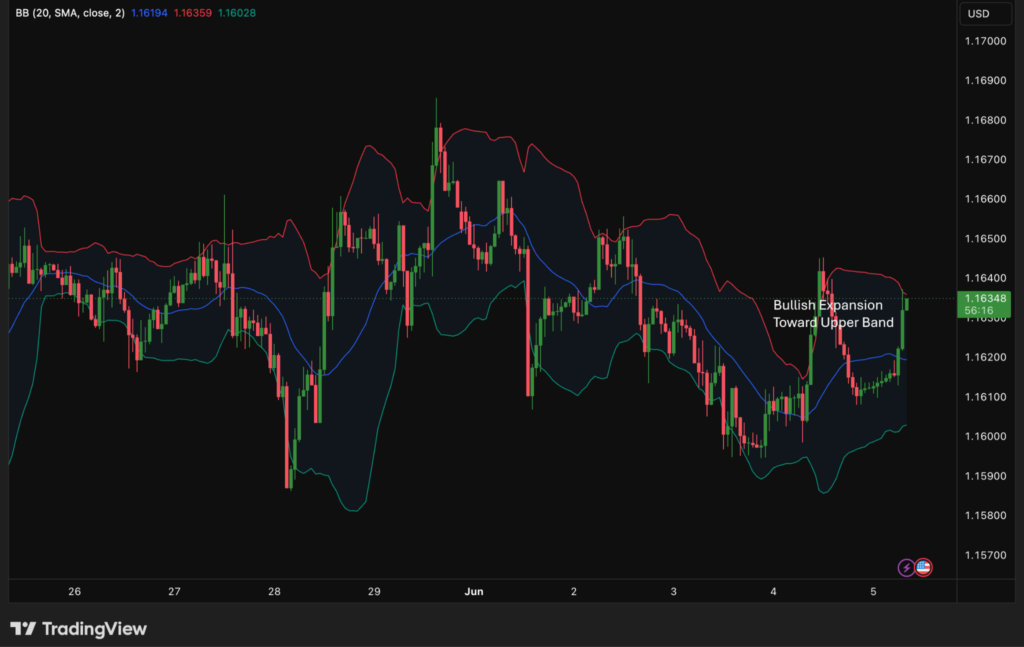
Bollinger Bands: Read Volatility as a Technical Indicator
What it is: Bollinger Bands consist of three lines that react to market volatility. The middle band is typically a 20-period SMA. Two outer bands plot at two standard deviations above and below it.
What it measures: Price volatility. The bands widen when volatility is high. They contract when volatility is low.
Suggested Starter Settings:
- Length: 20
- Standard Deviation: 2
- Basis: SMA
How traders use it:
- Identifying band squeezes. Periods of low volatility suggest a large move may be coming.
- Observing when the price moves outside the outer bands.
- Using the middle band as a dynamic reference point.
Limitations:
- Touching a band is not a signal on its own. Price can ride along an outer band for extended periods.
- Standard deviation describes historical volatility, not future direction.
- Default settings suit some instruments more than others.
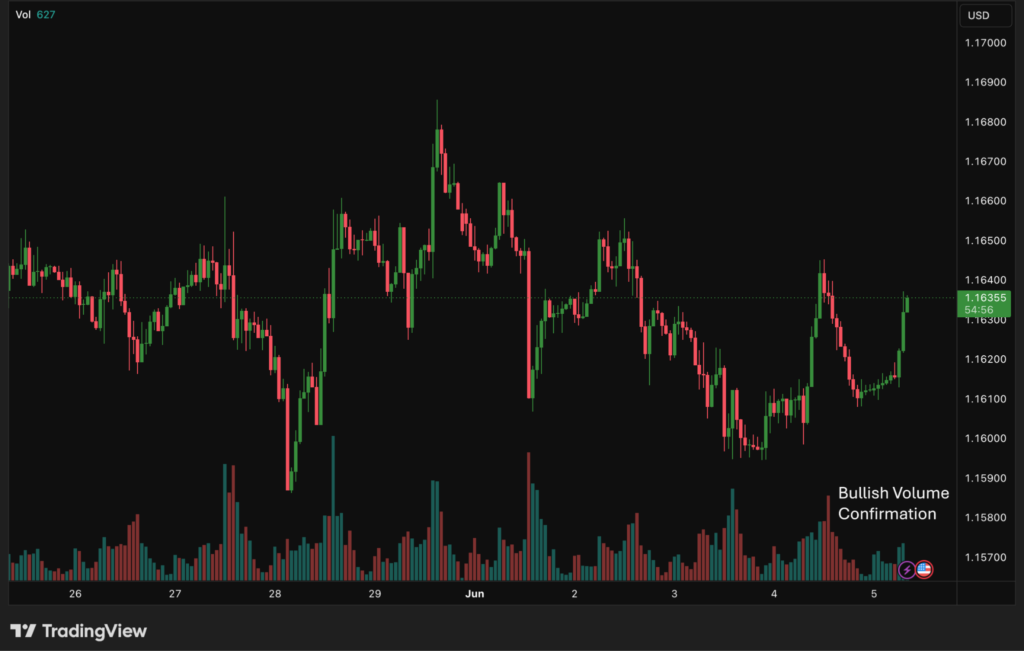
Volume: Confirm Price Moves
What it is: Volume measures the total units traded in a given period, displayed as a bar chart below the price chart.
What it measures: The level of participation behind a price move. High volume suggests conviction. Low volume may suggest the move lacks follow-through.
Suggested Starter Settings:
- Volume MA: Enable the “Volume MA” in settings and set it to 20.
- Interpretation: If a volume bar is above the 20 MA, the current move has above-average participation.
How traders use it:
- Confirming breakouts on high volume.
- Identifying divergence when price rises while volume declines.
- Reading accumulation and distribution over time.
Limitations:
- In forex, TradingView uses tick volume (the frequency of price changes) rather than the absolute central exchange volume. It is an approximation only.
- High volume does not guarantee a sustained move.
- Volume alone does not indicate direction.
Combining TradingView Indicators for Maximum Clarity
Avoid stacking multiple indicators from the same category. Two momentum oscillators (for example, RSI and Stochastic) tend to trigger the same signal at the same time, creating noise rather than confirmation.
Instead, pair a trend tool with a momentum oscillator. A Moving Average shows direction. RSI shows speed. They measure different things, so the signals complement each other. Adding volume as a third input indicates whether market participation supports the price and momentum.
A common starter setup pairs three different inputs:
- Trend: 50 EMA (To see the direction).
- Momentum: RSI (To see if the move is overextended).
- Confirmation: Volume (To see if big players are involved).
No combination works across all market conditions. Understand what each tool measures, and use it for that purpose.
For more on how trading style affects the tools that fit you, see Which Trading Style Is Best for You?
Common Mistakes When Using TradingView Indicators
- Overloading the chart: Adding too many indicators creates visual noise rather than clarity.
- Blind reliance on signals: A crossover or overbought reading is a data point, not a guaranteed signal.
- Ignoring price action: Indicators are derived from price. Price itself remains the primary source of information.
- Ignoring context: An RSI reading of 72 means something different in a strong uptrend than in a ranging market.
- Adjusting settings retroactively: Fitting indicator settings to historical price data does not translate to live trading performance.
Trading on TradingView With FXIFY
FXIFY allows you to open, manage, and close trades directly within TradingView using your FXIFY account credentials. This was made possible through FXIFY’s partnership with Alchemy Markets, which brings the platform’s charting tools together with broker-backed execution infrastructure.
FXIFY offers TradingView, MT5, and DXTrade, allowing you to choose the platform that best fits your approach. TradingView can be selected directly at checkout.
For traders working through an FXIFY evaluation program, the indicators covered in this article are available directly within the platform you use to execute. Your analysis and execution stay in one place.
Key Takeaways
- TradingView indicators analyze price and volume data. They do not predict outcomes.
- Moving Averages identify trend direction but lag behind price.
- RSI measures momentum and highlights potential overbought/oversold conditions, not guaranteed reversals.
- MACD tracks momentum shifts between two EMAs. It is also a lagging tool.
- Bollinger Bands display volatility. Touching the band is not a standalone signal.
- Forex volume on TradingView is tick-based, not absolute.
- Combine indicators from different categories: trend, momentum, and volume.
- No indicator works in all market conditions.
- Price action remains the primary source of information. Indicators provide context.
FAQ: TradingView Indicators Explained
What are the best TradingView indicators for beginners?
Start with the Moving Average and RSI. Both are built into TradingView, widely documented, and straightforward to read. Understand what each one measures before adding anything else.
Which TradingView indicator is most accurate?
No indicator is universally accurate. Each one is a mathematical formula applied to historical price data. Performance depends on market conditions, timeframe, and the context in which the indicator is used.
Can you trade using indicators alone?
No. Indicators are derived from price. They provide structure and context but do not account for news events, liquidity conditions, or full market structure. Most traders use indicators alongside price action analysis.
What is the difference between a leading and a lagging indicator?
Lagging indicators react to price movement that has already occurred. Moving Averages and MACD are examples. Leading indicators attempt to signal a move before it occurs. RSI is sometimes described this way, though it still relies on historical data. No indicator reliably predicts future price.
How many indicators should I use at once?
Most traders use between two and four, from different categories. Too many indicators produce conflicting signals, making it harder to act on any of them.
Do TradingView indicators work on all asset classes?
The calculations apply to any asset with price data. Volume-based indicators behave differently in forex because TradingView uses tick volume as a proxy for real traded volume. Apply volume data in forex markets with that limitation in mind.
Can FXIFY traders use TradingView?
Yes. FXIFY traders can select TradingView at checkout and trade directly within the platform using their account credentials, without switching between tools.